

2025 Market Outlook
with David Prince

The Markets
As we approach 2025, the financial markets present both opportunities and challenges across various sectors.
To help you prepare, I have collaborated with David Prince to bring you his market feel and strategic insights combined with my charts and technical analysis (The Technical View). This comprehensive analysis explores how key sectors and assets—from tech giants to emerging technologies and traditional sectors—could shape investment opportunities in the coming year.
We hope you find it useful.
Unlock Your Trading Potential with Premium Access!
Exciting news! Trading-Adventures.com now offers a Premium Subscription designed to elevate your trading experience.
What You’ll Enjoy:
In-Depth Market Analysis: Discover hidden opportunities beyond surface trends.
Advanced Trading Tools: Access premium charts and comprehensive education.
Access to Premium Content: Enjoy exclusive articles, videos, and tutorials that explore advanced trading techniques and market analysis.
Ready to Elevate Your Trading Game?
Click the button below to start your Premium Trading Adventure today!
P.S. Free subscribers will continue to receive our bi-weekly Market Updates!
2025 Market Outlook
The Magnificent Seven (MAG 7) stocks have dominated market performance over the past two years. However, 2025 may see more modest gains for this group. While this doesn't necessarily signal a sell-off, several factors could lead to less robust performance:
Challenging year-over-year comparisons after record results in 2024
Potentially fewer opportunities for the group as a whole
Valuations may already price in future growth
Key Points to Consider
NVDA (NVIDIA)
Demand continues to outpace supply.
25-30% corrections may present buying opportunities
New all-time highs are expected, but 200% moves are unlikely in the short term.
NVIDIA continues to face overwhelming demand. Having more orders than you can fulfill is a fantastic problem for any company. News and rumors that create selloffs will be welcomed as buying opportunities. New highs are expected in 2025, though the crazy moves of 2024 (+100% from Jan. to March and +86% from April to June) seem unlikely.
The Technical View
$NVDA has been consolidating and trading virtually flat for the last six months. During that time, the weekly RSI moderated while holding above 50 to maintain bullishness, and the average volume was cut roughly in half.
Watch for a simultaneous break of RSI, price, and volume over and above the declining trendlines. If all of these happen together, there will be a high probability of $NVDA reaching the next Fibonacci extension level near $228 - a gain of 60%.
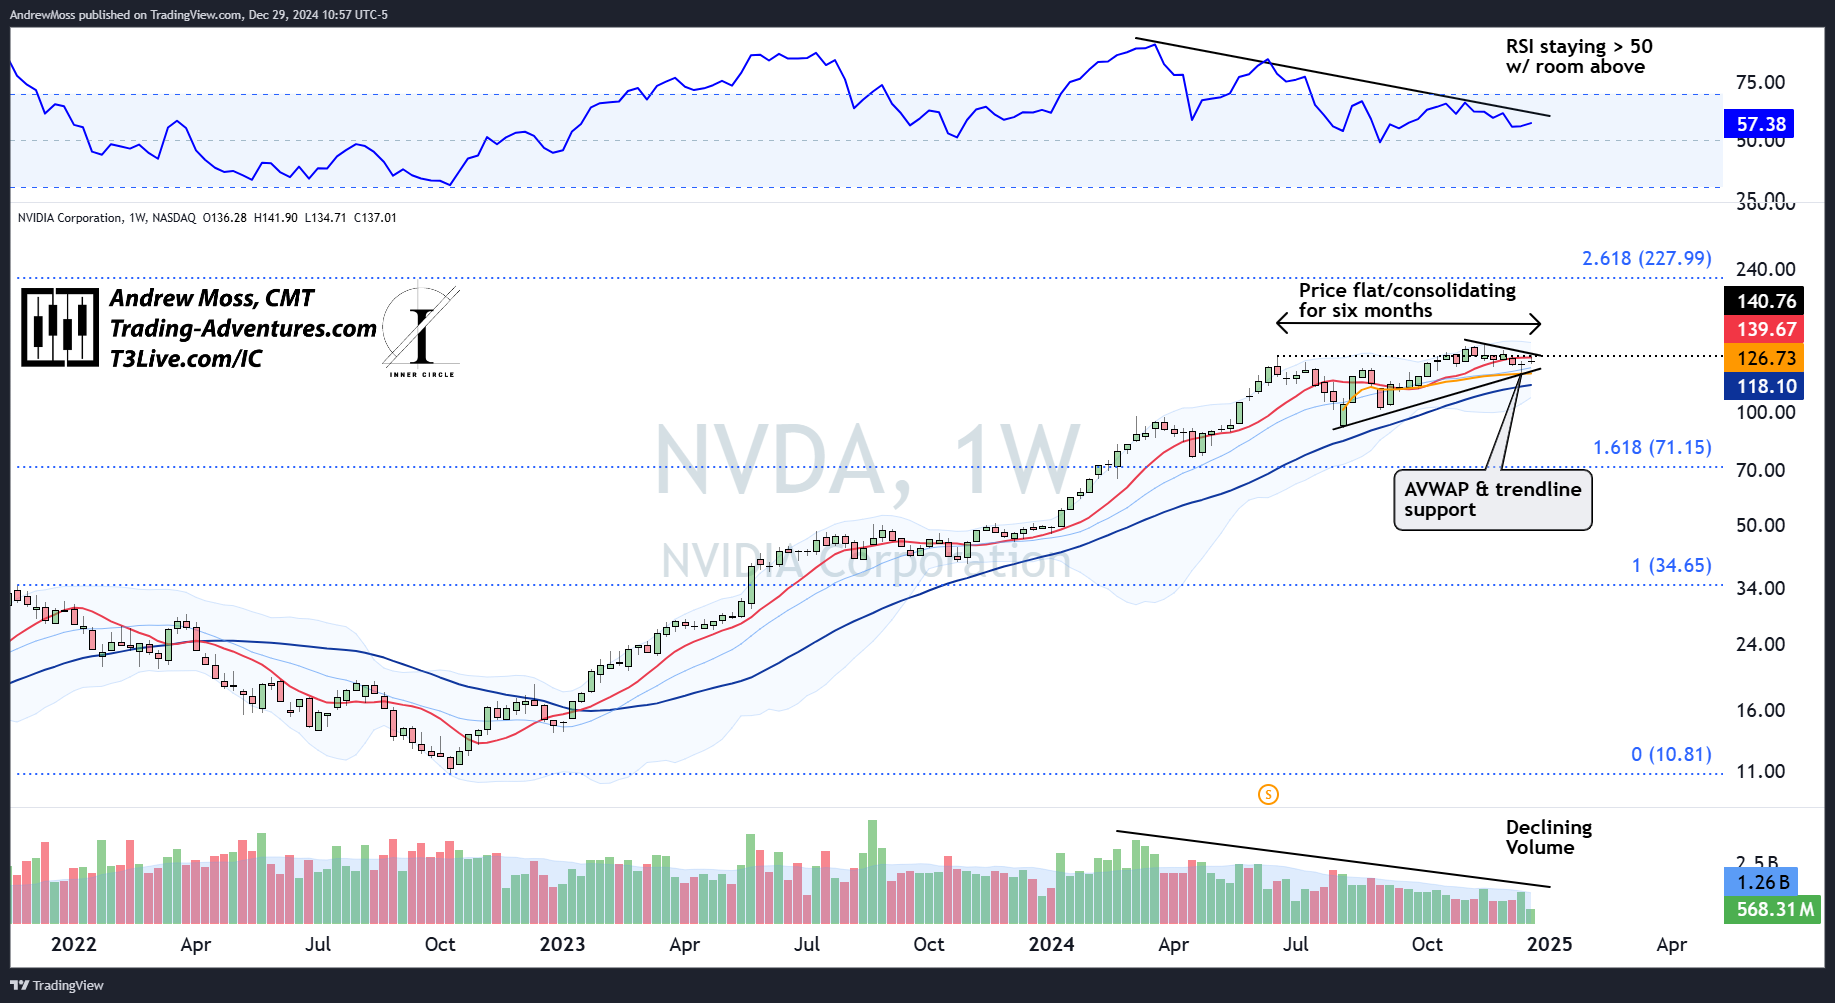
Zooming into the daily chart shows potential support is still present near $125-$130 - the August low anchored VWAP and the rising trendline. However, if the market gets spooked and $NVDA loses that support area, we could see the aforementioned -25% -30 % sell-off. That would take price back near $100 and the pivot low from September 2024.

Quantum Computing
The sector may not lead in 2025
Use cases are becoming more tangible
Many small-cap names have priced in 2027-2028 revenue projections
A major player (possibly Alphabet) producing significant revenue could stabilize the industry
Quantum computing is not new, but use cases are becoming more realistic. Many smaller companies have made astronomical stock moves while pricing in 2027-28 revenue, so it may be tough for the group lead in ‘25.
Alphabet’s Willow set off a firestorm and yet, the industry will need an established company (think Nvidia or Alphabet) producing real revenue to backstop this wild short-term performance. Don’t discount Quantum computing as an important technology, just the stocks short term.
The Technical View
This budding industry shows promise, but rest may be needed after some huge moves in names like $IONQ and $RGTI (+600% and +2400%, respectively, from the summer lows).
For a more established name, here is the chart for $GOOGL. The large rounding base of 2022-23 has given way to a breakout move that ran quickly and precisely to the 1.618 Fibonacci extension level. Now, after retesting the breakout level (also the pivot highs of late 2021) price is back to the extension.
If it gathers steam for another leg higher, the next extension level near $260 is a suitable target.

Bitcoin (BTC)
Likely to see continued adoption
Buy-on-dips strategy recommended
Factors supporting bullish outlook:
Less regulatory pressure
Increased institutional focus
Potential impact of a new U.S. president
Potential buy area: a test of the breakout near $73,000
Bitcoin will continue to be embraced by the masses and be a buy on all dips. Less legislation, more institutional focus, and a new president tell us so. The ideal buy area is a test of the breakout near $73k if we should be so lucky.
The Technical View
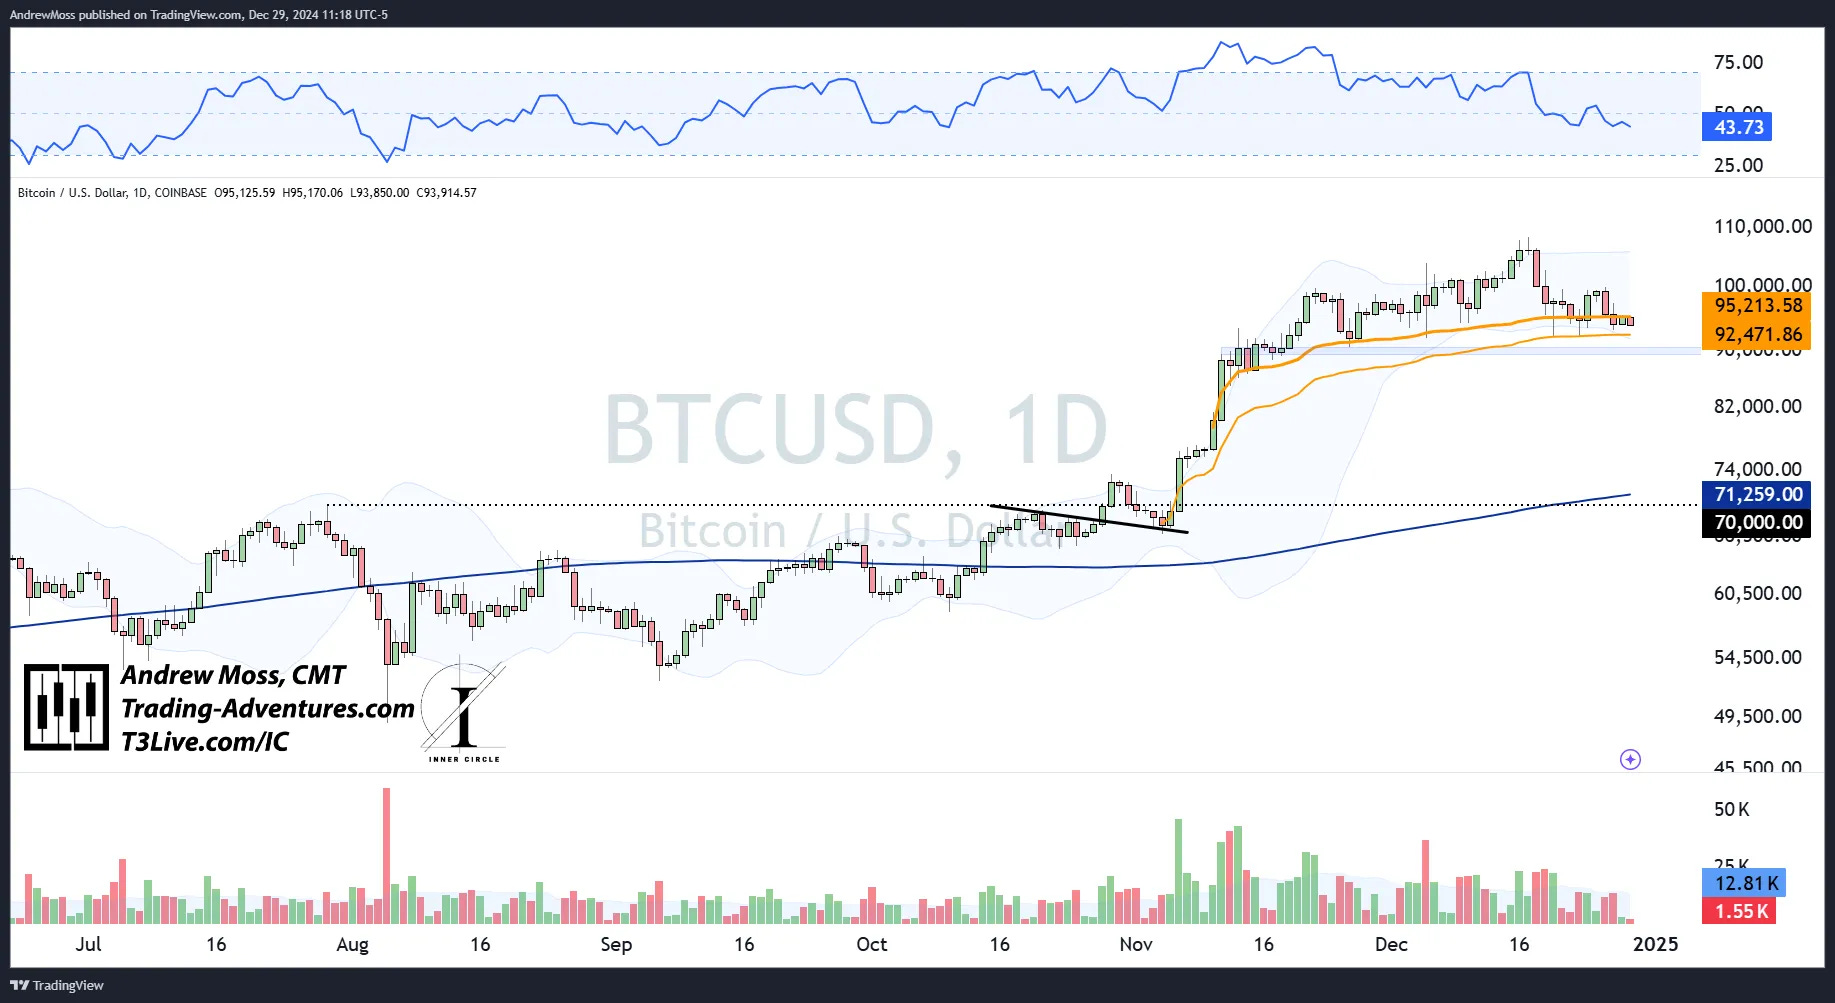
The recent Bitcoin breakout has very closely mirrored the breakout move from 2023. Similarities include:
an 8-month consolidation
10-week MA hit 40-week MA
an October breakout
an initial rally of ~45%+
After the initial rally in 2023, prices consolidated for seven weeks. Now, in 2024, we’re seeing signs that a consolidation period is here, following a very similar initial rally.
2023 did not see a retest of the breakout level. In the event of a broad market selloff, the current breakout area ($69k-$72k) would be a primary potential support level to watch, likely offering a very attractive dip-buying opportunity.

So far, a couple of VWAPs anchored near the breakout area have provided solid support. In the absence of a broad market selloff, we can look for these levels to continue supporting prices for the remainder of a supposed 6-7 week consolidation period.
Biotech Sector
Potential for a rally in 2025
Catalysts include:
Mergers and acquisitions
Pivotal trial successes
The JPMorgan Healthcare Conference in January could kickstart the rally
The Technical View
For months, $XBI tried to get above the ~$103.50 breakout level. The move ended with a failed breakout pattern that sent prices lower by nearly -10% in one week. Now, the sector is below the key moving averages, with RSI in the bearish lower half. There is a pivot low at $81.26 to watch for potential support. It would take a roughly 10% selloff to hit that area.

$TGTX is a company that’s been around for a long time and has recently been improving. After a series of ups and downs following the bottom in June 2022, this stock is once again back to a critical Fibonacci level. $36.01 represents a recovery of 61.8% of the decline from the December 2020 high to the June 2022 low.
A breakout move above that price would pave the way for a trip back to $56. Beyond there, ~$88 and ~$141 are extension targets to be seen in time.

Other Factors and Investment Strategy
Federal Reserve policy and bond market dynamics remain crucial
Inflation risks:
Potential impact of tariffs
New policies affecting the inflation picture
Focus on individual stocks rather than indices until a 20% market correction occurs
Remain vigilant for new opportunities in specific names
Ultimately, inflation could derail markets. Furthermore, tariffs and other new policies could muddy the inflation picture. Individual stocks offer better opportunities than the indices until we see an overall 20% market correction.
The Technical View
$SPX has been in full ‘bull market’ mode since the recovery from the dip below the 40-week MA in October of ‘23. The subsequent rebound took the RSI back into the bullish upper half, where it has stayed. There has also been minimal time spent below the 10-week MA, and for the last 19 weeks, the index has been cruising along in the upper half of the Bollinger Bands.
Understatement alert: The stock market has been strong.
Now, heading into 2025, we see a lackluster bounce from a sharp selloff on heavy volume. This has the Bollinger Bands tightening while the 10-week MA has been tested for two weeks.
A -20% selloff from current levels would take the index back to the pivot high from early 2022. For that to happen, we would need to see a series of lower lows (below ~5700) and lower highs (below ~6100), similar to the 2022 bear market.
Barring that occurrence, the next target above could be the 2.618 Fibonacci extension at 6965.
Weekly chart to show the extension level price target

Daily chart to show the pivot highs and lows

Conclusions
Fed policy and the bond market remain key to the market's health.
Ultimately, inflation can derail markets. We’re less macro-focused but know that tariffs and new policies can muddy the inflation picture.
So, until the market corrects, the best opportunities will likely be in individual stocks, not the indices.
Be more patient and picky with stock selection. Look for the best setups in the best names and sectors while monitoring the bigger picture. We’ll keep sharing names and ideas as we see them.
The Technical View
The long-term charts of the large-cap indexes are strong. Trends are higher, and prices are not extended. Rather, they are testing potential support levels.
Beneath the surface, breadth has waned, with the number of stocks above key moving averages decreasing and those making new lows increasing.
Small cap charts are a different story. The Russell 2000 continues to struggle with forward progress, has barely maintained the uptrend from the October ‘23 low, and is still well below the all-time highs.
The Dollar is pushing higher and may break into new territory, while treasury bonds can’t catch a bid. So, interest rates and the dollar are higher, and both factors can cause a headwind for stocks, especially the small caps.
These charts and more are in the most recent Weekly Chart thread.
The mixed bag of major index charts fits well with the call for more volatility into next year.
Thanks for reading this 2025 Market Outlook with David Prince.
Stay current throughout the coming year with any (or all) of these tools.
Follow David us on X/Twitter
Subscribe to this page - Trading-Adventures.com — Free and Premium options are available.
Subscribe to the EpicTrades Options Newsletter — Real-time insights and actionable trading ideas focusing on short-term options.
Join us in The Inner Circle Virtual Trading Floor — a community of elite traders led by David Prince, Rick March, and Kira Turner, working together to find and execute the best trading opportunities.
The Disclosures
***This is NOT financial advice. This is NOT a recommendation to buy, sell, or trade any security. The content presented here is intended for educational purposes only.
Looking For More?
Elevate Your Trading Adventure Even Further With These Offerings.

EpicTrades Options Newsletter
Real-time insights and actionable trading ideas focusing on short-term options.
The approach includes detailed reasoning for trades, specific options, and profit targets, focusing on quick gains with less time commitment required from subscribers.

The Inner Circle
The Inner Circle is a Virtual Trading Floor (VTF) at T3 Live. It’s the group I’ve been working and trading with since 2022. You may have noticed the logo in the watermarks on my charts.
Founded by David Prince and led by him, Rick March, and Kira Turner, the Inner Circle is a community of elite traders, including hedge fund managers, family office heads, corporate executives, financial advisors, and even professional poker players.
Fundamental, Macro, and Technical Analysis all combine to find and discuss the best opportunities in current markets.

Nice work fellas!
Great write up and insight! Thank you both for put this together.