

8 indicators for your charts - What they are and how to use them

Charts can be confusing and crowded. But they don't need to be.
In this article I will explain:
Which indicators I use
What to look for
How to avoid overdoing it
Charts made with Trendspider
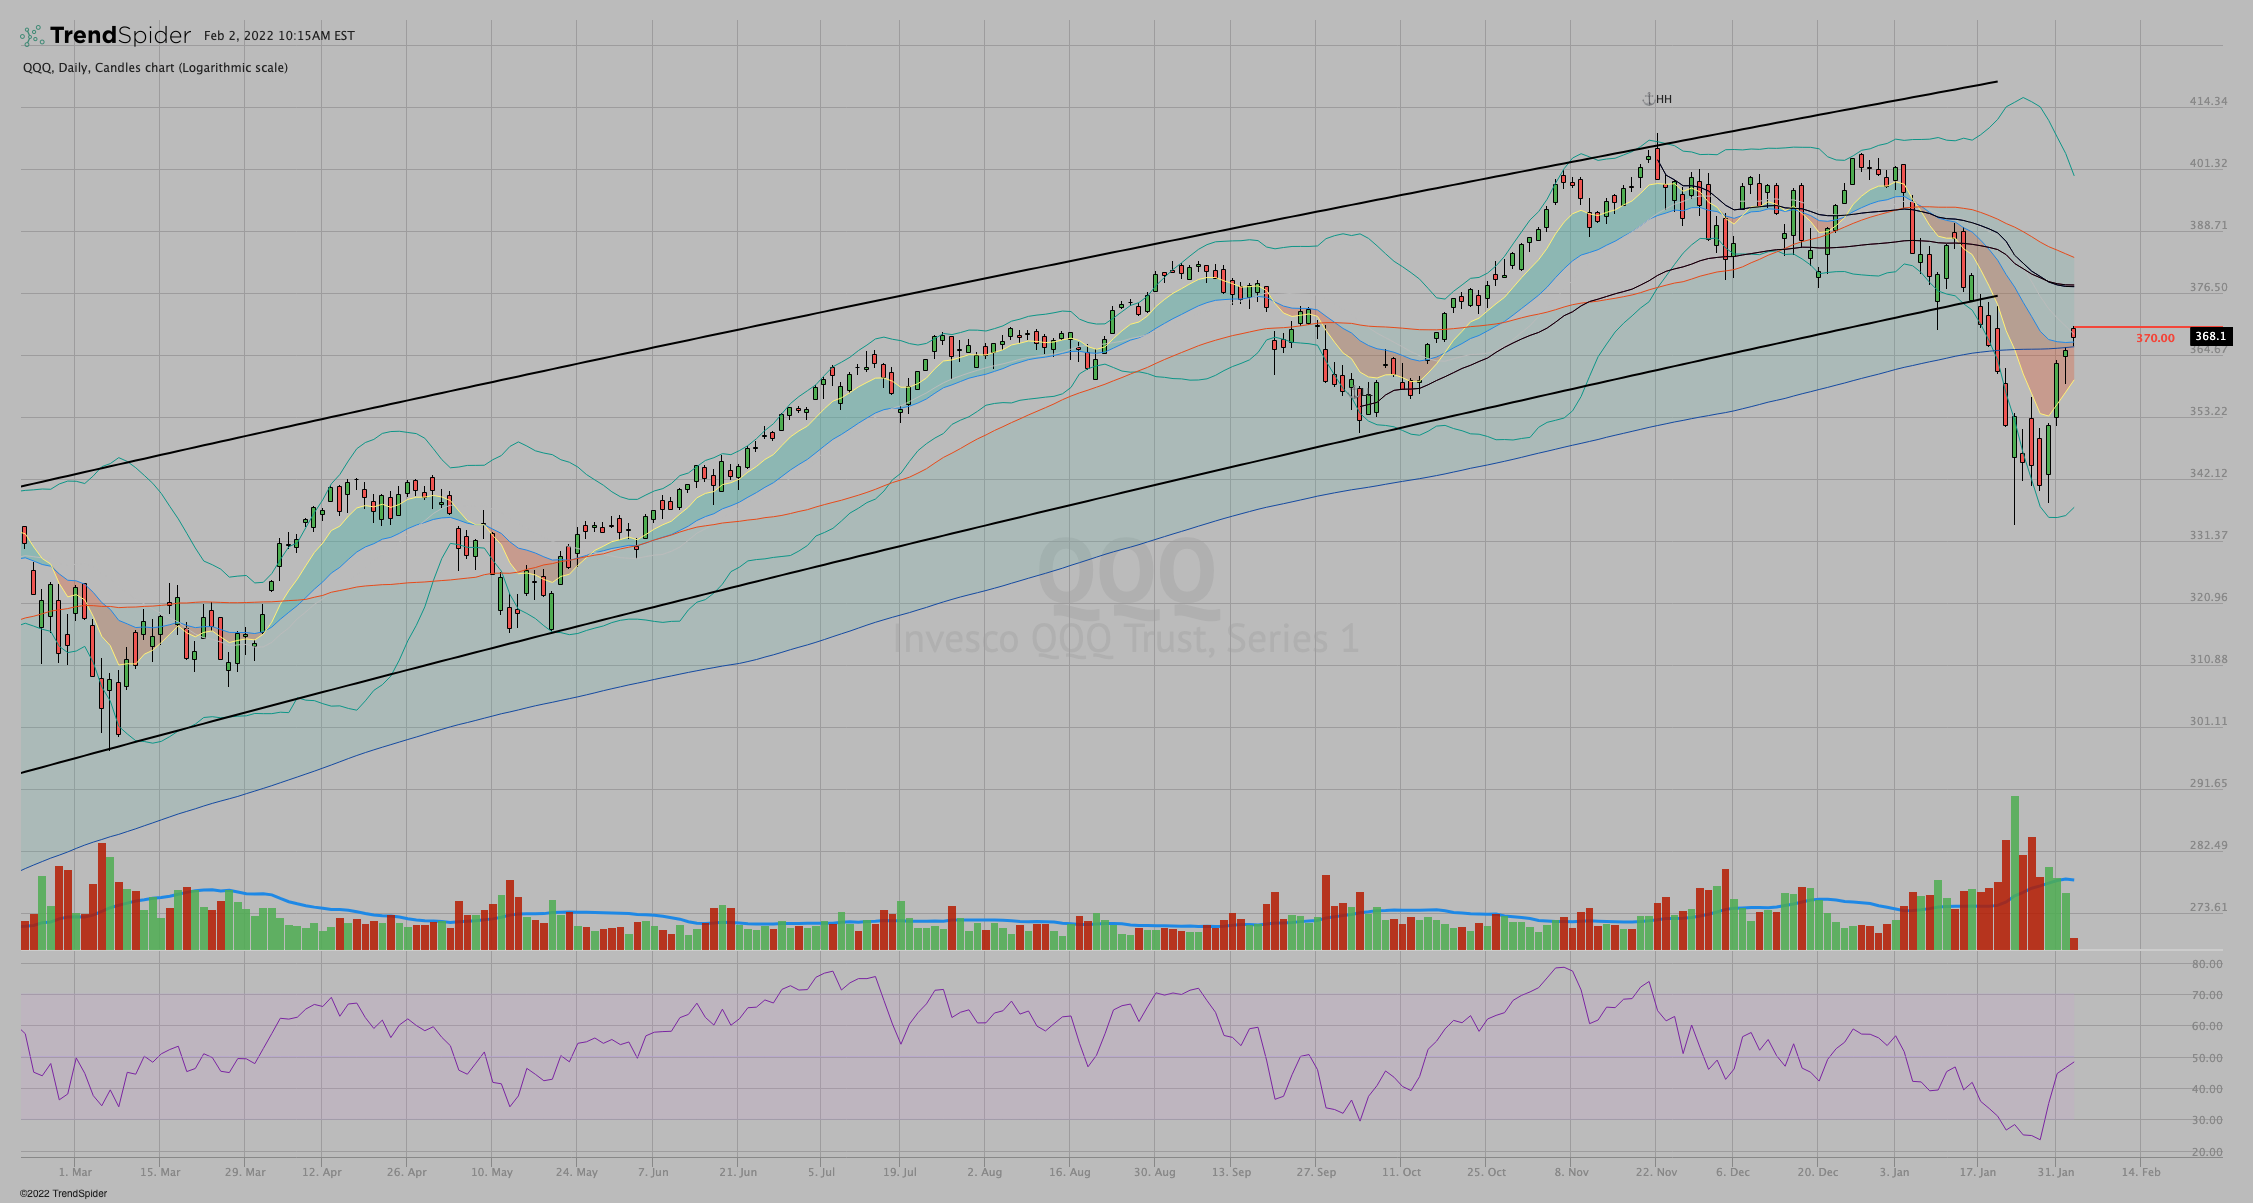
1. Candlesticks
- What is it?: - Method of chart drawing, gives a visual overview of price action in an instant, identify short and long term trends.
- What I'm paying attention to: is there more green or red? Is there a trend?
- My explanation here

2. 8/21 exponential moving averages
- What is it? "Price equilibrium" Derrick Oldensmith @ProDeskVTF
- What I'm paying attention to: the slope of the trends, the distance between them, and extension
- MA Cloud - Credit @Ripster
- Scott Redler @RedDogT3 ebook
The Ultimate Guide to Moving Averages by Scott Redler
3. Bollinger Bands
- What is it? Moving average (20 period) with a shaded area 2 standard distributions wide
- Created by John Bollinger @bbands.
- What I'm paying attention to: Are prices high or low on a relative basis?
-Click here to go in depth.
4. 50/200 simple moving averages
- What is it? Trend indicator
- What I'm paying attention to: Same as the 8 and 21 ema; the slope of the trends, the distance between them, and extension
- MA Cloud - Credit @Ripster
- Scott Redler @RedDogT3 ebook
The Ultimate Guide to Moving Averages by Scott Redler
5. Anchored volume weighted moving average - AVWAP
- What is it? Volume weighted average price anchored to a specific point in time.
- Can show if buyers or sellers are in control
- Created by Brian Shannon @Alphatrends. He explains here
6. RSI Relative Strength Index
- What is it? Oscillator that measures speed and change of price movements.
- What I'm paying attention to:
- Overbought(above 70) oversold(below 30)
- In bullish or bearish zone +/- 50
- Divergence from price
https://school.stockcharts.com/doku.phpid=technical_indicators:relative_strength_index_rsi
7. Volume w/ 20 day average
- What is it? number of shares traded
- What I'm paying attention to: What is the volume relative to the average? Is it higher or lower? Increasing or decreasing?
8. Occasional drawings
- trend lines, support or resistance lines, shaded areas, patterns
- I like to notate "points of interest" - a recent high or low. Some other pivot point.
Subjective. Not an exact science. Different people may see different patterns or POIs.
Think of charting as a mosaic. Individually these indicators are ok. Used in combination their usefulness compounds. More indicators don't necessarily mean more clarity or usefulness. Stick to the bare minimum first. Then add sparingly.
As you consider these pieces of data build think about building the layers of probability. Which way does the weight of the evidence point? Try to focus your trades toward the path of least resistance.
To summarize:
I use these 8 indicators on my charts:
Candlesticks
8/21 exponential moving averages
Bollinger Bands
50/200 simple moving averages
Anchored volume weighted moving average
Relative Strength Index
Volume
Drawings, lines, and other notations at Points if Interest
If you enjoyed this and like learning about charts and trading, or subscribe here

and follow me on Twitter here -> @Andy__Moss
I write regular articles and essays to educate and simplify technical analysis.
***This is NOT financial or trading advice of any sort. NOT a recommendation to buy, sell, or trade any security. The content presented here is intended for educational purposes only.