Anatomy of a Collapse
Weekend Market Review March 10, 2023
All eyes are on SVB Financial Group SIVB today, aka Silicon Valley Bank, as the stock went down -62.84% in pre-market trading. That’s after it declined -63% Thursday, selling off from Wednesday’s close of $267.83 to a daily low of $100 even.
Trading in this stock is currently halted at $39.40 as regulators and deal-makers try to assess what may be next.
$267.83 to $39.40. -$228.43, roughly -86% in two days. Looks like we found the kaboom.
Attempts to explain the reasons for this move will be left in the hands of those who are much more knowledgeable about these types of things. There will certainly be a glut of news stories and attempts to explain coming in the next 48 hours, and beyond.
click to enlarge
The purpose of including the chart here is to exhibit the potential warning signs that showed up in advance.
Technical analysis is, first and foremost, a tool for risk management.
The capabilities are on display in this weekly chart.
SIVB stock was already looking suspect. Consider the sequence of events.
SIVB breaks below the 10 and 40-week MAs (50 and 200-day if you prefer), and a support/resistance level.
Two weeks in a row it rallies and subsequently fails to stay above the 10/40-week MAs.
The 10-week crosses below the 40-week.
RSI dips into the bearish zone in January 2022.
A recent rally attempt failed precisely at the declining 40-week MA.
To be clear, these events individually, or as a sequence could never predict the collapse of the bank (technical analysis is not about prediction.) But they do raise red flags, signaling that it’s prudent to reduce existing exposure or avoid adding new exposure.
As they say, “Bad things happen beneath the 200-day moving average.”
This is why we look at charts.
This is why we pay attention to previous support and resistance levels.
This is why risk management is always a trader’s Job #1.
As traders, investors, and regulators hustle to examine the causes and potential collateral damage from this event, it’s important to stay focused on your risk management.
We can remain open to opportunity. Sharp selloffs always bring some, eventually.
But patience will be key.
The Charts
Support levels are broken.
All major indexes are beneath their 200-day moving averages. QQQ is still stronger. But lower is the path of least resistance for these indexes.
Most stocks are now “guilty until proven innocent.”
Caution and capital preservation are important here.
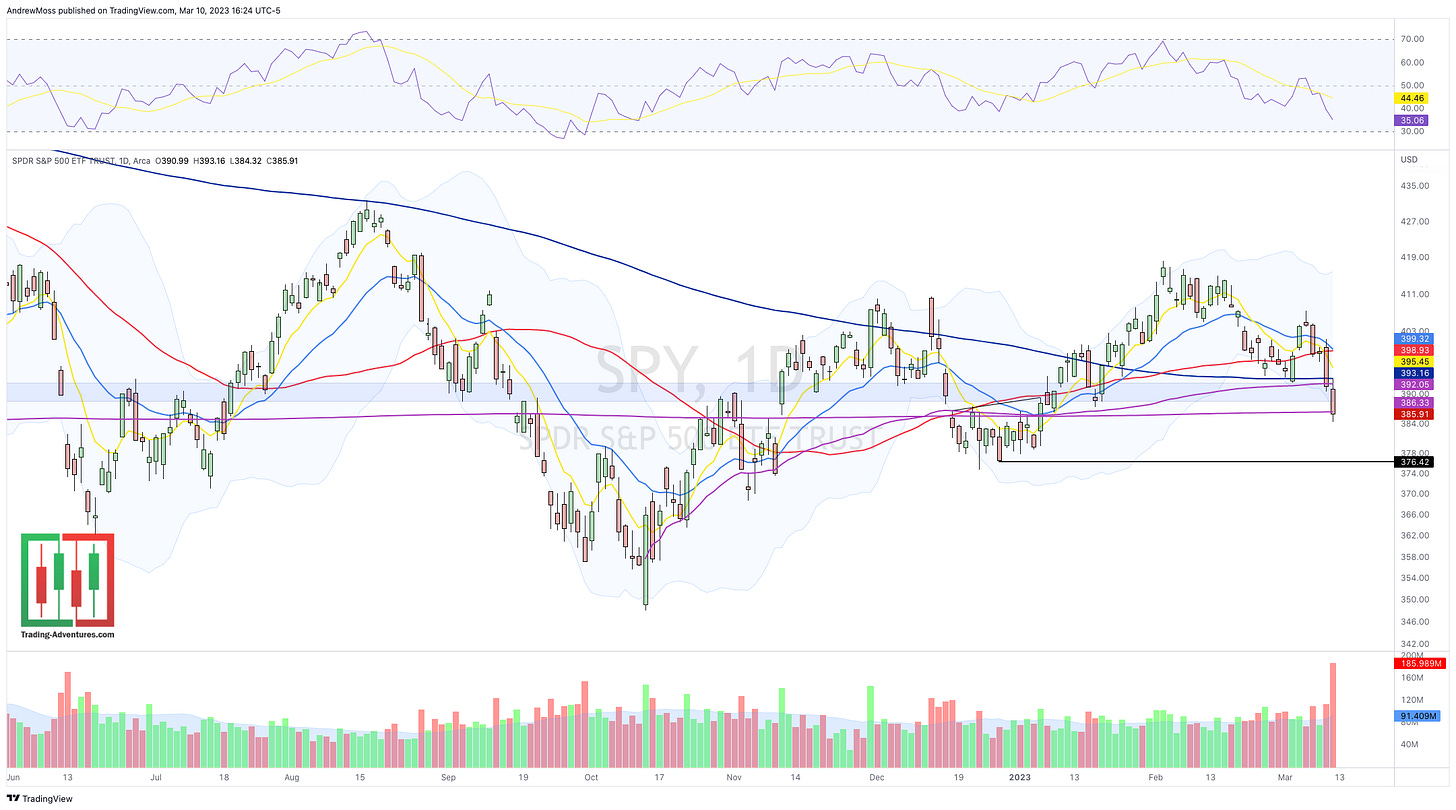
SPY cut through all of the close-by resistance levels before finally settling near the covid low anchored VWAP. The next potential support is the pivot near 376. The extension so far beneath the 8/21 EMAs, and the fact that this was day 5 down, could give way to a bounce Monday morning.
QQQ is holding up stronger and closed very near last Thursday’s pivot low. It is, however below all of its key moving averages. Guilty until proven innocent.
Potential support shows lower at the Oct. ‘22 low anchored VWAP.
IWM shows two nasty red days and a close with nothing close by to support.
DIA is in worse shape now and trading below all of the key moving averages. The next purple line lower is the covid low anchored VWAP.
DXY - The Dollar and stocks went down together. That’s new.
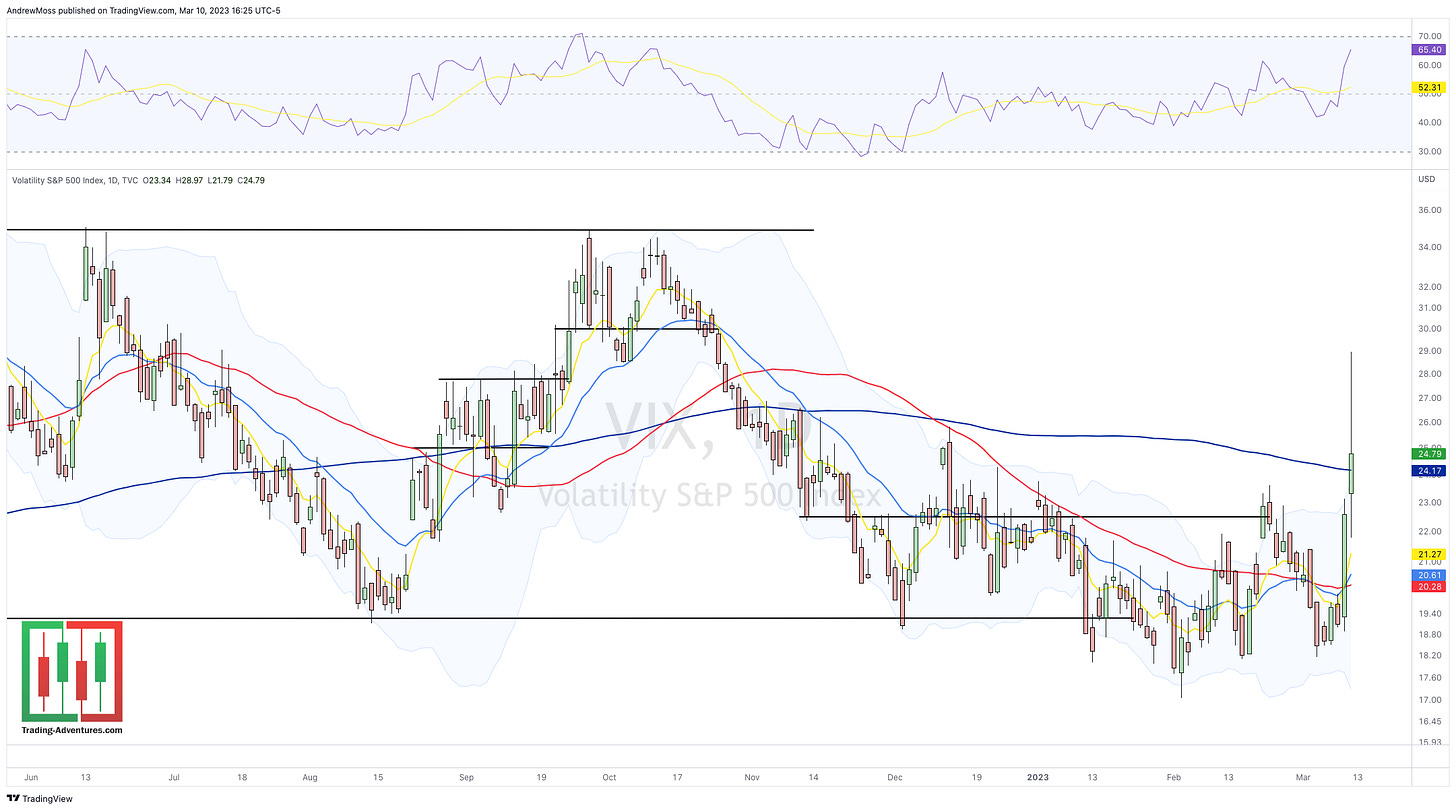
VIX was sleepy until it wasn’t. And that’s often how implied volatility works. Periods of contraction tend to lead to periods of expansion. And vice versa.
Next week we have CPI on Tuesday and PPI Wednesday.
But before that, keep your eyes and ears out for banking news related to SIVB and potentially others.
The Federal Reserve has called an emergency meeting for Monday, March 13th as well, presumably related to SIVB. So there will be plenty of market-moving events next week.
More to come in the Weekend Weekly Charts Saturday morning. You can find that here @Andy__Moss
Take care and have a great weekend!
***This is NOT financial advice. NOT a recommendation to buy, sell, or trade any security. The content presented here is intended for educational purposes only.
Andrew Moss is an associated member of T3 Trading Group, LLC (“T3TG”) a SEC registered broker/dealer and member of FINRA/SIPC. All trades placed by Mr. Moss are done through T3TG.
Statements in this article represent the opinions of that person only and do not necessarily reflect the opinions of T3TG or any other person associated with T3TG.
It is possible that Mr. Moss may hold an investment position (or may be contemplating holding an investment position) that is inconsistent with the information provided or the opinion being expressed. This may reflect the financial or other circumstances of the individual or it may reflect some other consideration. Readers of this article should take this into account when evaluating the information provided or the opinions being expressed.
All investments are subject to risk of loss, which you should consider in making any investment decisions. Readers of this article should consult with their financial advisors, attorneys, accountants or other qualified investors prior to making any investment decision.
POSITION DISCLOSURE
March 10, 2023 4:00 PM
Long: SBNY0317P70
Short:
Options symbols are denoted as follows:
Ticker, Date, Call/Put, Strike Price
Example: VXX1218C30 = VXX 12/18 Call with a $30 strike


