

August 20 Weekend market review/preview
Breaking waves

Good morning! And welcome to the August 20, 2022 weekend market review and preview. I hope you’ve all had a great week in and out of the markets. If you’ve been enjoying my charts and observations spread the word by forwarding this to a friend.
Now let’s get into the charts.
For the first time since it turned up in mid-June, the SPY 8-day moving average is curling over like a breaking wave. The move up from the lows has been powerful, to put it mildly. But is there enough momentum to keep it going?
Let’s take a look.
SPY 0.00%↑The S&P 500 has been very strong but this week couldn’t get over the 200-day MA. It’s now resting on the volume-weighted price anchored to the all-time highs (ATH AVWAP). The bull case is to hold and bounce from $420 as that's been such a heavily watched level. Below that watch for a move to test the 21-day EMA, and if that doesn't hold $410 may help.
Click charts to enlarge
QQQ 0.00%↑ NASDAQ 100 was also turned back at the ATH AVWAP. Watch $320 as the next potential support level.
IWM 0.00%↑ Russell 200 is curling back down at the confluence of the 200-day MA and the ATH AVWAP.
$DXY US Dollar is back over the line I've been watching and not helping stock prices.
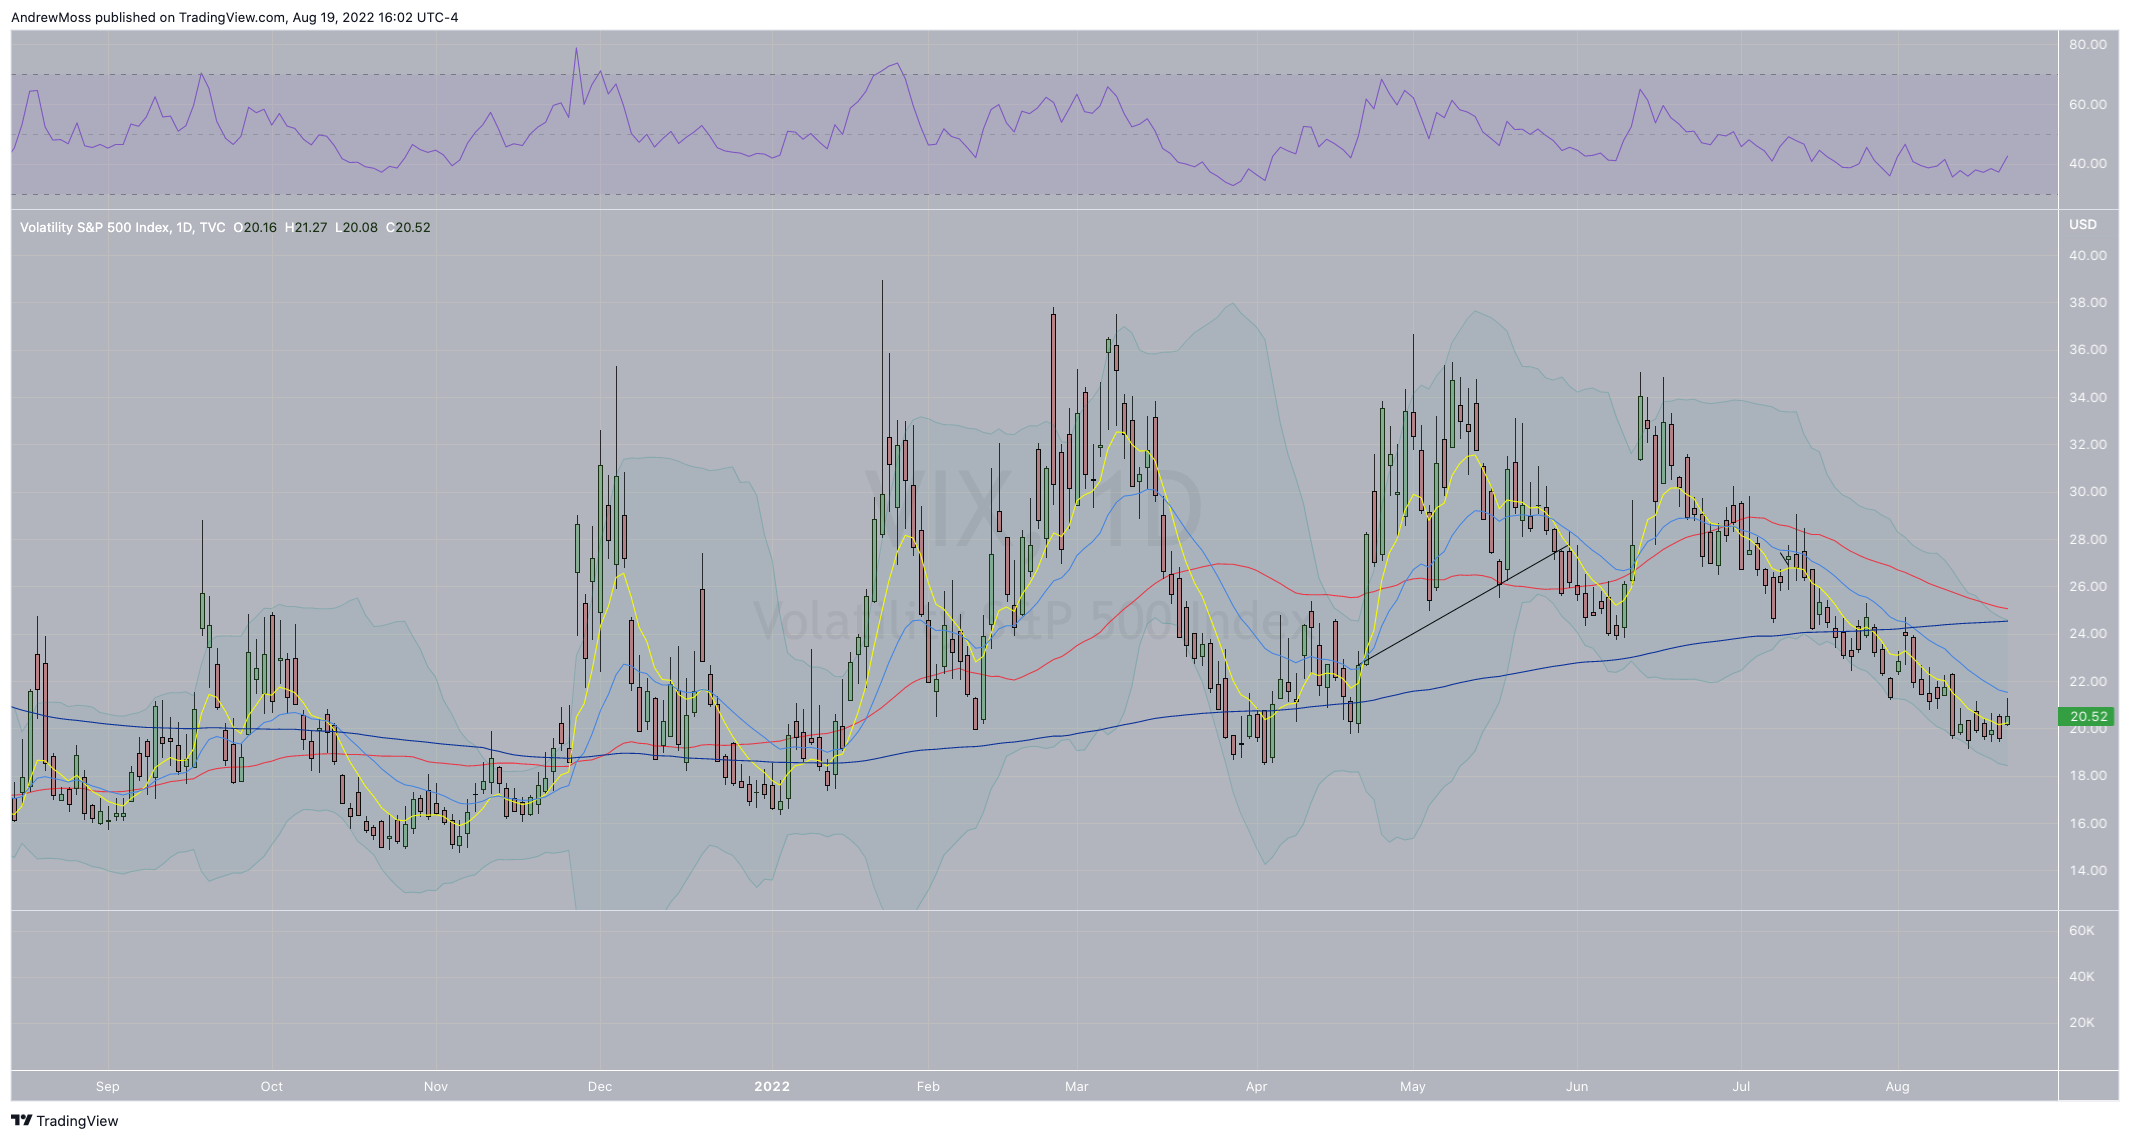
$VIX Implied volatility is up marginally but still trending lower for now.
Here’s Jeffrey Hirsch of the Stock Trader’s Almanac with the historical view.

Apple has had an incredible 15 days above the 8-day EMA. I don't have complete stats on how often a move of that strength happens, but a quick glance at the chart shows that it’s not very common. Today it finally broke the streak. Impressive.
Some of the high beta/more risky areas of the market are potentially showing a "risk off" mood.
TSLA 0.00%↑ Tesla broke down from the ascending triangle pattern and has the 200-day MA just overhead.
$BTCUSD Bitcoin has broken down from the rising channel.
XBI 0.00%↑ Biotech stocks couldn't break up from the potential continuation pattern. Instead, it is back below the 8/21-day EMAs.
ARKK 0.00%↑ Also broke down from a rising channel.
In the meantime, some defensive sectors are telling a different story
XLU 0.00%↑ Utilities made all-time highs this week.
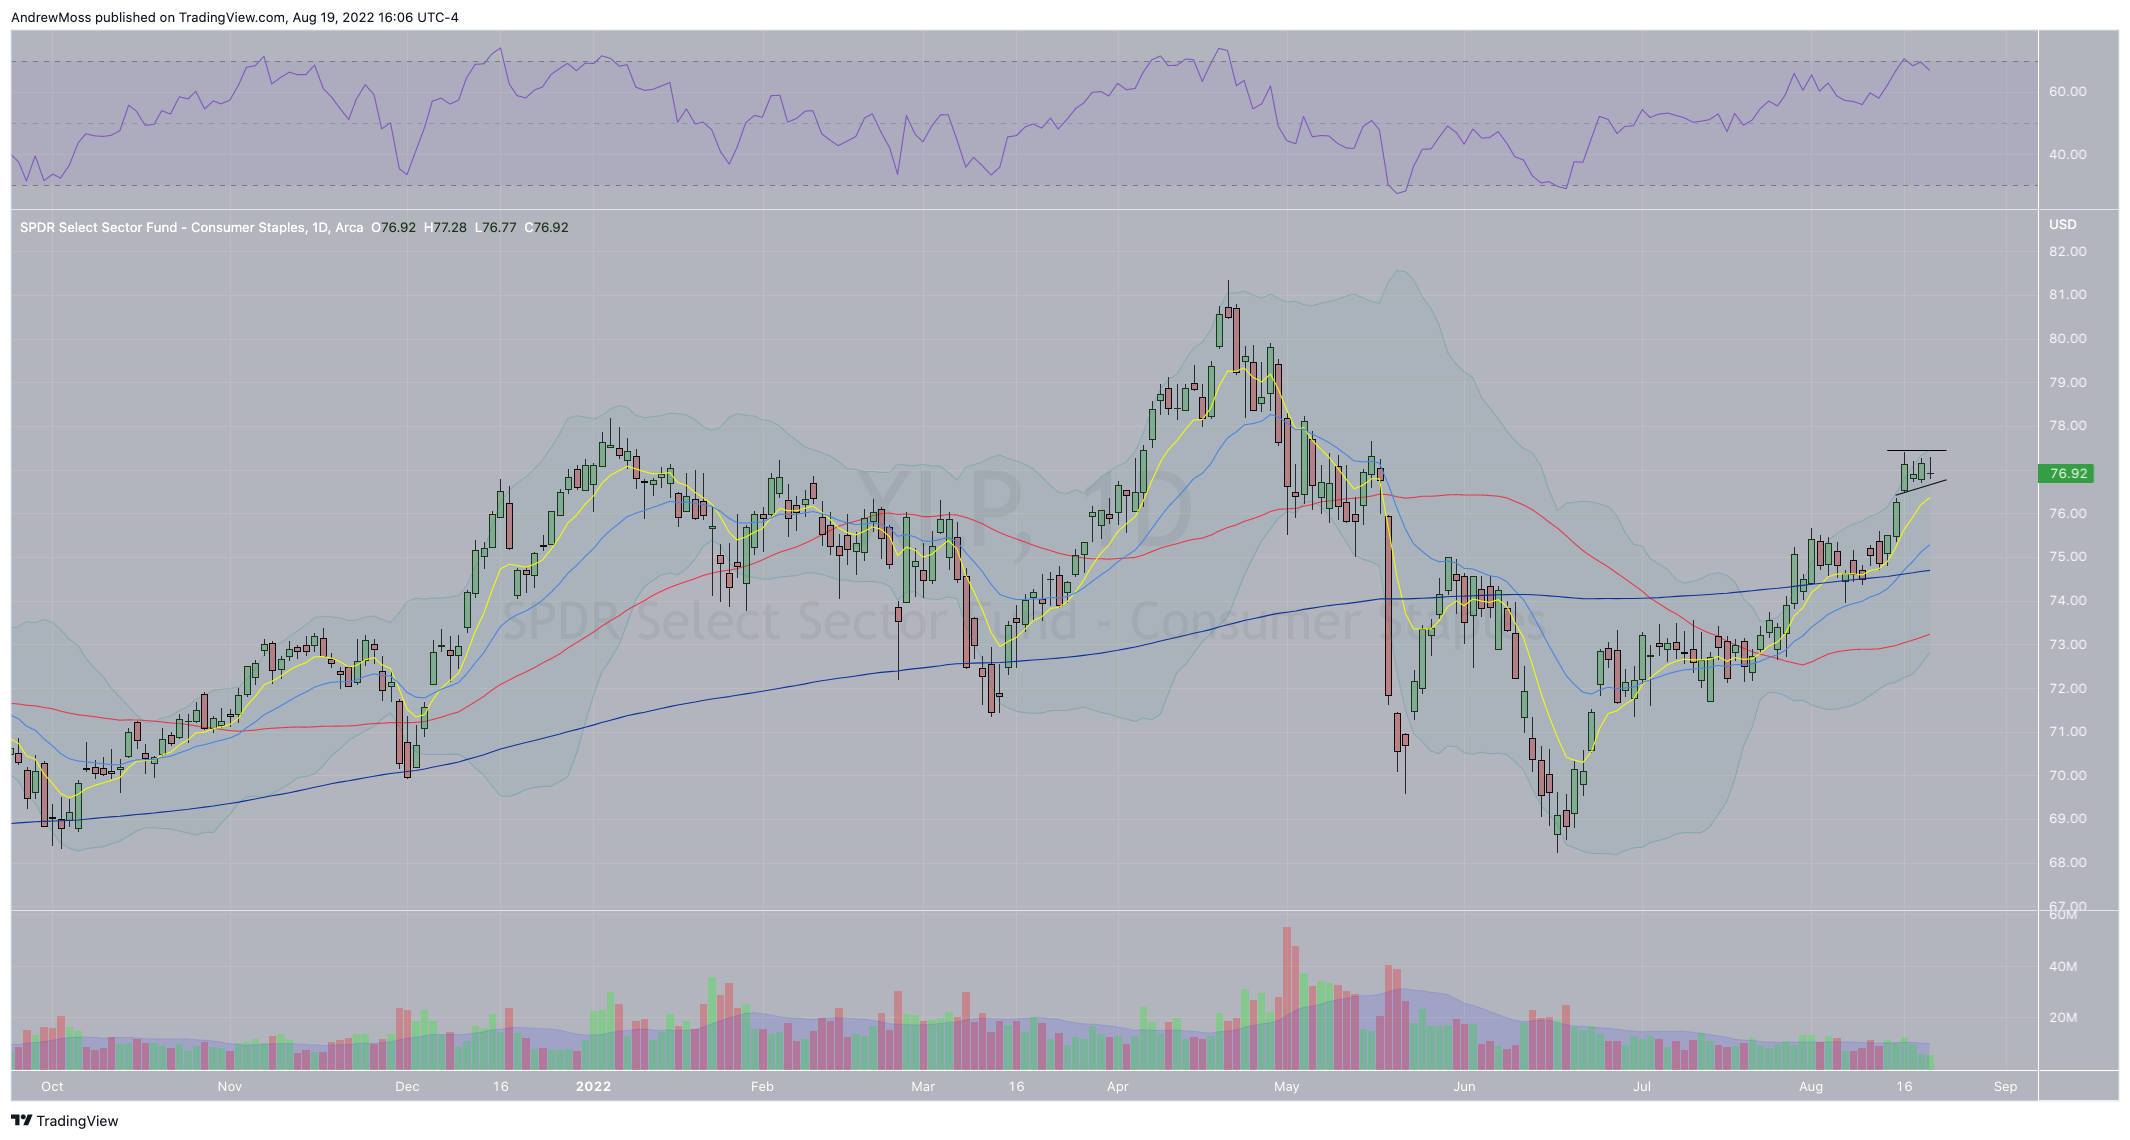
XLP 0.00%↑ Consumer Staples have formed a high and tight bull flag and looks like it wants to go higher.
Is this a change in risk appetite?
Or just a minor pullback after a powerful rally and at a widely anticipated resistance area?
Let's look at some market history and seasonal tendencies for additional context.
On seasonality:
Jeffrey Hirsch again:

And some wise words from Mike Shell reminding us that it's imperative to plan for up, down, and sideways.
On the bullish side of things, strength begets strength.
Ryan Detrick has some encouraging statistics.


Now some of my highlights from Twitter:
Regarding patience:
Plan your trades. Set alerts. Then execute.
No alert? No trade.
On the charts:
You will often see the Relative Strength Index (RSI) on my charts.
Here's what it means.
And finally, a downtrend we can all celebrate! 🐔🍗
The markets feel strong. But there’s no shortage of risk factors and potential resistance levels overhead. As always, know your levels, your timeframe, and your objectives, and keep an eye on the charts.
Only price pays.
And speaking of charts. By the time you’ve read this, I will likely have a slew of weekly charts posted to Twitter. Be sure to check them out for a bigger picture view.
And let me know what you see by replying there or by sending me an email. I’d love to hear what you think.
***This is NOT financial advice. NOT a recommendation to buy, sell, or trade any security. The content presented here is intended for educational purposes only.
Andrew Moss is an associated member of T3 Trading Group, LLC (“T3TG”) a SEC registered broker/dealer and member of FINRA/SIPC. All trades placed by Mr. Moss are done through T3TG.
Statements in this article represent the opinions of that person only and do not necessarily reflect the opinions of T3TG or any other person associated with T3TG.
It is possible that Mr. Moss may hold an investment position (or may be contemplating holding an investment position) that is inconsistent with the information provided or the opinion being expressed. This may reflect the financial or other circumstances of the individual or it may reflect some other consideration. Readers of this article should take this into account when evaluating the information provided or the opinions being expressed.
All investments are subject to risk of loss, which you should consider in making any investment decisions. Readers of this article should consult with their financial advisors, attorneys, accountants or other qualified investors prior to making any investment decision.