After a strong start to the week, apprehension was building Tuesday afternoon in anticipation of the MSFT earnings report. Everyone seemed to agree that this report would be a bellwether for quarterly earnings; a predictor or leading indicator of other corporate earnings.
The thinking was this; If MSFT is doing ok, then other companies may be ok too. But if even MSFT is in bad shape, other, presumably lower-quality companies don’t have a chance.
Maybe that’s true. Or maybe it’s not. Factuality doesn’t really matter as that is what everyone believed. And what everyone believes is what drives prices, at least until that belief is proven wrong or replaced by a new belief.
With the report behind us, new beliefs are being shaped and discovered. This is evident in the price fluctuations. When MSFT reported earnings the belief of prosperity was reinforced and its share price rose in the amount expected by options pricing1; roughly $11.
Later in the evening, the company added more context (on the earnings conference call), and those beliefs were changed or replaced, sending the prices lower by the expected amount, roughly $11.
At this time the price is pretty much where it was before all the hullabaloo.
Welcome to earnings season.
The Charts
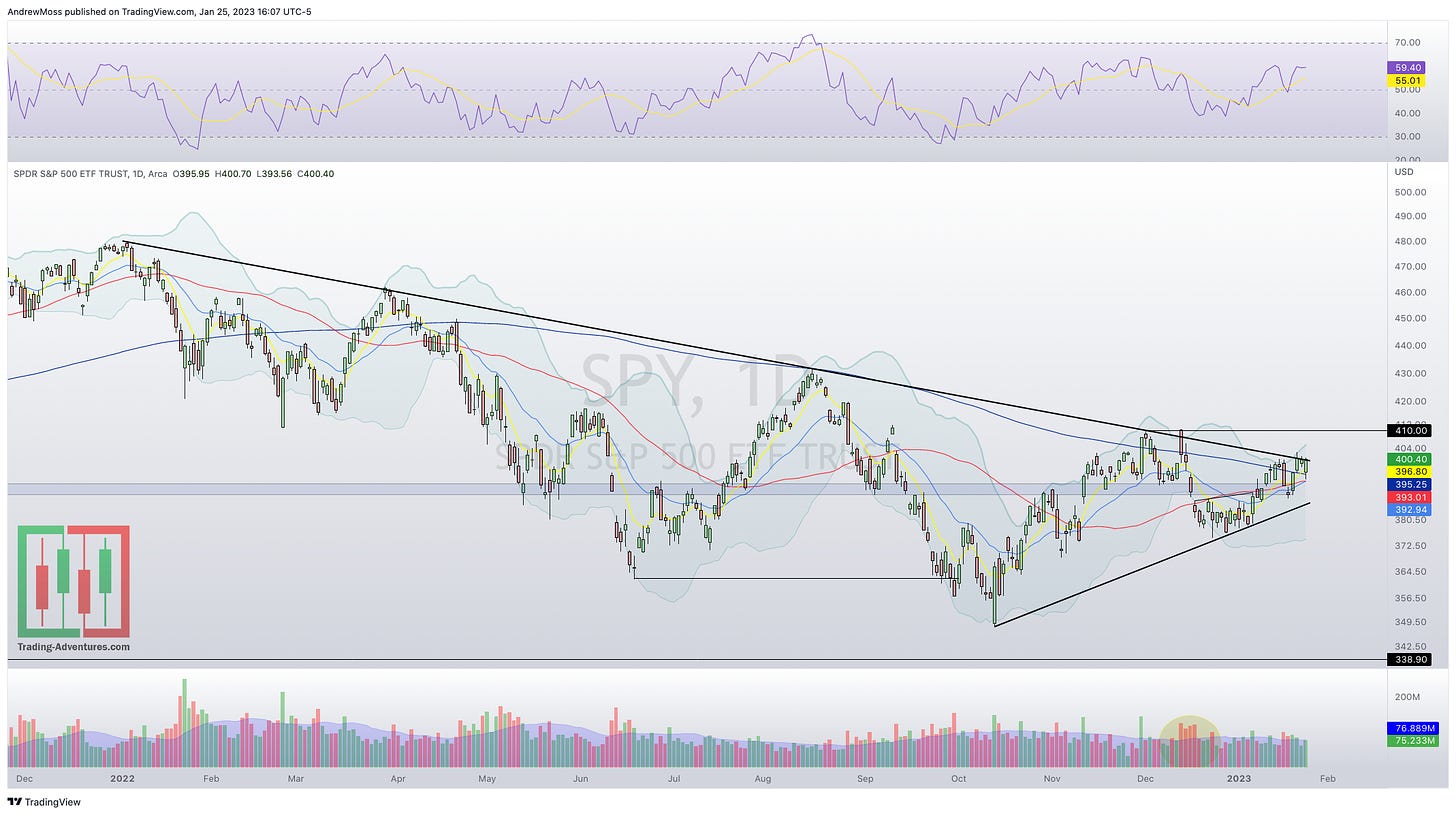
SPY - SP 500 stocks are above the key moving averages and looking to get back over “The Line.”
QQQ - Nasdaq 100 stocks are gathering strength, getting back over “The Line” and moving towards the 200-day MA.
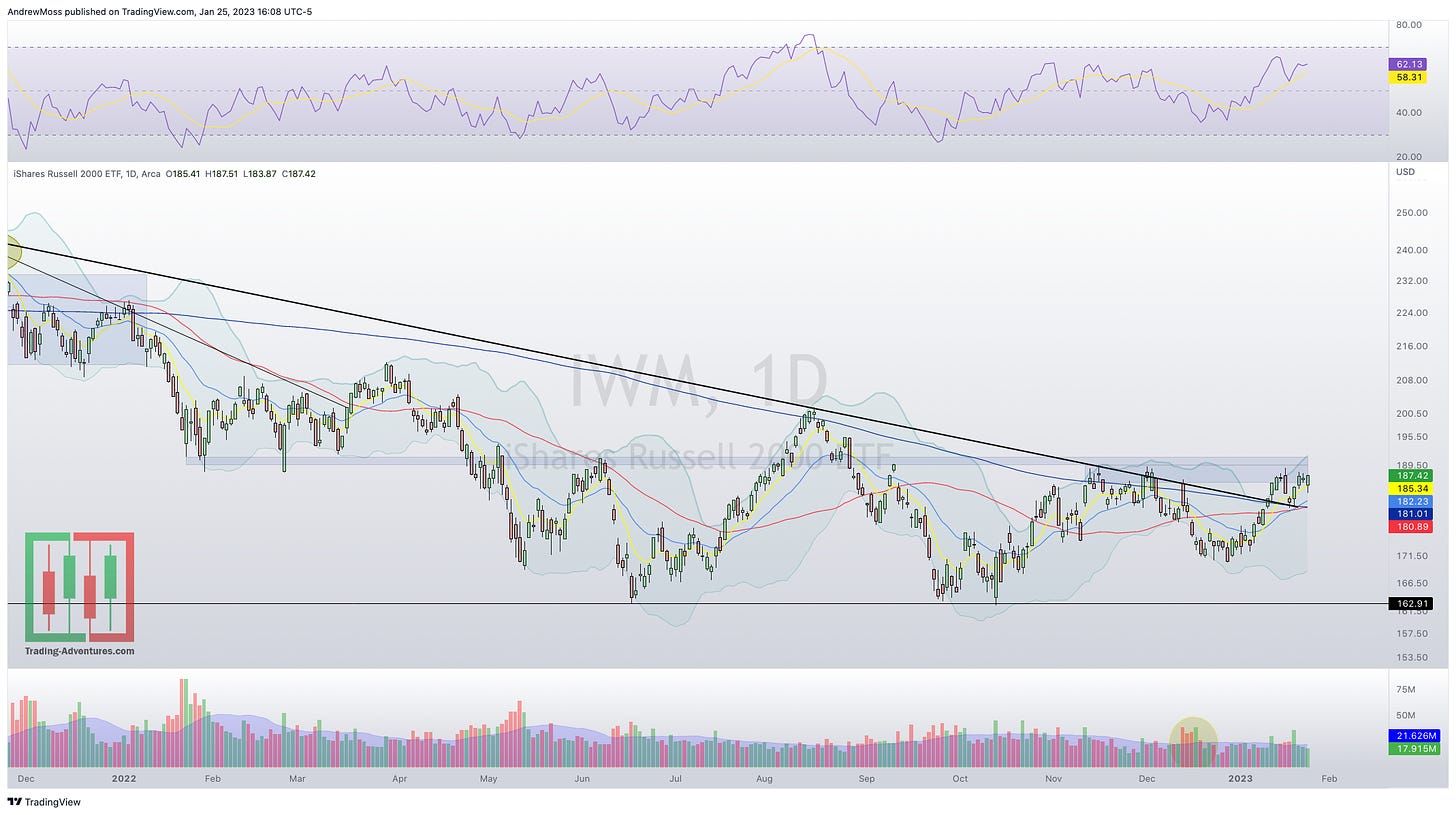
IWM - Russel 2000 small-cap stocks are constructive while trying to move through the 186-191 congestion zone.
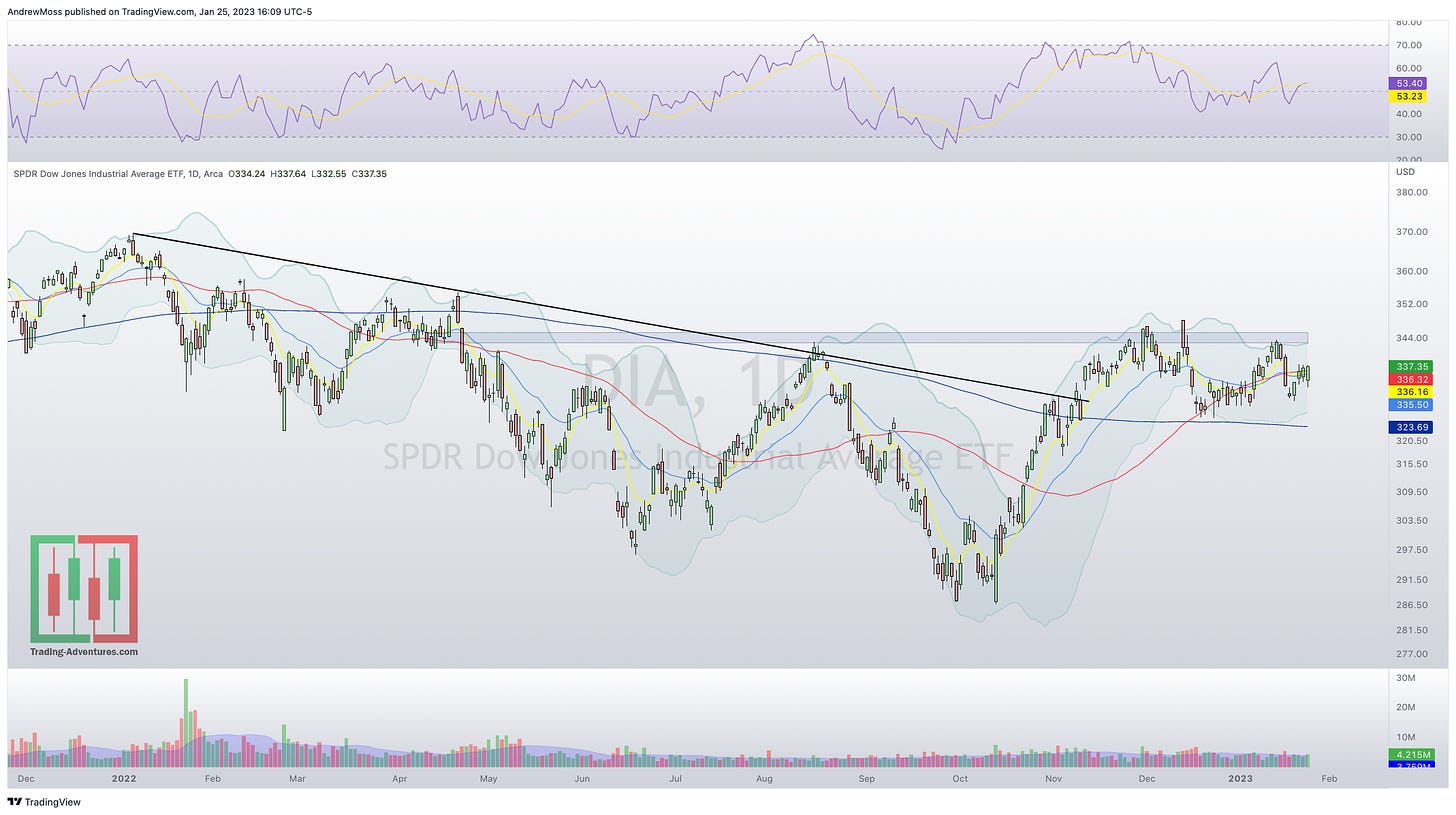
DIA - Dow 30 stocks have relinquished their leadership role for the short term. They are holding up ok so far though, sticking close to the 8/21/50-day MAs.
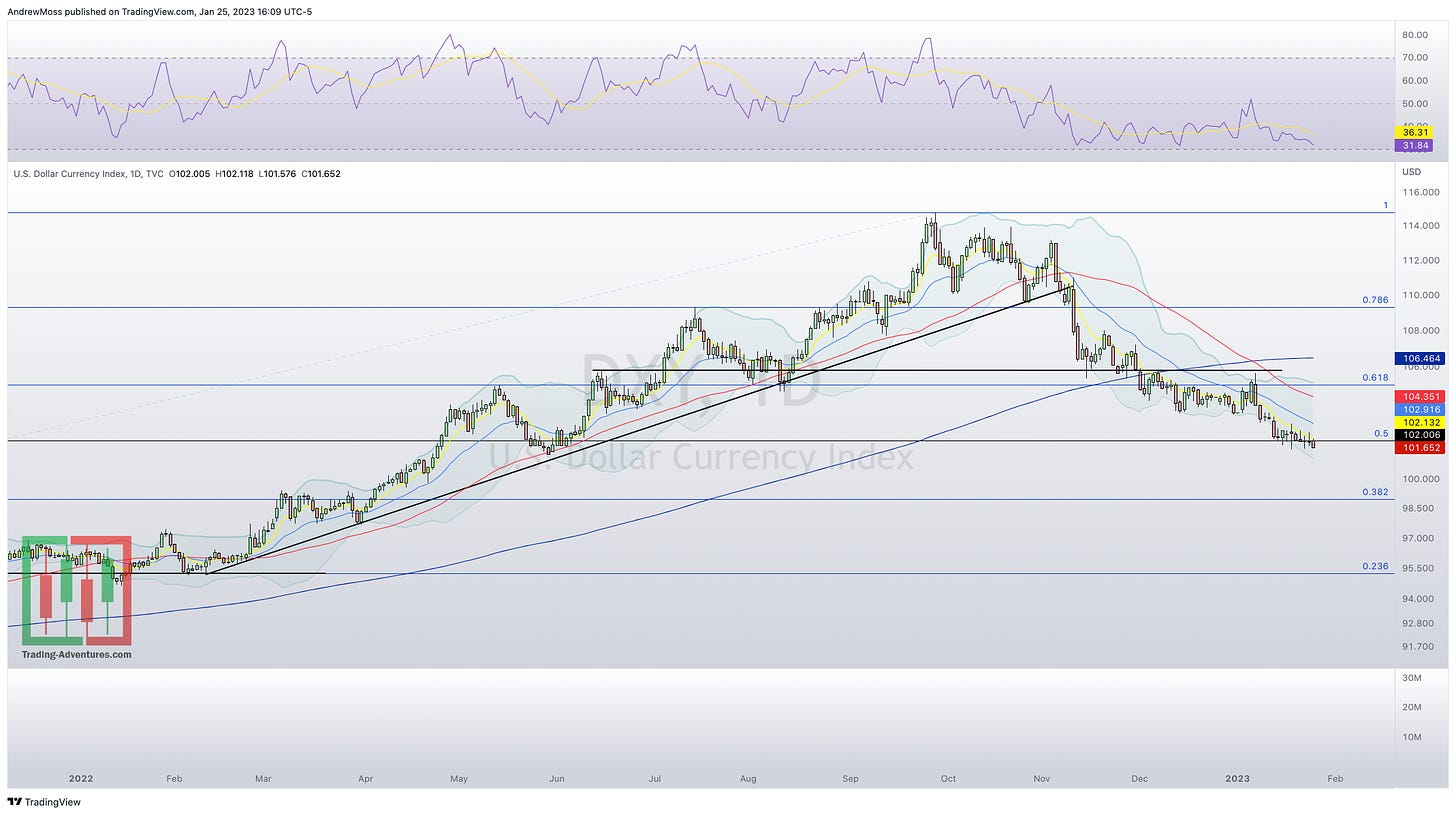
DXY - The US Dollar continues its slow grind lower. If it continues to leave 102 behind, 99 could be achievable. Continuation lower would reinforce the tailwind for stocks.
VIX - Volatility jumps in fits and starts, but so far even earnings uncertainty hasn’t changed the overall trend lower.
There are several more notable reports after the close today including IBM, NOW, TSLA, LVS, and STX. These may or may not carry as much weight as MSFT did. But each will be impactful in its own way.
That an “earnings recession” is coming has been a widely held belief in recent weeks and months. Downside surprises and lowered guidance will have an effect. Doing “OK” or “good enough” could have an outsized positive effect given the poor expectations. Upside surprises could be handsomely rewarded.
We shall see.
***This is NOT financial advice. NOT a recommendation to buy, sell, or trade any security. The content presented here is intended for educational purposes only.
Andrew Moss is an associated member of T3 Trading Group, LLC (“T3TG”) an SEC registered broker/dealer and member of FINRA/SIPC. All trades placed by Mr. Moss are done through T3TG.
Statements in this article represent the opinions of that person only and do not necessarily reflect the opinions of T3TG or any other person associated with T3TG.
It is possible that Mr. Moss may hold an investment position (or may be contemplating holding an investment position) that is inconsistent with the information provided or the opinion being expressed. This may reflect the financial or other circumstances of the individual or it may reflect some other consideration. Readers of this article should take this into account when evaluating the information provided or the opinions being expressed.
All investments are subject to risk of loss, which you should consider in making any investment decisions. Readers of this article should consult with their financial advisors, attorneys, accountants or other qualified investors prior to making any investment decision.
POSITION DISCLOSURE
January 25, 202,3 4:00 PM
Long: ADBE, LABU, MRNA, NVDA0203P180, PINS0203C27.50, PINS0217C27.50, TSLA0127P130, XLE0317C100
Short:
Options symbols are denoted as follows:
Ticker, Date, Call/Put, Strike Price
Example: VXX1218C30 = VXX 12/18 Call with a $30 strike
The implied move of a stock for a binary event can be found by calculating 85% of the value of the nearest monthly expiration (front month) at-the-money (ATM) straddle. This is done by adding the price of the front month ATM call and the price of the front month ATM put, then multiplying this value by 85%. - Options Implied Move


I think 24% of the market cap of the s + p reports this week. I gotta get on a desktop sir and dig into charts and macro. Appreciate you doing these. I’m just a retail investor but learning as best as i can so anything like this is helpful. Have a good one. Make u some money. 🤪