

BREAKOUT
Market Update March 21, 2024
The Markets
Yesterday, all eyes were on Jerome Powell to hear his tone and The Dot Plot to gather hints about how many rate cuts could be in store for 2024.
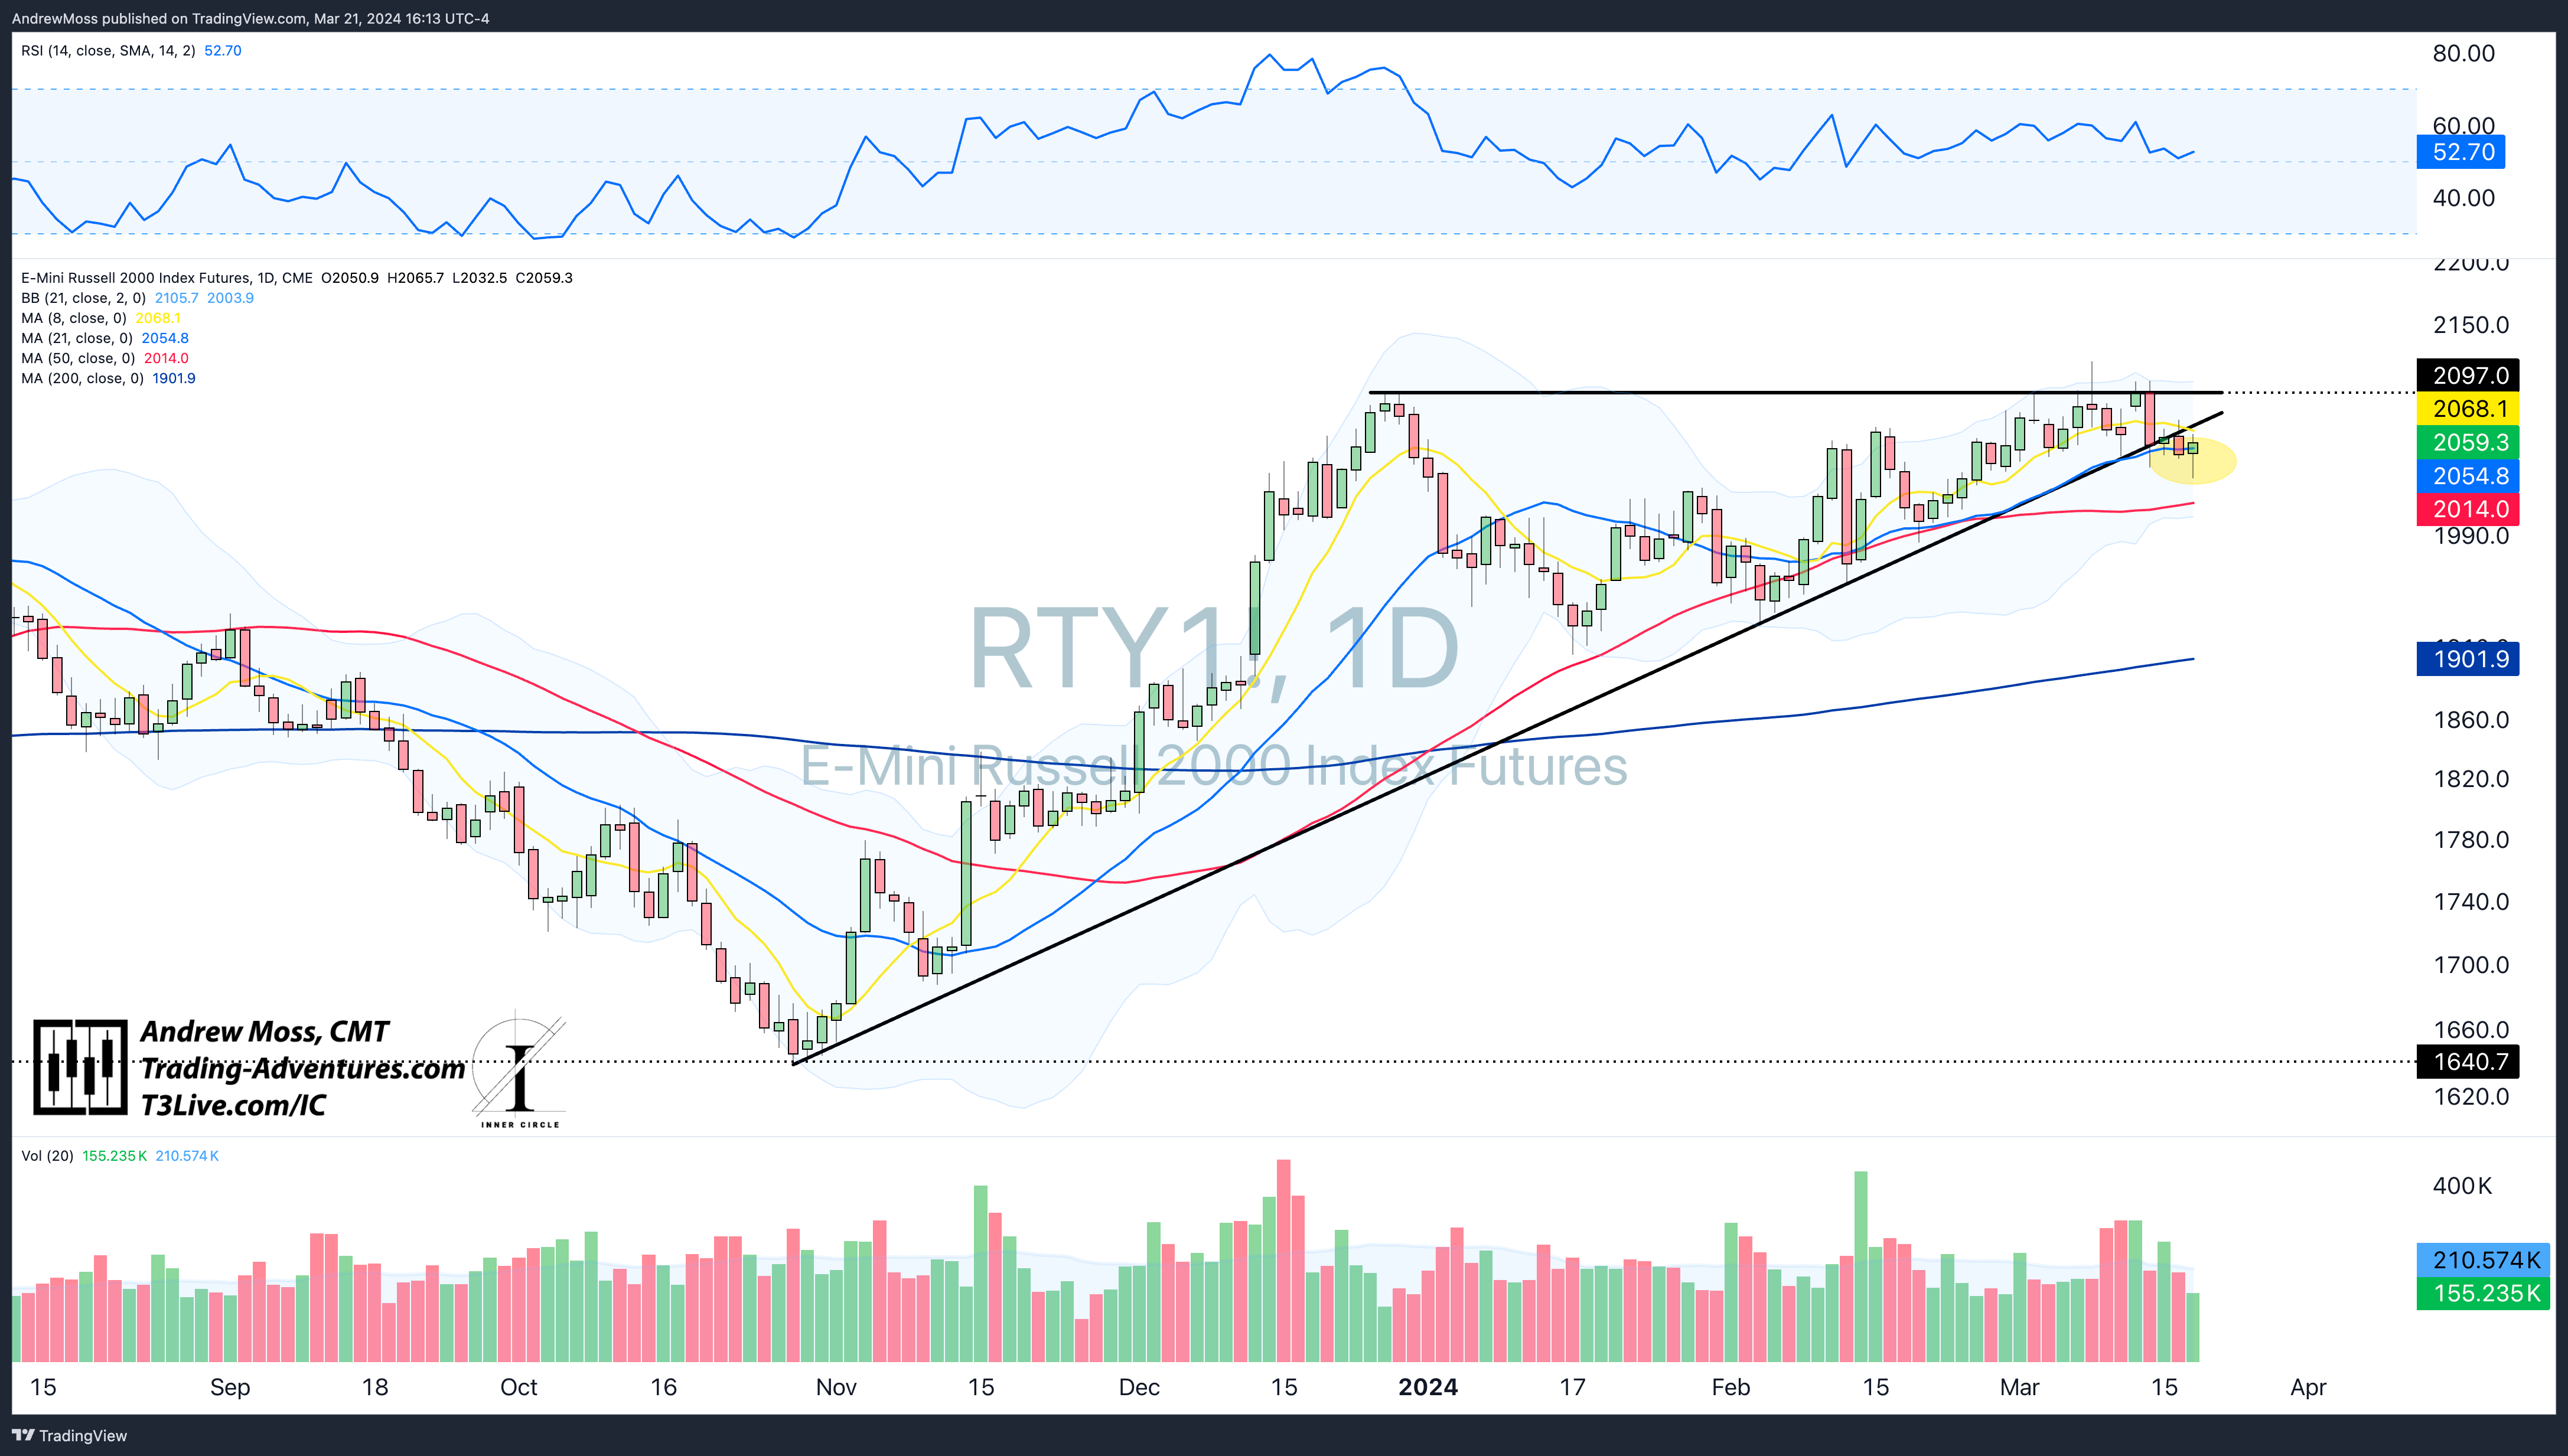
Before that, on Tuesday, small-caps looked vulnerable as the Russell 2000 futures broke below a trendline.
Russell 2000 futures a/o Tuesday afternoon, March 19
At the beginning of the year, as many as six rate cuts were expected.
By yesterday, the consensus was down to three. The market knew that and expected as much. What it did not expect was a dovish and even complimentary Fed Chairman.
That's what we got at the 2:30 press conference.
Powell said that he “thinks the market has it right” and that “he’s not worried about the jobs data.”
Employment is strong. Wage growth is positive. The economy is growing and resilient.
That was enough to send stocks to new highs and bears to the infirmary.
Russell 2000 futures today, March 21

The hammer on the 21-day MA overpowered the sellers, resulting in a failed breakdown. As we know, from failed moves come fast moves in the opposite direction. RTY futures follow the script by breaking out today.
The SP 500, which had already reached a new closing high on Tuesday, went higher to do it again. As did the Dow Jones Industrials.
Breakout confirmed.
The NASDAQ moved back over the short-term moving averages while the small-cap Russell 2000 index logged impressive gains for the day.
They didn’t reach breakout status immediately, but they got the job done today.
The Charts
SPY breaks out of the consolidation range and into new highs once again. The technical picture continues to show a persistent bullish trend with shallow pullbacks that have been quickly bought.

QQQ narrowly logged a new closing high today after nearly a month of consolidation. Though it was well off today's highs, the overall uptrend has resumed after a short break.

IWM books a new closing high for the year, while the pivot high is still a few points overhead. Small-cap participation increases overall market strength.

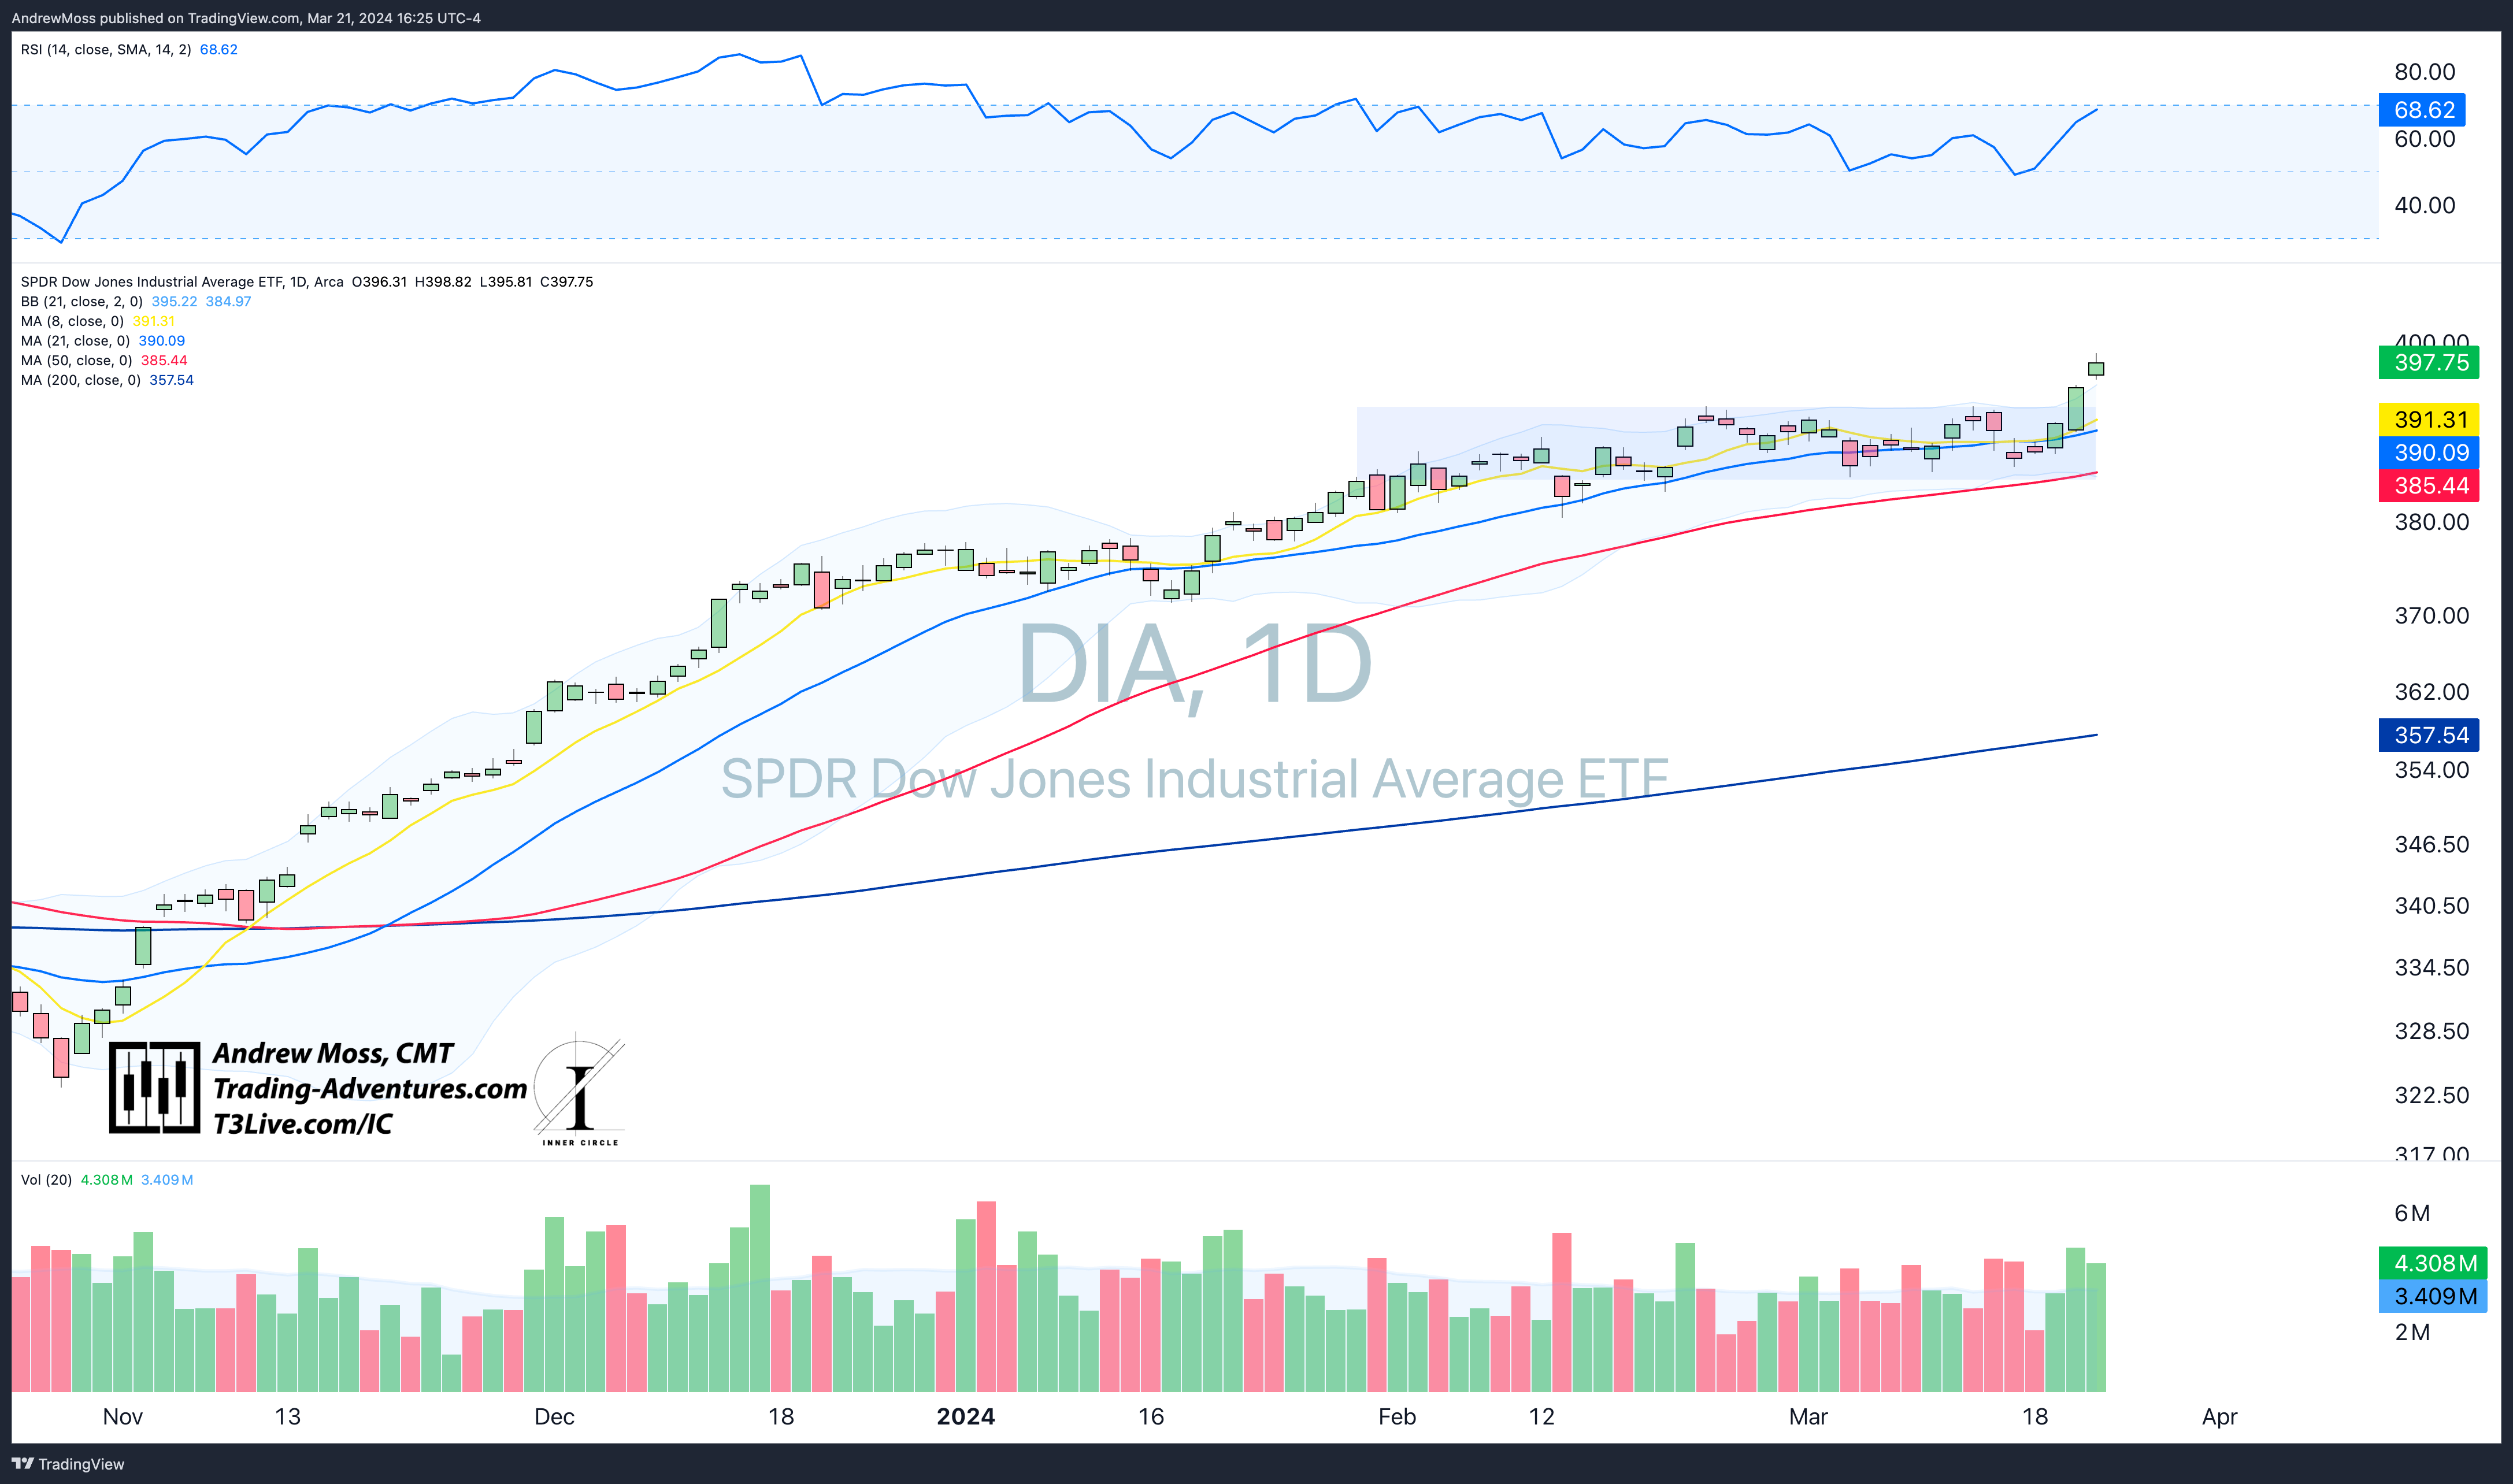
DIA finally rose above the range it entered in late January.
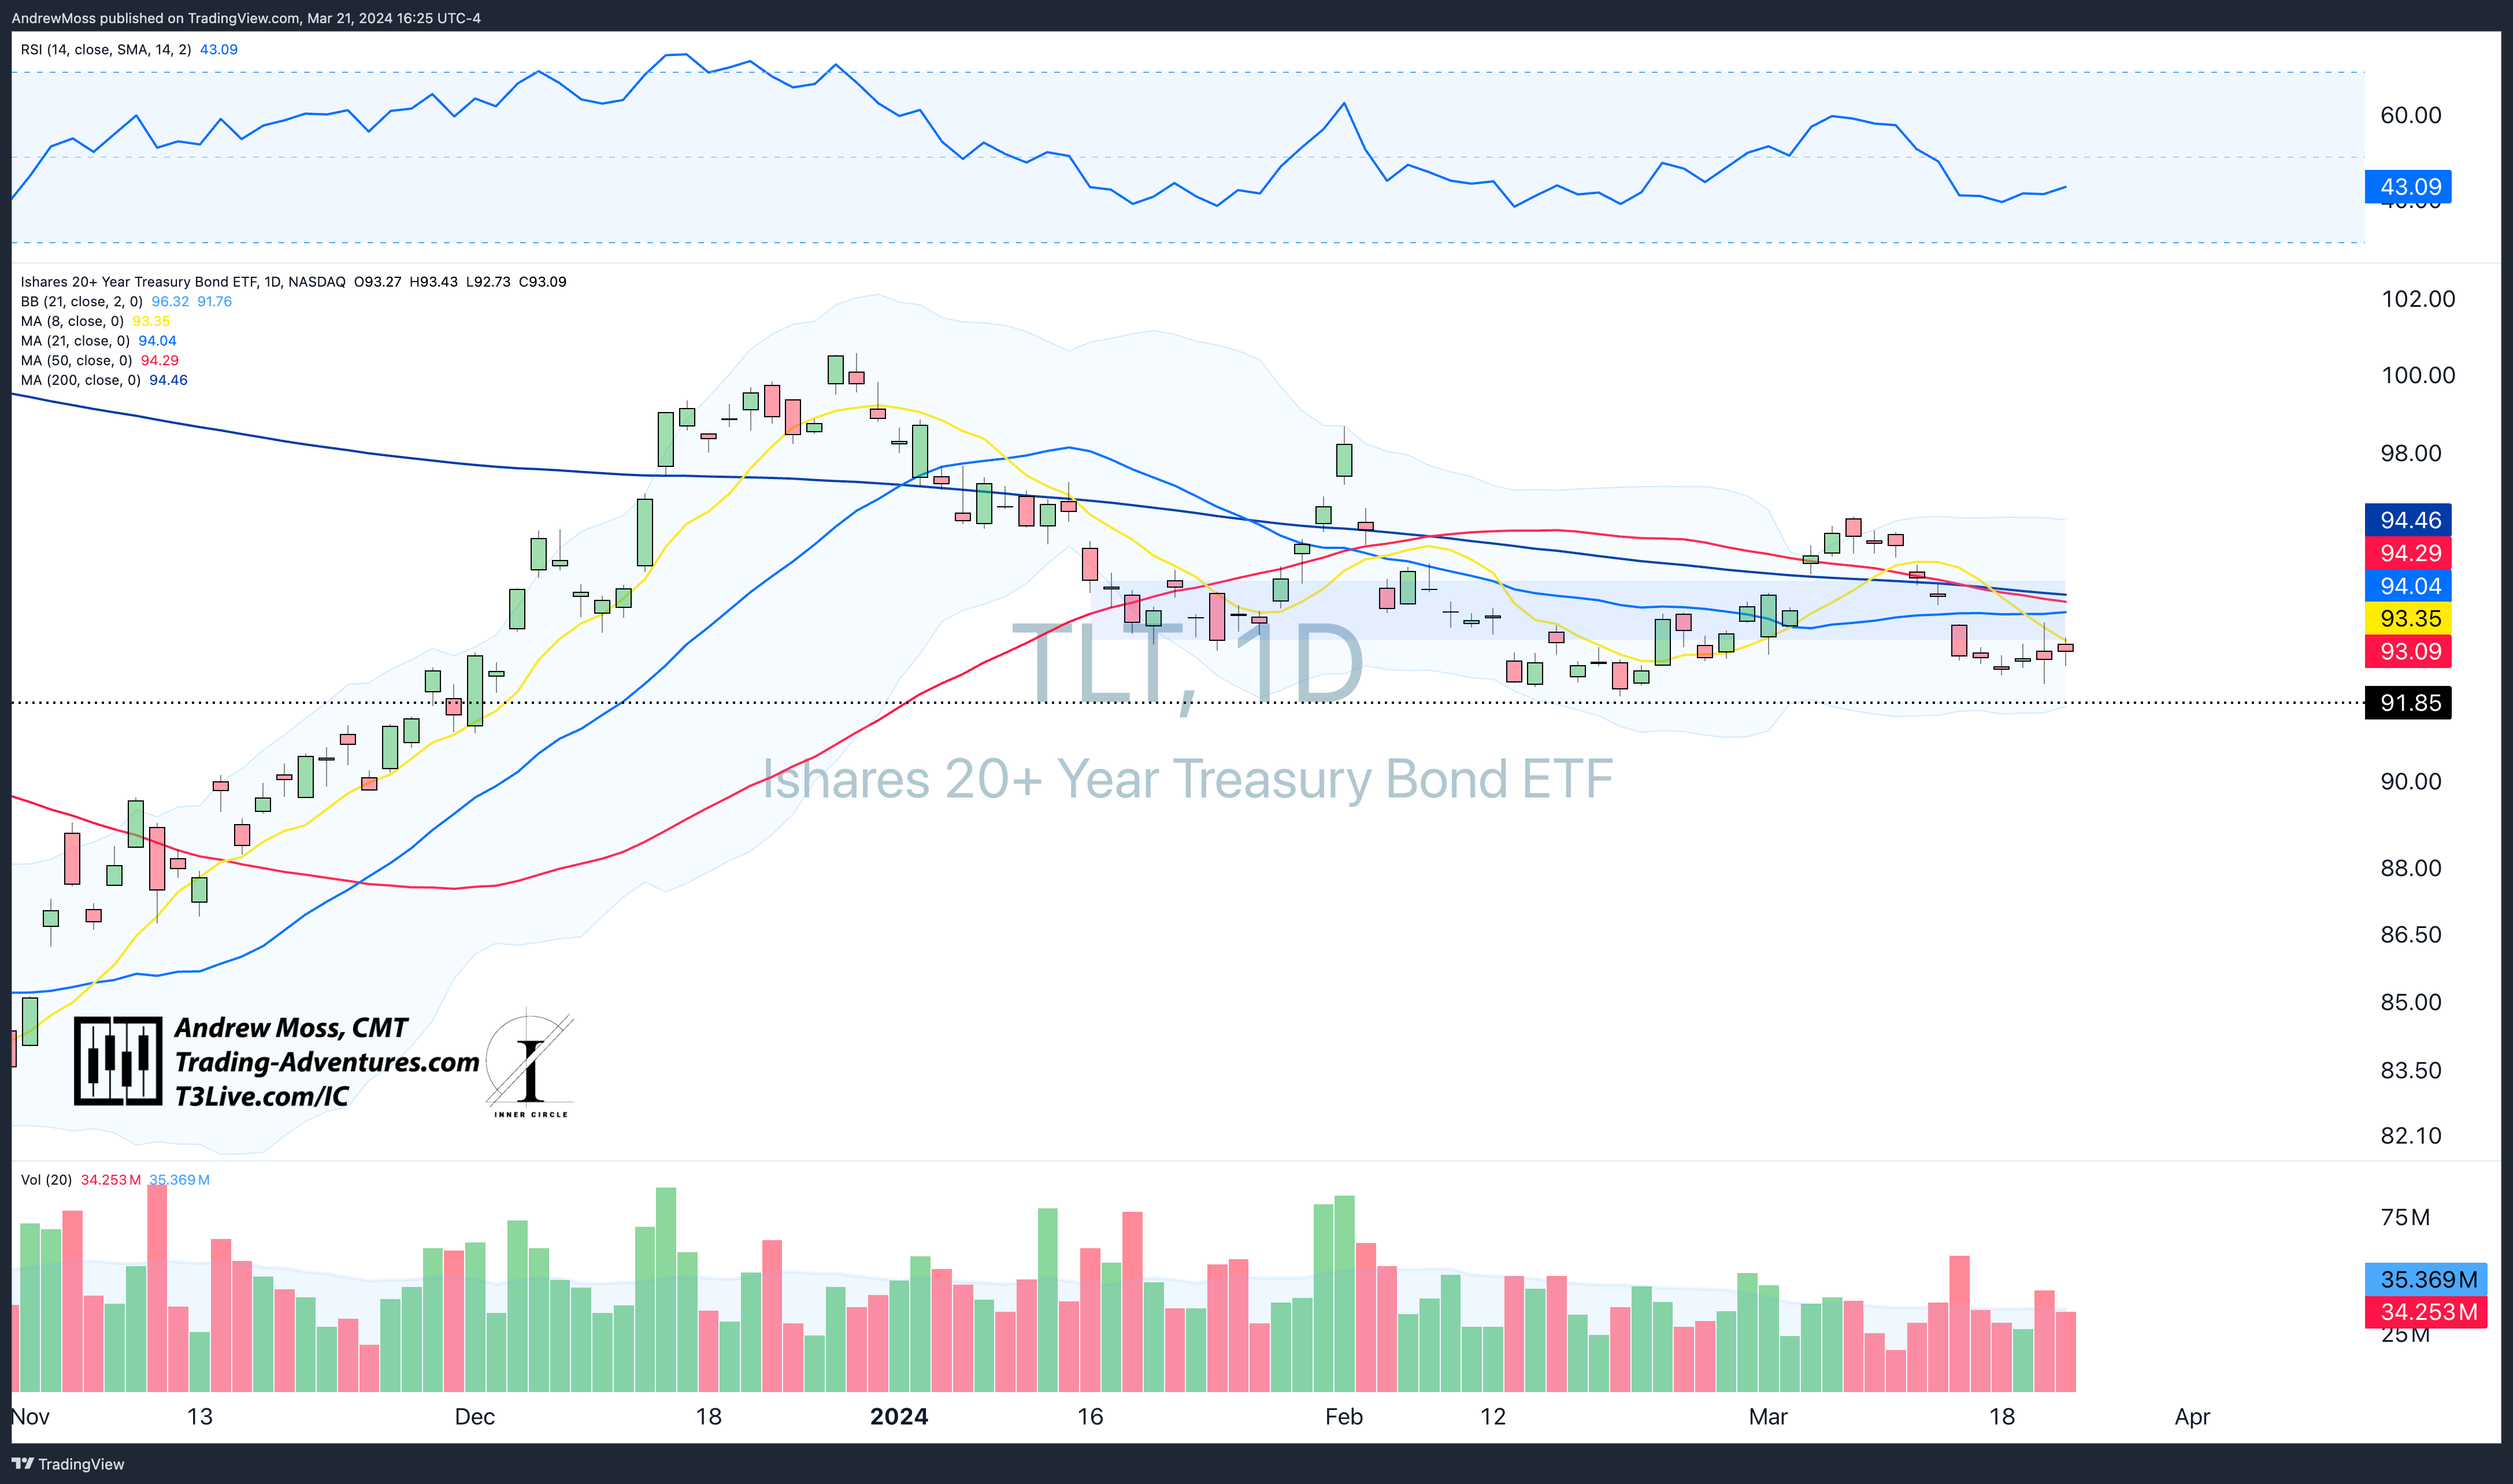
TLT stays close to the range and near all key moving averages. Quiet action here leaves more room for stocks to rise.
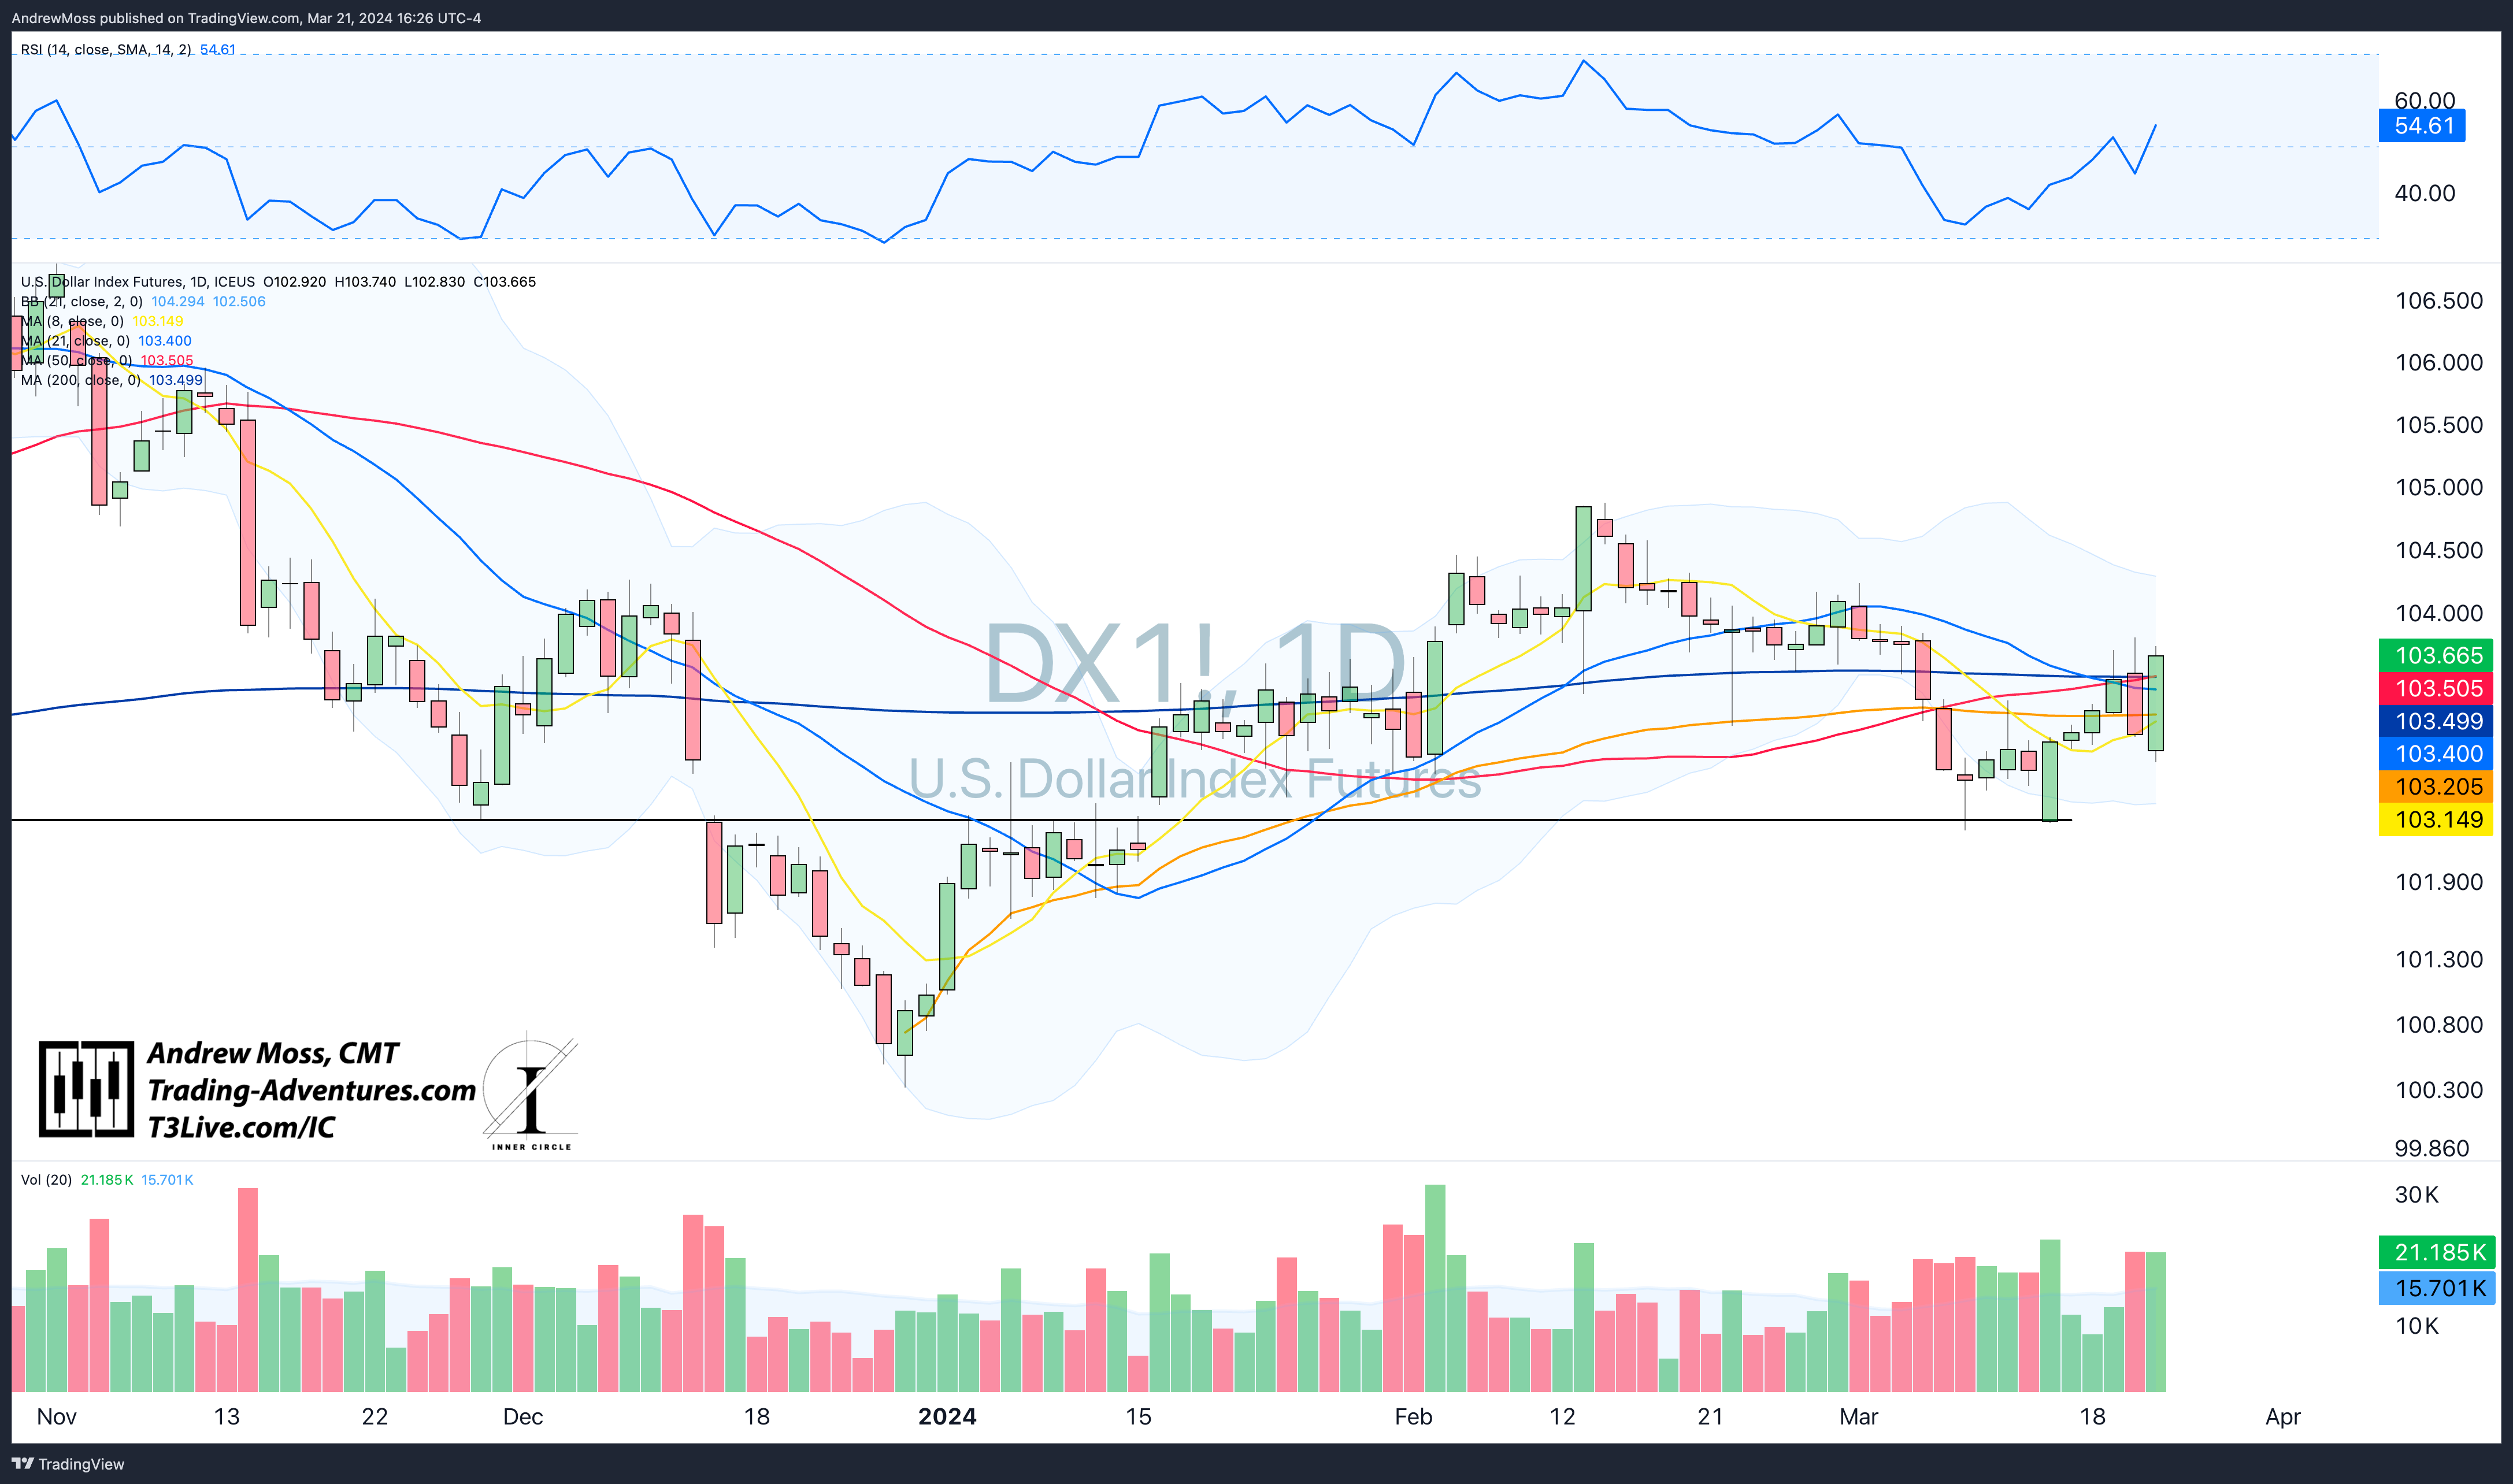
DXY Dollar futures expand the very short-term range without moving much in one direction. Continue to monitor; however, stocks seem to pay less attention.
BTCUSD sees some volatility, working off the incredibly strong, recent move. So far, the AVWAP from the breakout has been support.

The Trade
We will continue to focus on long positions in this strong, bullish environment.
Positive price action refutes doubts and uncertainties quickly, and each opportunity for a pullback seems to be cut short. Overbought conditions and extensions from the short-term moving averages repeatedly get resolved in a calm, orderly fashion. Potential support levels keep proving to be actual support levels.
Buy uptrends and manage risk.
As always, weekly charts will be out Saturday morning on X. Join me there for a look at the longer-term charts, market breadth, sentiment, and other macro big-picture factors.
See you then.
Elevate Your Trading
Education, training, and support for your Trading Adventure.

Options Trades - Weekly trade ideas are delivered to your email or text messages in language you can easily understand.
Check out EpicTrades from David Prince and T3 Live. Epic Trades from David Prince
Community - Are you an experienced trader seeking a community of professionals sharing ideas and tactics? Visit The Inner Circle, T3 Live’s most exclusive trading room - designed for elite, experienced traders.
The Inner Circle at T3 Live
Prop Trading - Or perhaps you are tested and ready to explore a career as a professional proprietary trader? 3 Trading Group has the technology and resources you need.
Click here to start the conversation:
T3TradingGroup.com
The Disclosures
***This is NOT financial advice. This is NOT a recommendation to buy, sell, or trade any security. The content presented here is intended for educational purposes only.
Andrew Moss is an associated member of T3 Trading Group, LLC (“T3TG”), an SEC-registered broker/dealer and member of FINRA/SIPC. All trades placed by Mr. Moss are done through T3TG.
Statements in this article represent that person’s opinions only and do not necessarily reflect those of T3TG or any other person associated with T3TG.
Mr. Moss may hold an investment position (or may be contemplating holding an investment position) that is inconsistent with the information provided or the opinion being expressed. This may reflect the financial or other circumstances of the individual, or it may reflect some other consideration. Readers of this article should consider this when evaluating the information provided or the opinions being expressed.
All investments are subject to the risk of loss, which you should consider in making any investment decisions. Readers of this article should consult with their financial advisors, attorneys, accountants, or other qualified investors before making any investment decision.
POSITION DISCLOSURE
March 21, 2024, 4:00 PM
Long: CVNA0419C90, DELL0419C110, IMNM, IWM0328C210, LABU, NVDA, PLTR0419C25, TNA0322C42, VKTX0419C80, XBI0419C97.50
Short:
Options symbols are denoted as follows:
Ticker, Date, Call/Put, Strike Price
Example: VXX1218C30 = VXX 12/18 Call with a $30 strike