Classic Bull Market Action
Midweek Market Update February 15, 2023
Last Friday many were wringing their hands and sitting on edge while awaiting the CPI data. The report, announced yesterday was a little “hotter” than expected. But the market didn’t care.
That’s classic bull market action.
When stocks “should” do something, and they don’t, that’s useful information. When stocks rally on lackluster, or even disappointing news, that’s also useful information.
Could it be that we are finally moving past the age of waiting on the next “most important announcement ever?”
And it’s not just the mega-caps that are going up. The equal-weight indexes, RSP and QQEW, look bullish too.
Meanwhile, AMZN and GOOGL are lagging noticeably, as are the defensive plays; Consumer Staples XLP, Utilities XLU, and Healthcare XLV for example.
For the leaders, 10 days of consolidation, mostly above the 8 and 21-day EMAs is, you guessed it, classic bull market action. A break higher from here could really ignite the next stage of this move.
The market has been and continues to tell us that it’s a “risk-on” environment. That will change at some point. But it’s not our job to predict when that will happen.
Our job is to watch, analyze, and be ready when it does. Then we can adjust our trades and tactics accordingly.
What do you think?
Agree or disagree, I’d love to hear about it.
The Charts
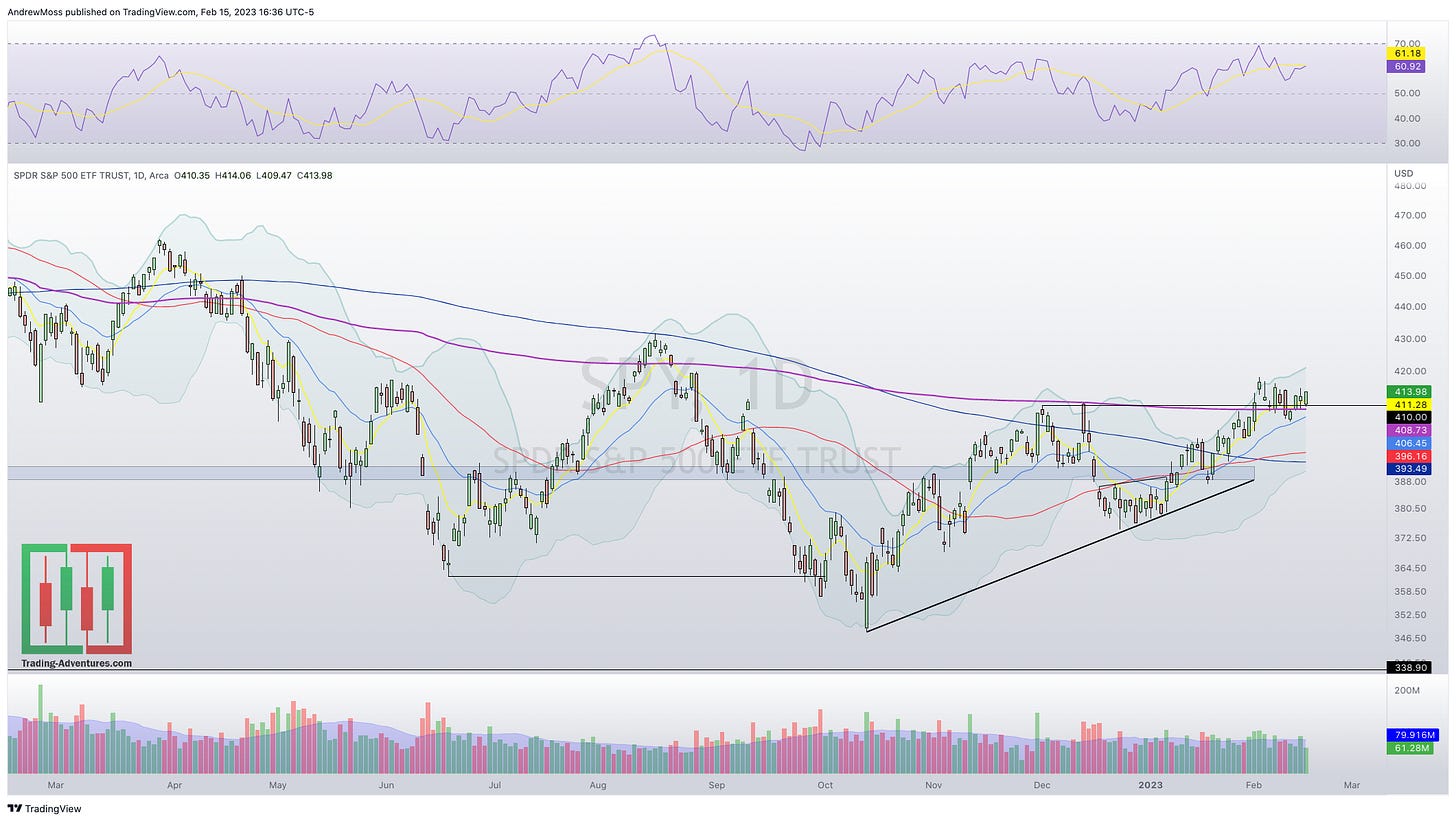
SPY
Strong move off the 390-391 support/resistance and 50-day retest
Pushing the Bollinger Bands higher
Then came back to consolidate around the ATH anchored VWAP
RSI staying bullish
Building a bull flag pattern now
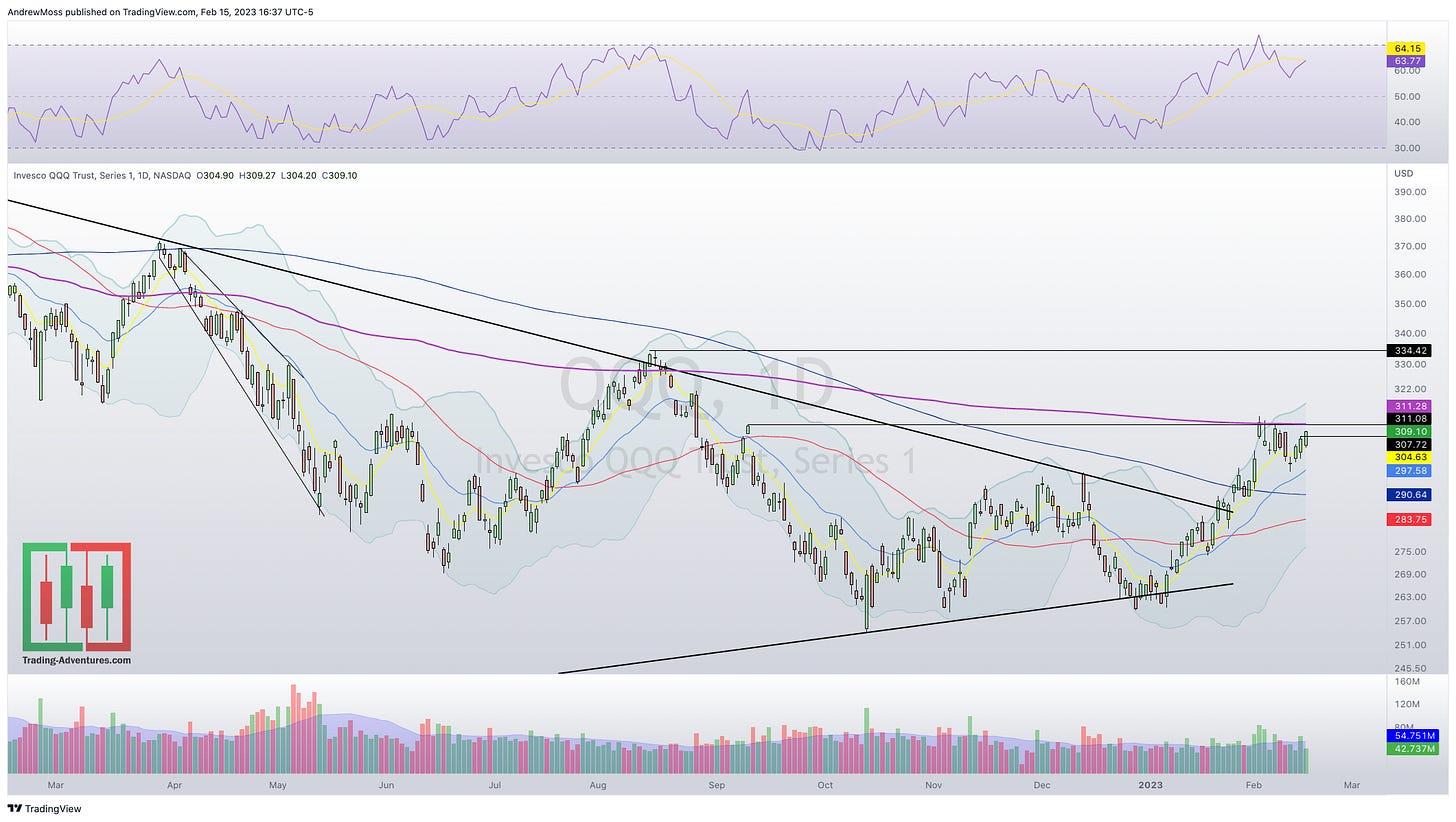
QQQ
Strong move off the test of the uptrend line back at the start of the year
Above all the key moving averages
Finding resistance at the ATH AVWAP
Resumed higher from the 2/10 reversal candle
21 EMA is just below
A move back through 311 adds to the bullish case
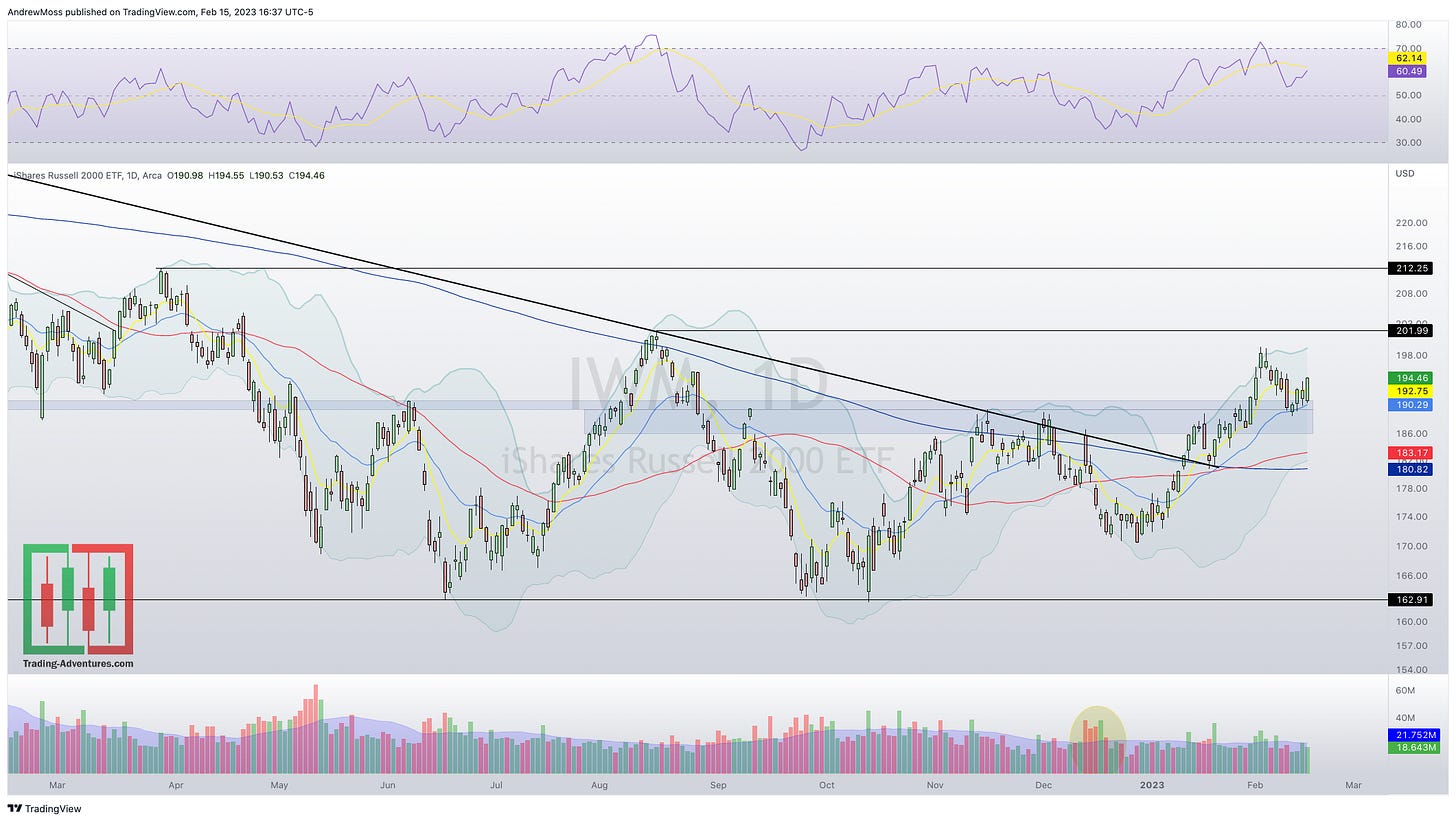
IWM
Consolidated at 186-189 resistance zone after breaking above the downtrend line
Breakout through that 189-191 zone
Pulled back to retest w/ the 21 EMA supporting
Now trying to resume higher
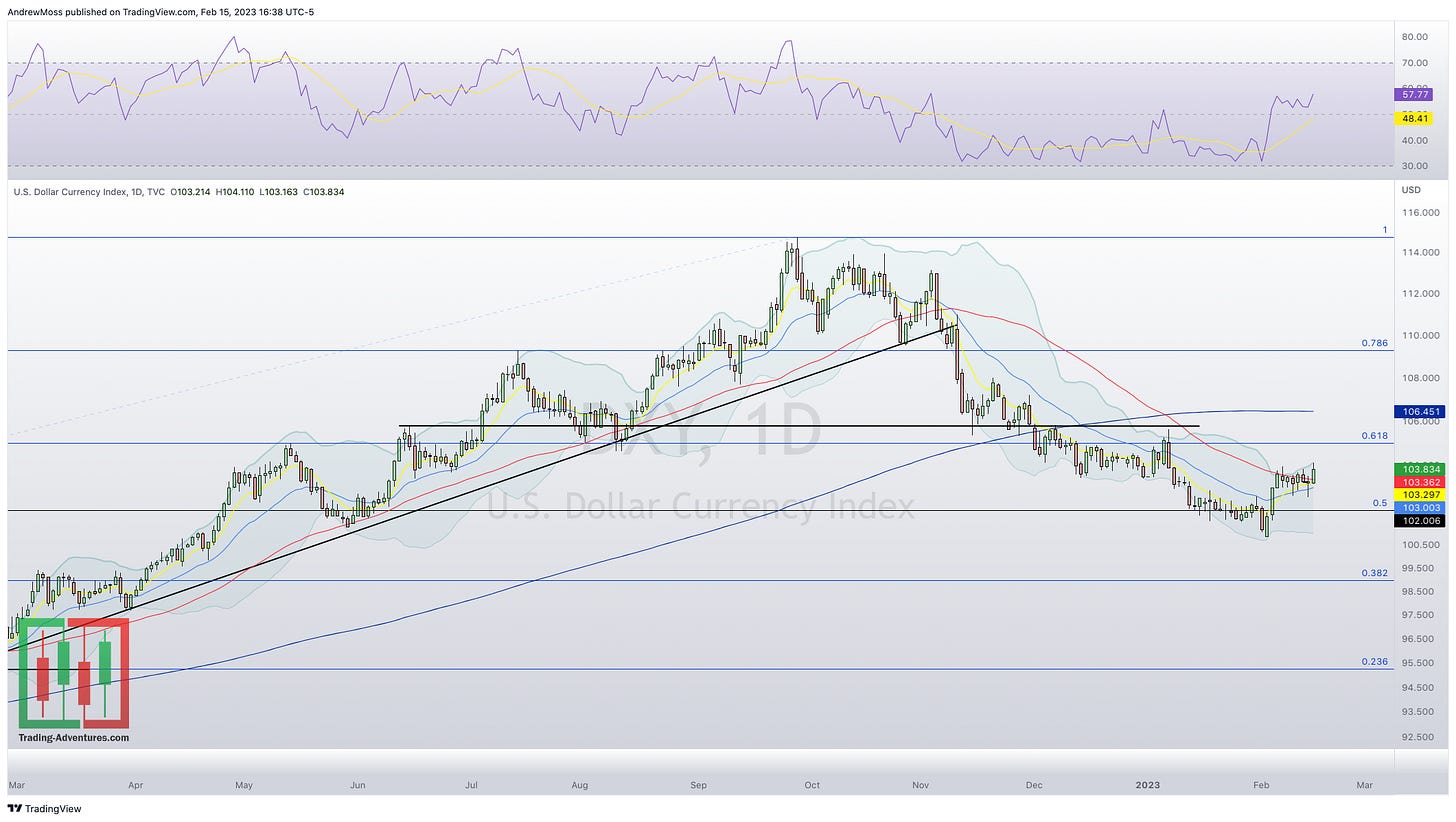
DXY
The dollar continues to be a potential “red flag.” Actually, it’s in a bull flag pattern and trying to move higher. So far it doesn’t seem to be hampering stocks much though. Not US stocks, at least.
Changing relationships = more useful information.
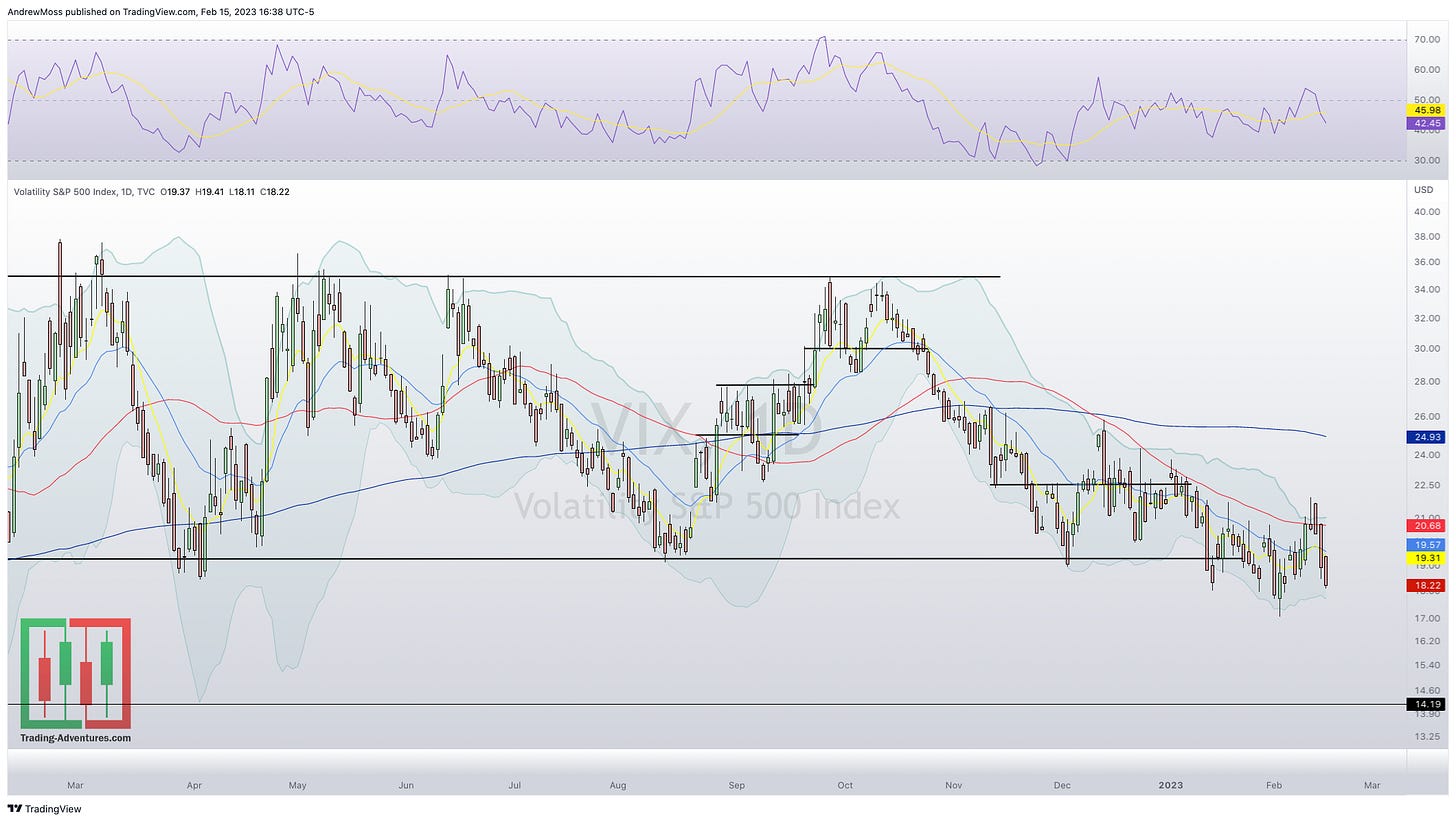
VIX
Volatility was unable to get higher and stay there.
Trade well. Be well. Do good.
***This is NOT financial advice. NOT a recommendation to buy, sell, or trade any security. The content presented here is intended for educational purposes only.
Andrew Moss is an associated member of T3 Trading Group, LLC (“T3TG”) a SEC registered broker/dealer and member of FINRA/SIPC. All trades placed by Mr. Moss are done through T3TG.
Statements in this article represent the opinions of that person only and do not necessarily reflect the opinions of T3TG or any other person associated with T3TG.
It is possible that Mr. Moss may hold an investment position (or may be contemplating holding an investment position) that is inconsistent with the information provided or the opinion being expressed. This may reflect the financial or other circumstances of the individual or it may reflect some other consideration. Readers of this article should take this into account when evaluating the information provided or the opinions being expressed.
All investments are subject to risk of loss, which you should consider in making any investment decisions. Readers of this article should consult with their financial advisors, attorneys, accountants or other qualified investors prior to making any investment decision.
POSITION DISCLOSURE
February 15, 2023 4:00 PM
Long: ADBE, MRNA, QQQ
Short:
Options symbols are denoted as follows:
Ticker, Date, Call/Put, Strike Price
Example: VXX1218C30 = VXX 12/18 Call with a $30 strike


