“Could Stocks Actually Bounce?”
Three Charts Showing That Potential - Market Update Thursday October 5, 2023
The Markets
The bears are growling more loudly.
Rates, mortgages, housing, inflation, recession …..
As the challenges pile up and stocks go down, it’s important to keep considering the other side by asking,
“Could stocks actually bounce from here?”
In the midst of the growing negativity, let’s pause for a minute and look at the upside potential.
Here are three views of the SP 500 to illustrate.
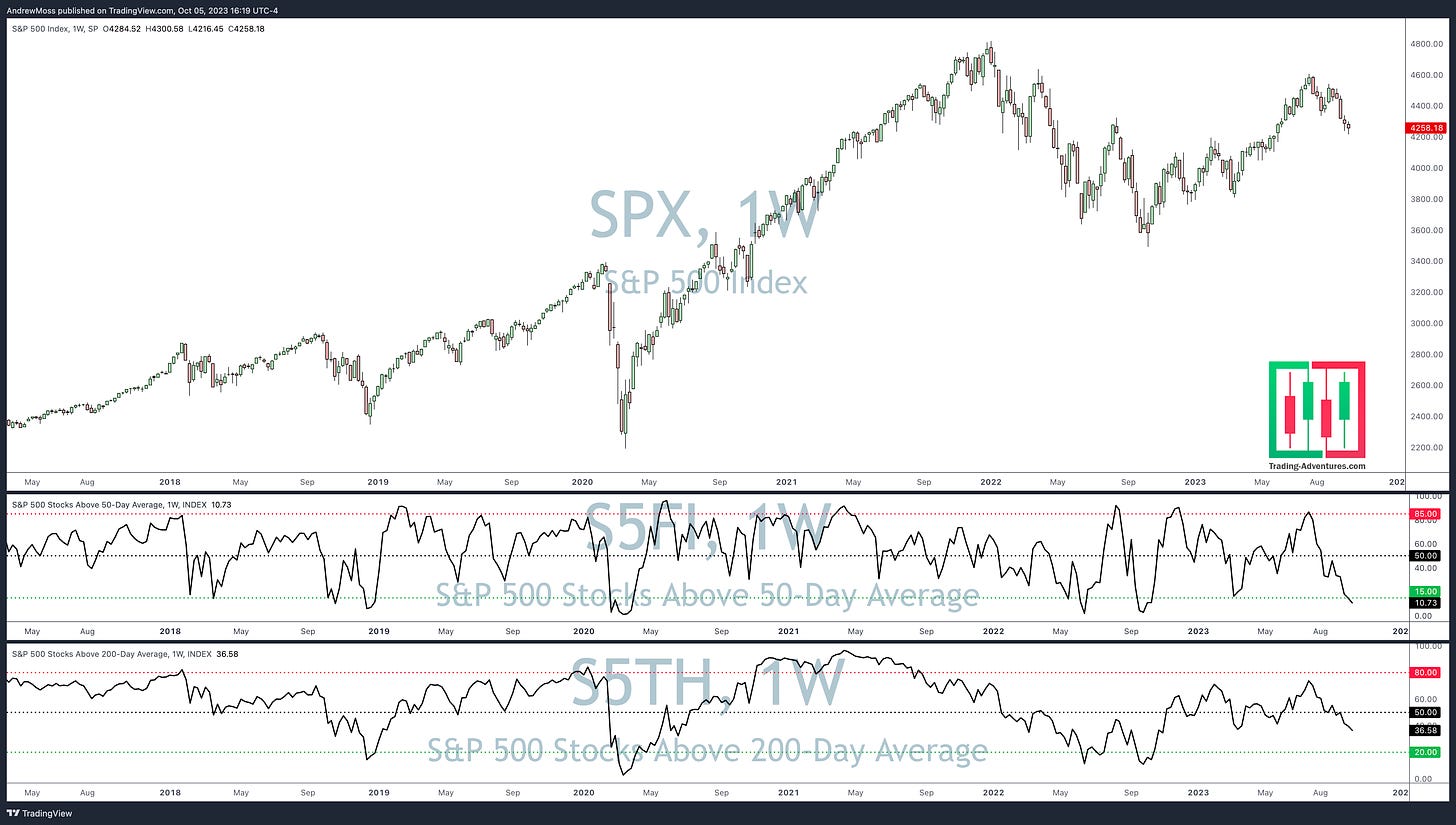
Percentage Of SPX Stocks Above The 50 And 200-day MAs
First, consider the oversold nature of SP 500 stocks relative to their 50-day moving averages. Only 10% are higher, a condition that has preceded many meaningful bounces in the past.
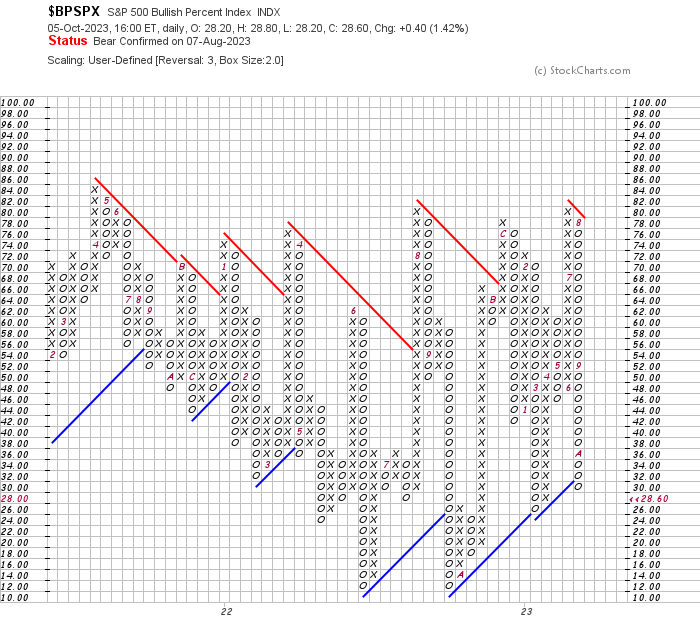
Bullish Percent Indexes
Next, take a look at the SPX Bullish Percent Index.
The percentage of SPX stocks showing a buy signal on a point and figure chart is in a large column of O’s with a reading of 28.60. Similar to the moving average chart above, this chart indicates potential selling exhaustion.
A move above 30 and an accompanying reversal back into a column of X’s would signal a “Bull Alert.”
The last time this happened was March 21, 2023 - one week after a notable market bottom.
Elliot Wave And A Retest Of The SPX 4200 Breakout
Finally, a potential Elliot Wave sequence. Elliot Wave theory can be complicated and esoteric. We’ll avoid going into detail.
In general terms, Elliot Wave theory suggests that stocks form a primary trend by moving in patterns of 5 waves, and corrective moves in patterns of 3 waves.
This chart shows Waves 1-4 conforming to a logical pattern.
Wave 1 starts the move higher
Wave 2 retraces nearly 38.2% of Wave 1 - a significant Fibonacci level
Wave 3 extends to the 161.8% Fibonacci extension of Wave 1
Wave 4 is currently retesting the end of Wave 1, which also happens to be a retest of the $4200 breakout level and has the 40-week (200-day) Moving Average close by
If this pattern holds and a bounce occurs soon, Wave 5 could take the SPX up near the $5000 level.
Now the daily charts
The Charts
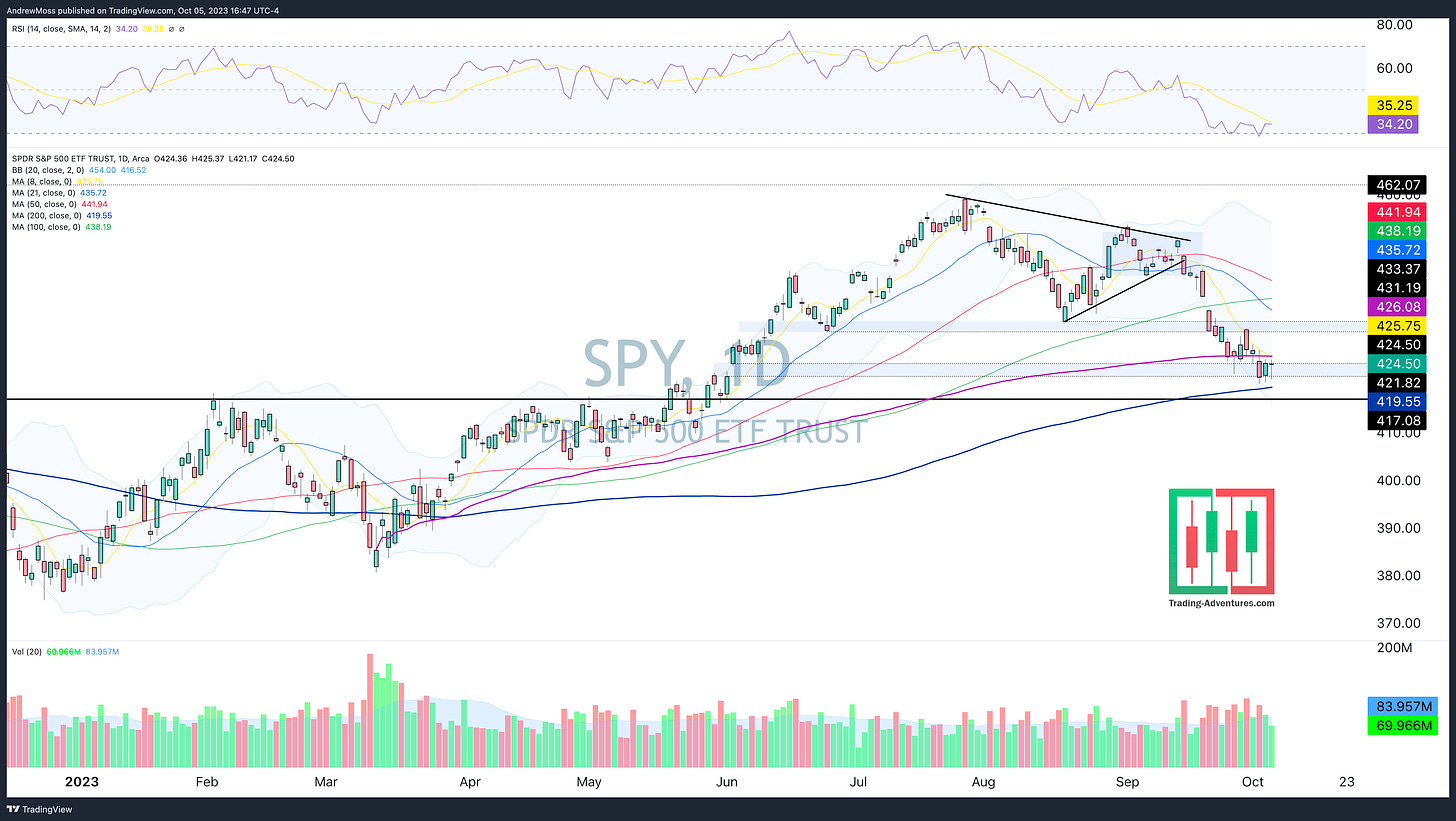
SPY is holding the shaded gap area well, closing near the highs for the last two days. A move above the 8-day MA and the AVWAP should give way to the next shaded area above and the accompanying pivot levels, for starters.
QQQ remains mostly above the shaded area and closed today above the 8-day MA and the AVWAP. $364.50 is the next critical level above and has a gap pivot level, the 100-day and 21-day moving averages.
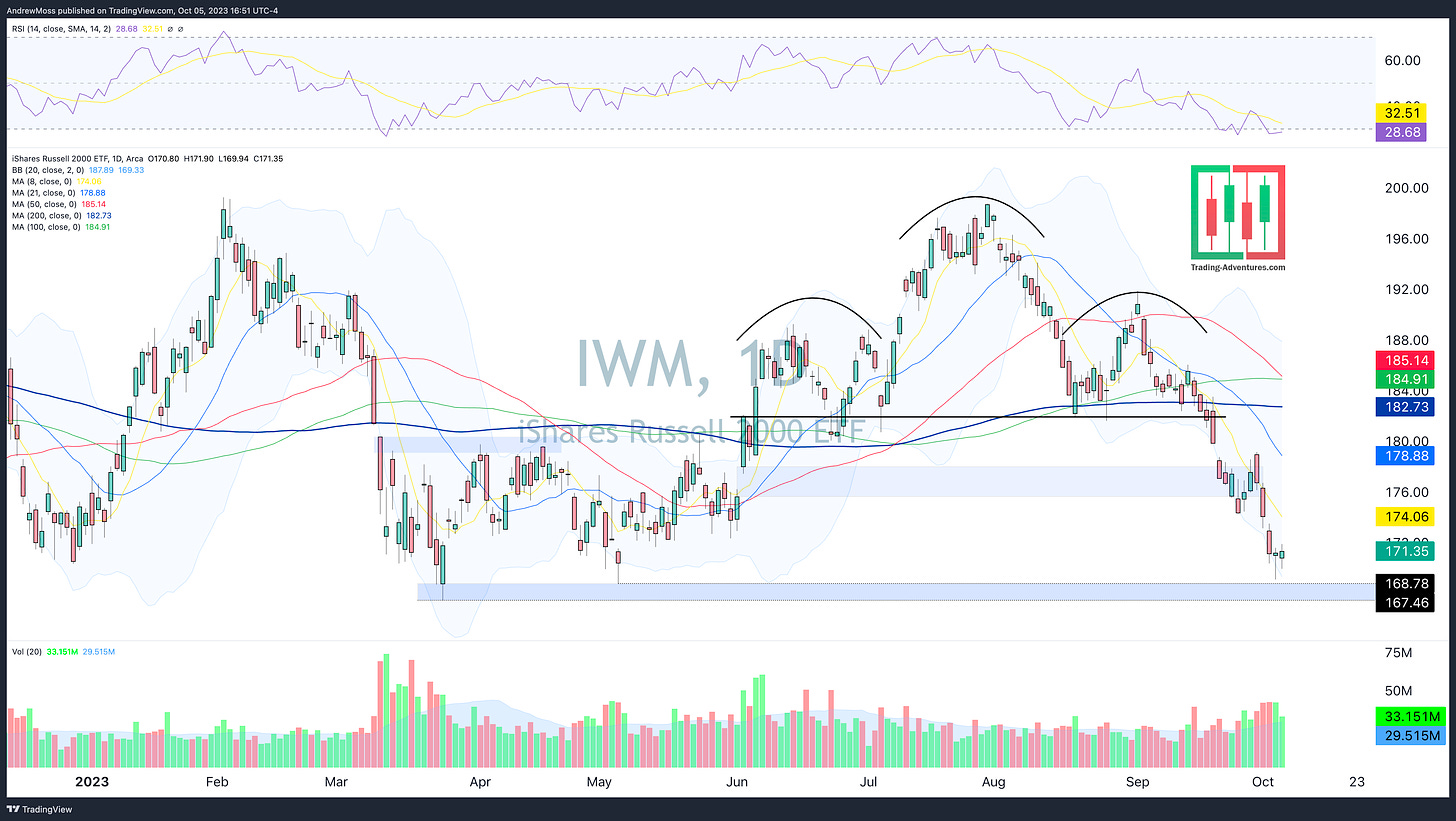
IWM has been terrible lately. But the last three days actually show a potential reversal pattern. There is lots of room overhead before running into the 8 and 21-day MAs. RSI is also flattening out.
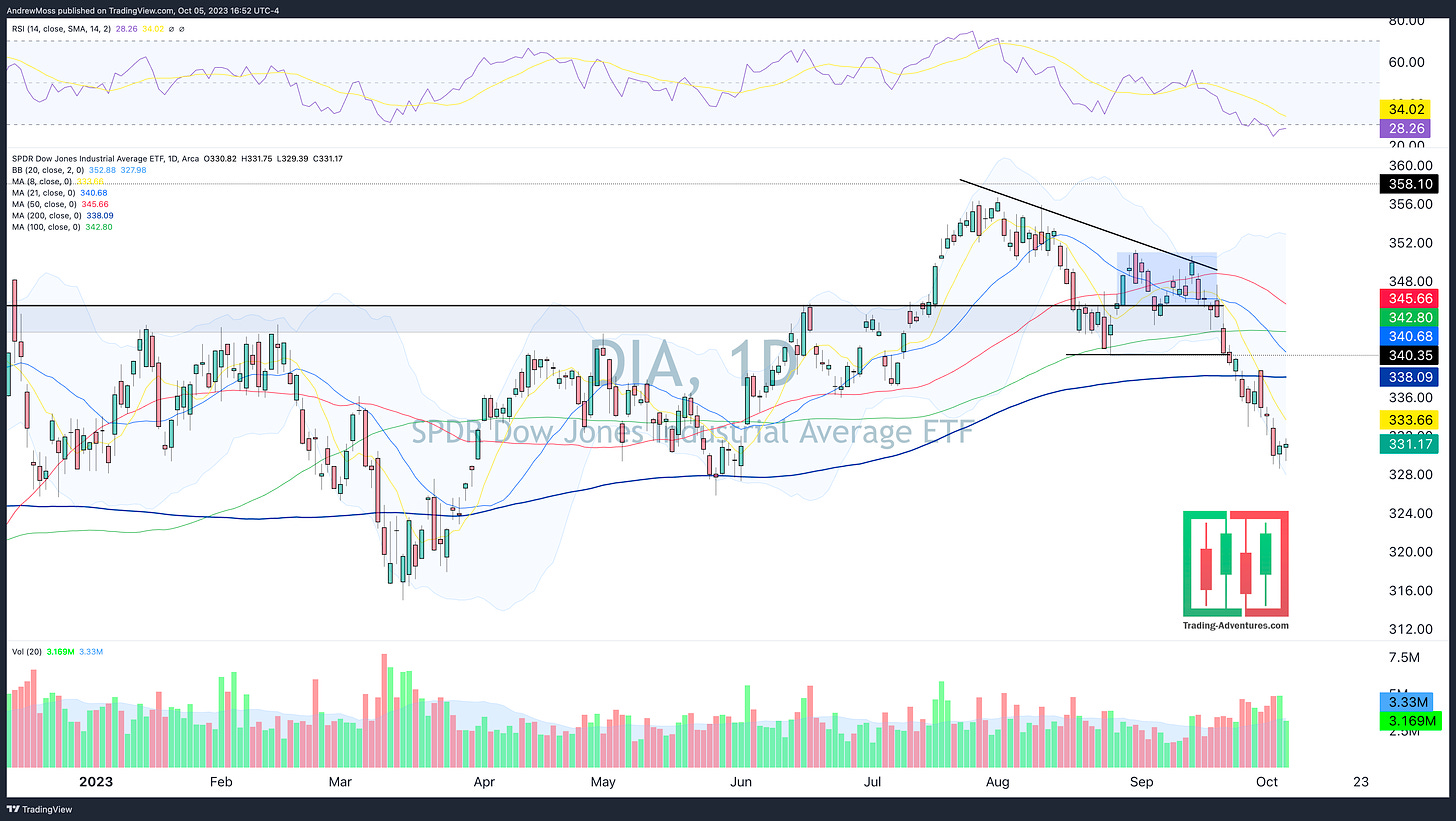
DIA has a pattern very similar to IWM. Important to note that RSI is oversold ( < 30), a level not seen since late September of 2022. That occurrence was followed by a powerful October bottom and subsequent 20% rally.
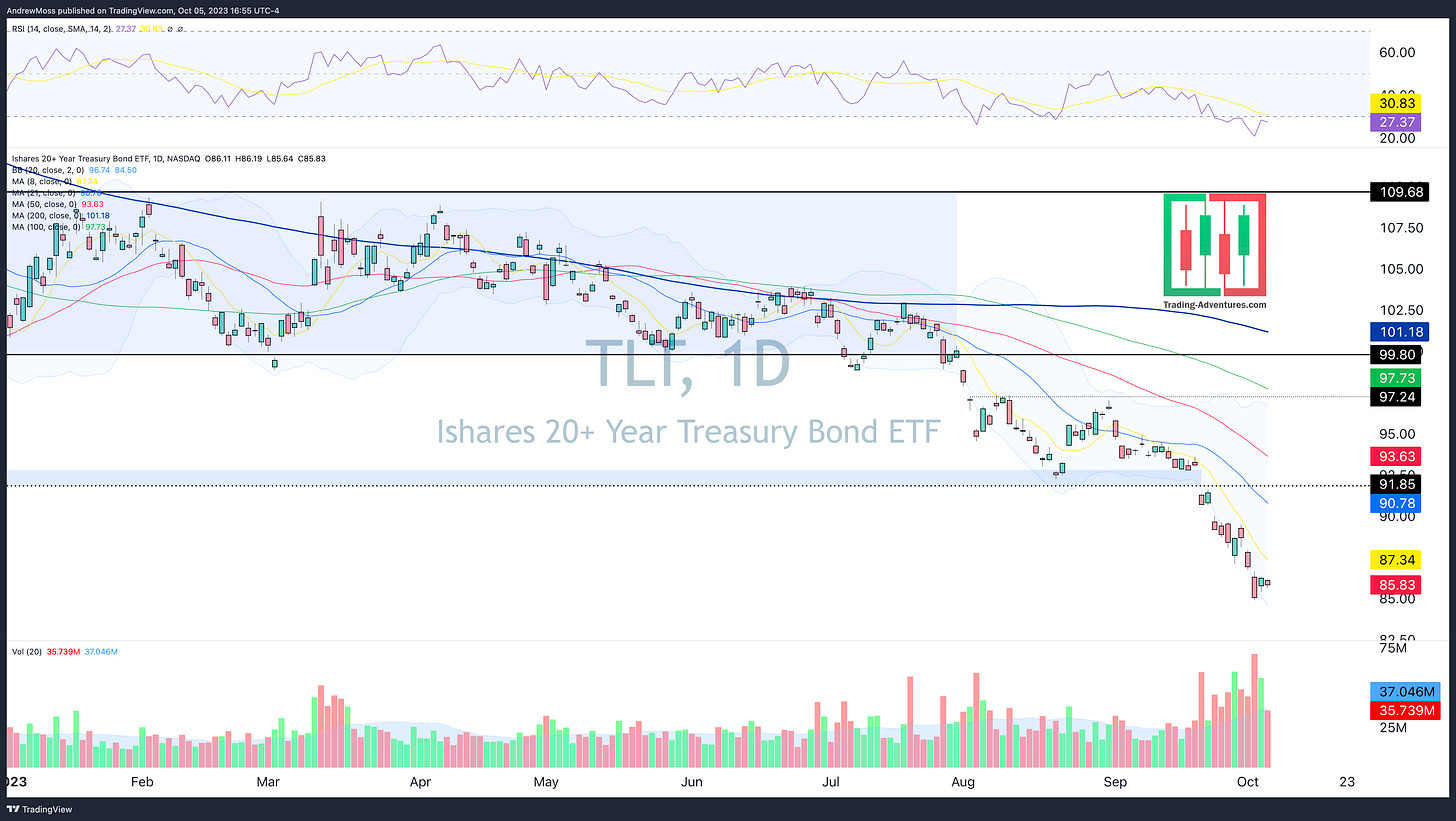
TLT is still struggling to find a bid. RSI is oversold and has been for two weeks. A good reminder and example that oversold can remain oversold. It doesn’t automatically mean the bottom is near.
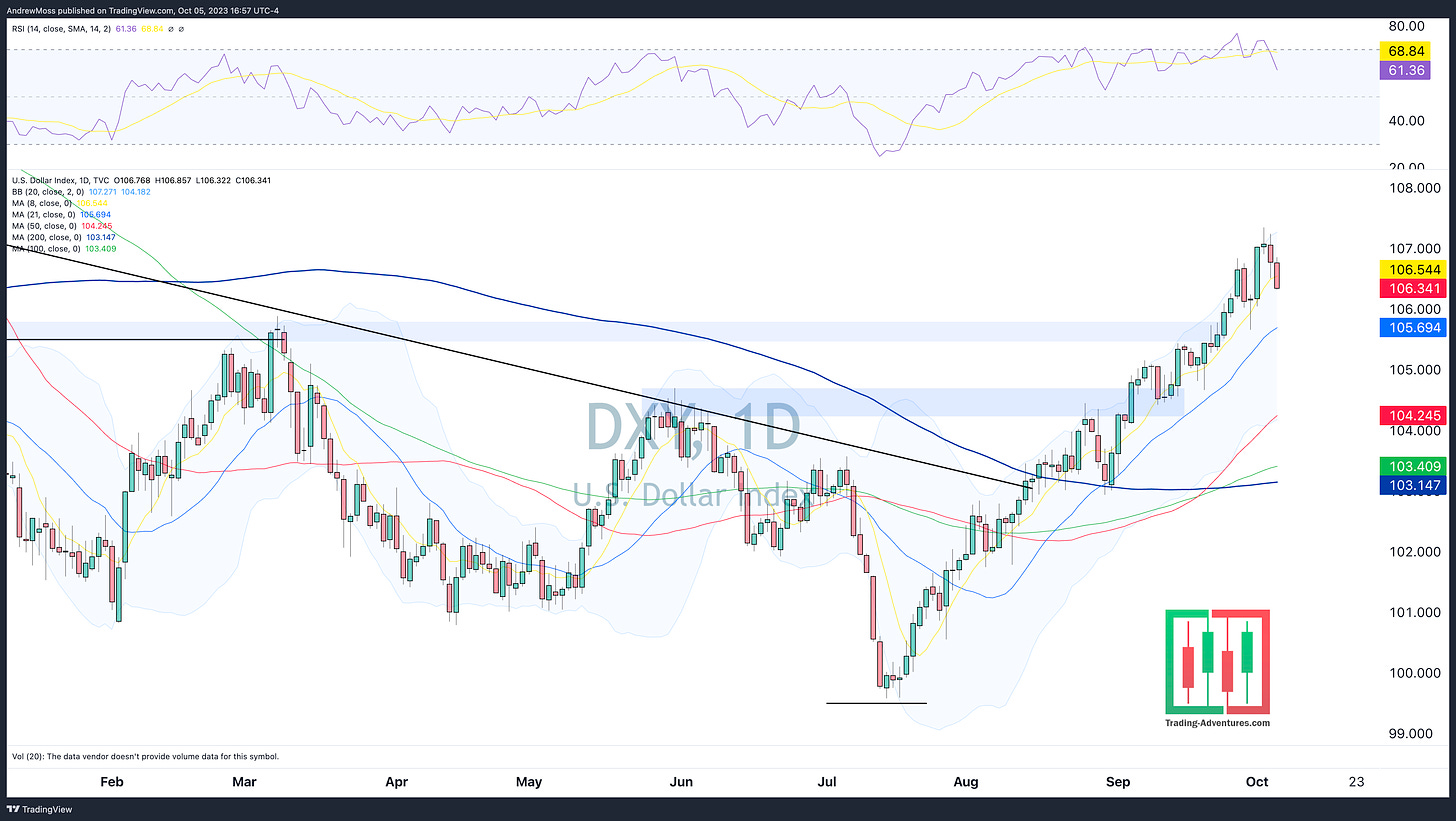
DXY has been overbought but is starting to rectify the situation. Once again, powerful selling for a couple of days. It’s a start. But we’ve seen this many times before during this rally. This one needs to get below and stay below the 21-day MA to continue to provide lasting relief for stocks.
The Closing Bell
Anything can happen. It goes without saying.
Oversold can stay oversold. Washed out can remain washed out. Low can go lower.
None of these alone mean a bounce is coming.
And to mix in more uncertainty, we have another coin flip (binary event if you’re fancy) tomorrow morning as we await non-farm payrolls.
Surely it’s the most important NFP ever!
/sarcasm_off
The reality though, is that this is an important number. The Federal Reserve is keyed into employment data as a key metric of their interest rate decisions.
We’ll see what happens.
If stocks go lower, and the SPX loses the 200-day moving average, it would have significant bearish implications for funds and money managers.
But if the data is good, and stocks go up, we can see that many pieces are aligned to potentially help a bounce have lasting power.
Housekeeping note: there will not be Weekly Charts on X this Saturday as I will be in Raleigh for Marshall vs. N.C. State. Let the tailgate party commence. Let’s Go Herd!
Have a great weekend!
The Disclosures
***This is NOT financial advice. NOT a recommendation to buy, sell, or trade any security. The content presented here is intended for educational purposes only.
Andrew Moss is an associated member of T3 Trading Group, LLC (“T3TG”) a SEC registered broker/dealer and member of FINRA/SIPC. All trades placed by Mr. Moss are done through T3TG.
Statements in this article represent the opinions of that person only and do not necessarily reflect the opinions of T3TG or any other person associated with T3TG.
It is possible that Mr. Moss may hold an investment position (or may be contemplating holding an investment position) that is inconsistent with the information provided or the opinion being expressed. This may reflect the financial or other circumstances of the individual or it may reflect some other consideration. Readers of this article should take this into account when evaluating the information provided or the opinions being expressed.
All investments are subject to the risk of loss, which you should consider in making any investment decisions. Readers of this article should consult with their financial advisors, attorneys, accountants, or other qualified investors prior to making any investment decision.
POSITION DISCLOSURE
October 5, 2023, 4:00 PM
Long: MSFT
Short:
Options symbols are denoted as follows:
Ticker, Date, Call/Put, Strike Price
Example: VXX1218C30 = VXX 12/18 Call with a $30 strike




Your writing style is clear, concise and enjoyable to read. Thank you for sharing!