

Could we see a bounce?
a quick update

In the weekend review, I pointed out this potential bull case
… prices are getting extended from the moving averages, and the June lows are in sight. Maybe those factors will provide some support.
These factors alone could combine to provide a bounce.
That certainly doesn’t mean it will happen. Just that there are some factors that support the possibility. Let’s have a look.
The charts show that $SPY $QQQ $IWM all printed hammer candles, below the lower Bollinger Bands, and with an RSI < 30.
This setup can be a good bounce signal <IF> the candle reversal pattern is confirmed.
Many individual names, FANGs and otherwise, are showing similar charts.
$META, $AMZN, $AMD, $GOOGL, $MSFT, and more
Tomorrow morning I’ll be watching for the hammer reversal patterns to be confirmed by trading above Friday’s HOD (high of the day).
If this happens, then a further bounce is likely. How long and how far is anyone’s guess. Risk management will be crucial, as always.
That means knowing where the exit is well before entering.
A move below the low of the Friday hammer will negate the pattern.
Another risk factor is the high correlations.
These charts all look the same. Failure in one could very easily lead to failure in many.
Let’s see what happens.
Stay patient. But be ready for anything.
***This is NOT financial advice. NOT a recommendation to buy, sell, or trade any security. The content presented here is intended for educational purposes only.
Andrew Moss is an associated member of T3 Trading Group, LLC (“T3TG”) a SEC registered broker/dealer and member of FINRA/SIPC. All trades placed by Mr. Moss are done through T3TG.
Statements in this article represent the opinions of that person only and do not necessarily reflect the opinions of T3TG or any other person associated with T3TG.
It is possible that Mr. Moss may hold an investment position (or may be contemplating holding an investment position) that is inconsistent with the information provided or the opinion being expressed. This may reflect the financial or other circumstances of the individual or it may reflect some other consideration. Readers of this article should take this into account when evaluating the information provided or the opinions being expressed.
All investments are subject to risk of loss, which you should consider in making any investment decisions. Readers of this article should consult with their financial advisors, attorneys, accountants or other qualified investors prior to making any investment decision.
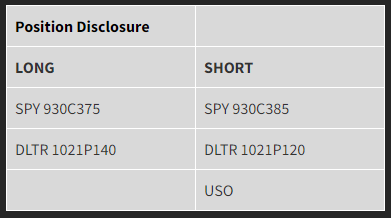
Please Note: short puts are synthetic longs, and short calls are synthetic shorts
Options symbols are denoted as follows:
Ticker, Date, Call/Put, Strike Price
Example: VXX1218C30 = VXX 12/18 Call with a $30 strike