Crying $WOLF?
Semiconductors have been under the gun lately. One might think that impending trouble in Taiwan combined with a global shortage of microchips would create a supply and demand imbalance strong enough to lift the stock price of any company even somewhat related to chip production. But stories and price action do not always align.
Given that stories can be crafted, created, spun, and supplanted by just about anyone, let’s keep focusing on price.
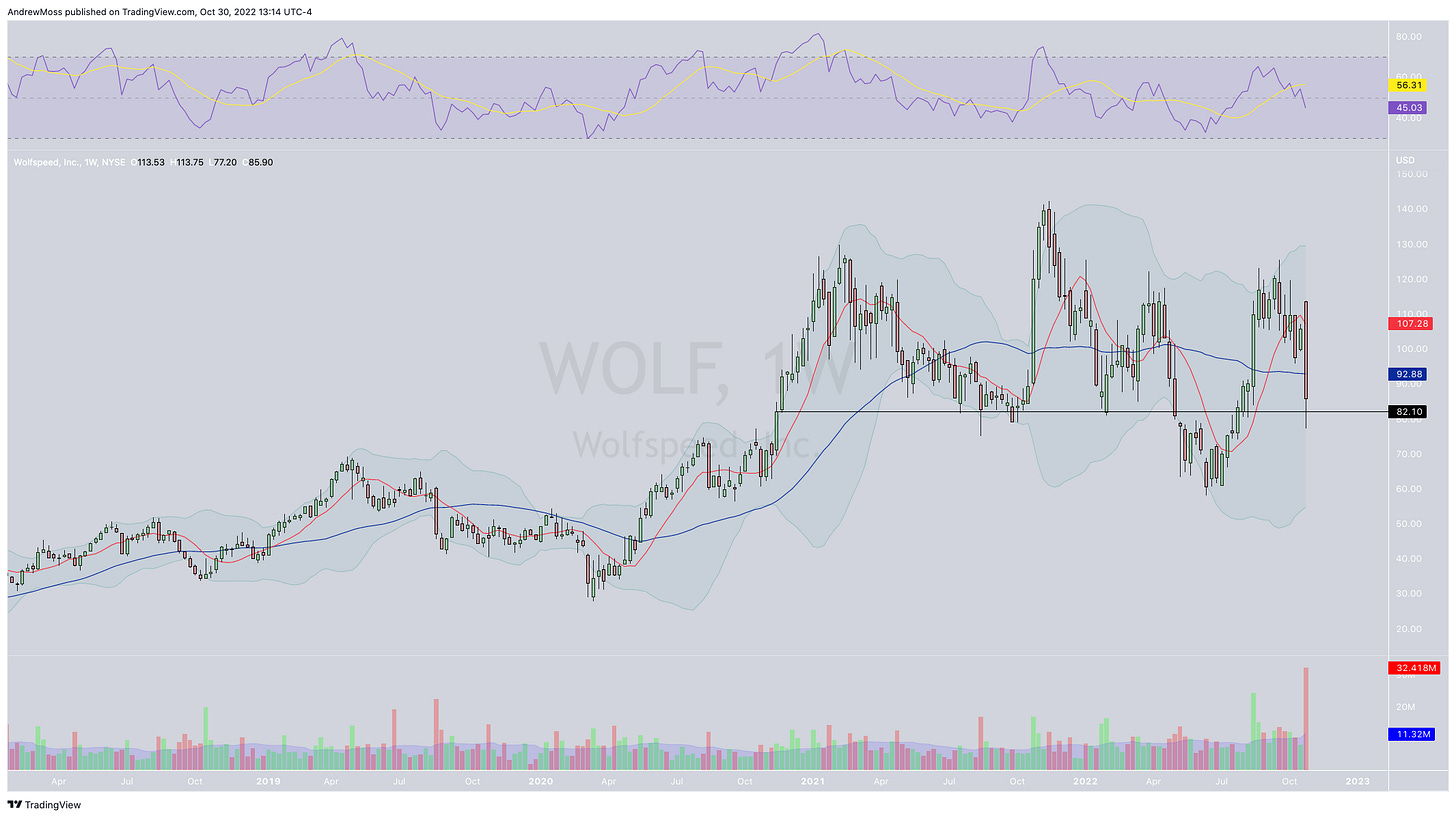
The ‘big-picture’ monthly view shows a chart that is sloppy. The 40-week moving average has rounded over and started descending. Opposite reactions to the two preceding earnings announcements have resulted in the stock price settling in the same area it first broke above in November 2020. That’s a whole lotta back and forth action without any lasting progress.
It’s also in the middle of the range, defined by the Bollinger Bands on this chart, which shows choppy, but overall flat price movement.
Finally, notice the huge red volume bar at the bottom. Lots and lots of stock was sold on that earnings news.
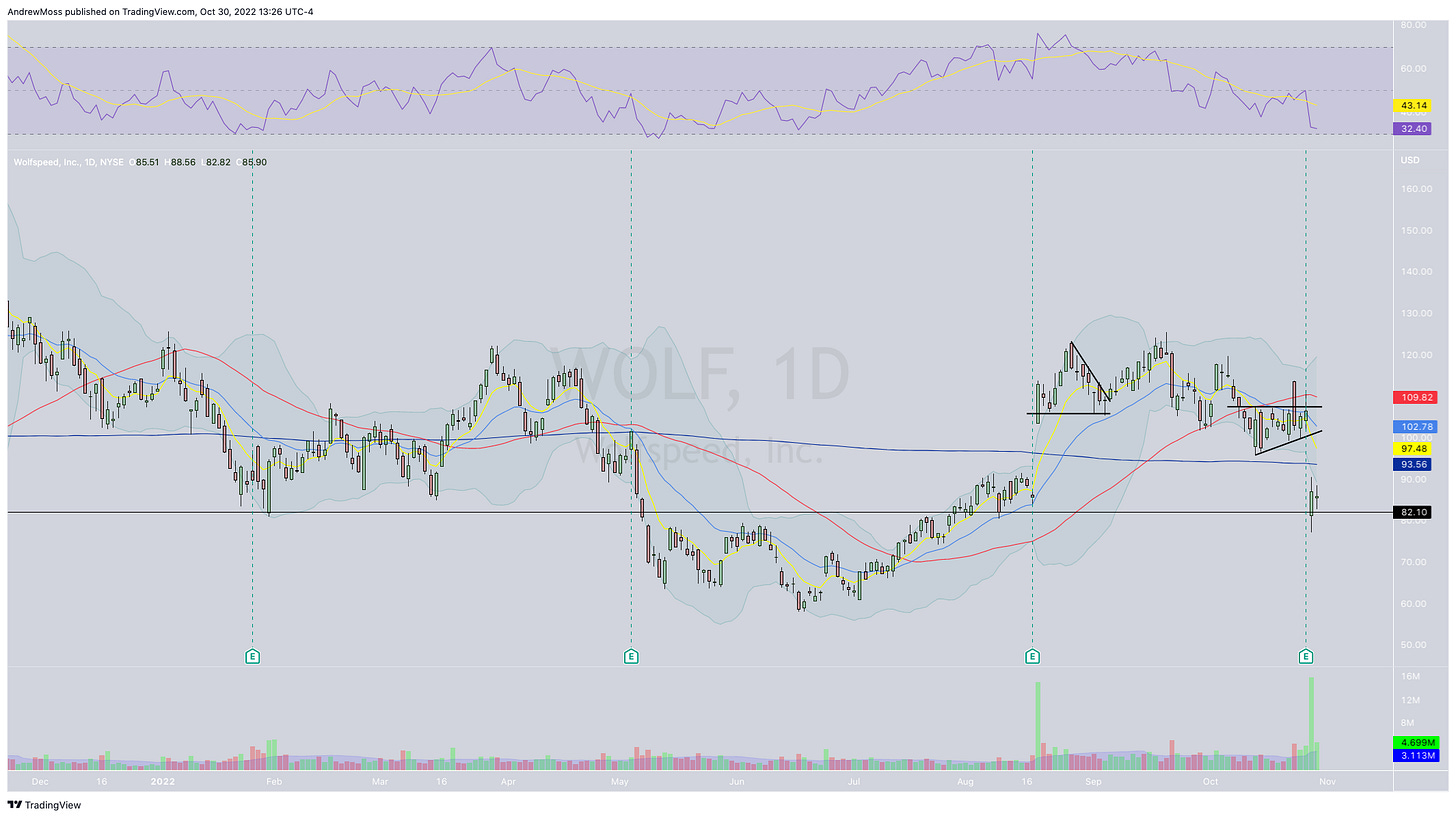
Moving into the daily chart barely shows any bullish possibilities either. One could argue that the $80 area has been support except for the period between the May and August 2022 earnings reports. Not very convincing though.
So is it a short?
Shorting at this level also looks dangerous. With so much selling volume and price well below the lower Bollinger Band and the 8 and 21-day moving averages it’s likely that this move will need some time to recollect. If it moves sideways and allows the 8/21 EMAs to move down to the price there could be a decent short setup emerge.
On the other hand, it looks like the bottom (at least on a very short-term basis) was in early Thursday morning and buyers kept moving the stock higher most of the day.
Taking it one last step further to the 65-minute chart we can see the type of moving average action described above. The 8-period EMA is down to the price and the 21-period isn’t too far behind. If you’re thinking about this stock as a long position you may be well-served to watch and see if it can continue higher and get back above both the 8 and 21-period EMAs on the short-term charts.
There is also a consolidation pattern building with a lid so far around $89-$90. Price getting above that level would be at least a minor bullish improvement and could open the door to further filling the earnings gap.
Patience would be best here, long or short.
***This is NOT financial advice. NOT a recommendation to buy, sell, or trade any security. The content presented here is intended for educational purposes only.
Andrew Moss is an associated member of T3 Trading Group, LLC (“T3TG”) a SEC registered broker/dealer and member of FINRA/SIPC. All trades placed by Mr. Moss are done through T3TG.
Statements in this article represent the opinions of that person only and do not necessarily reflect the opinions of T3TG or any other person associated with T3TG.
It is possible that Mr. Moss may hold an investment position (or may be contemplating holding an investment position) that is inconsistent with the information provided or the opinion being expressed. This may reflect the financial or other circumstances of the individual or it may reflect some other consideration. Readers of this article should take this into account when evaluating the information provided or the opinions being expressed.
All investments are subject to risk of loss, which you should consider in making any investment decisions. Readers of this article should consult with their financial advisors, attorneys, accountants or other qualified investors prior to making any investment decision.
POSITION DISCLOSURE
Long: ADBE, CVX, DRI, MCK, MRO, MSFT, QQQ, SOXL
AMD 1118C65
Short: AMD 1118C80
Options symbols are denoted as follows:
Ticker, Date, Call/Put, Strike Price
Example: VXX1218C30 = VXX 12/18 Call with a $30 strike


