

Flush. Hold. Rebound.
SPY breaks short-term trend, but anchored support attracts dip buyers.


The Markets
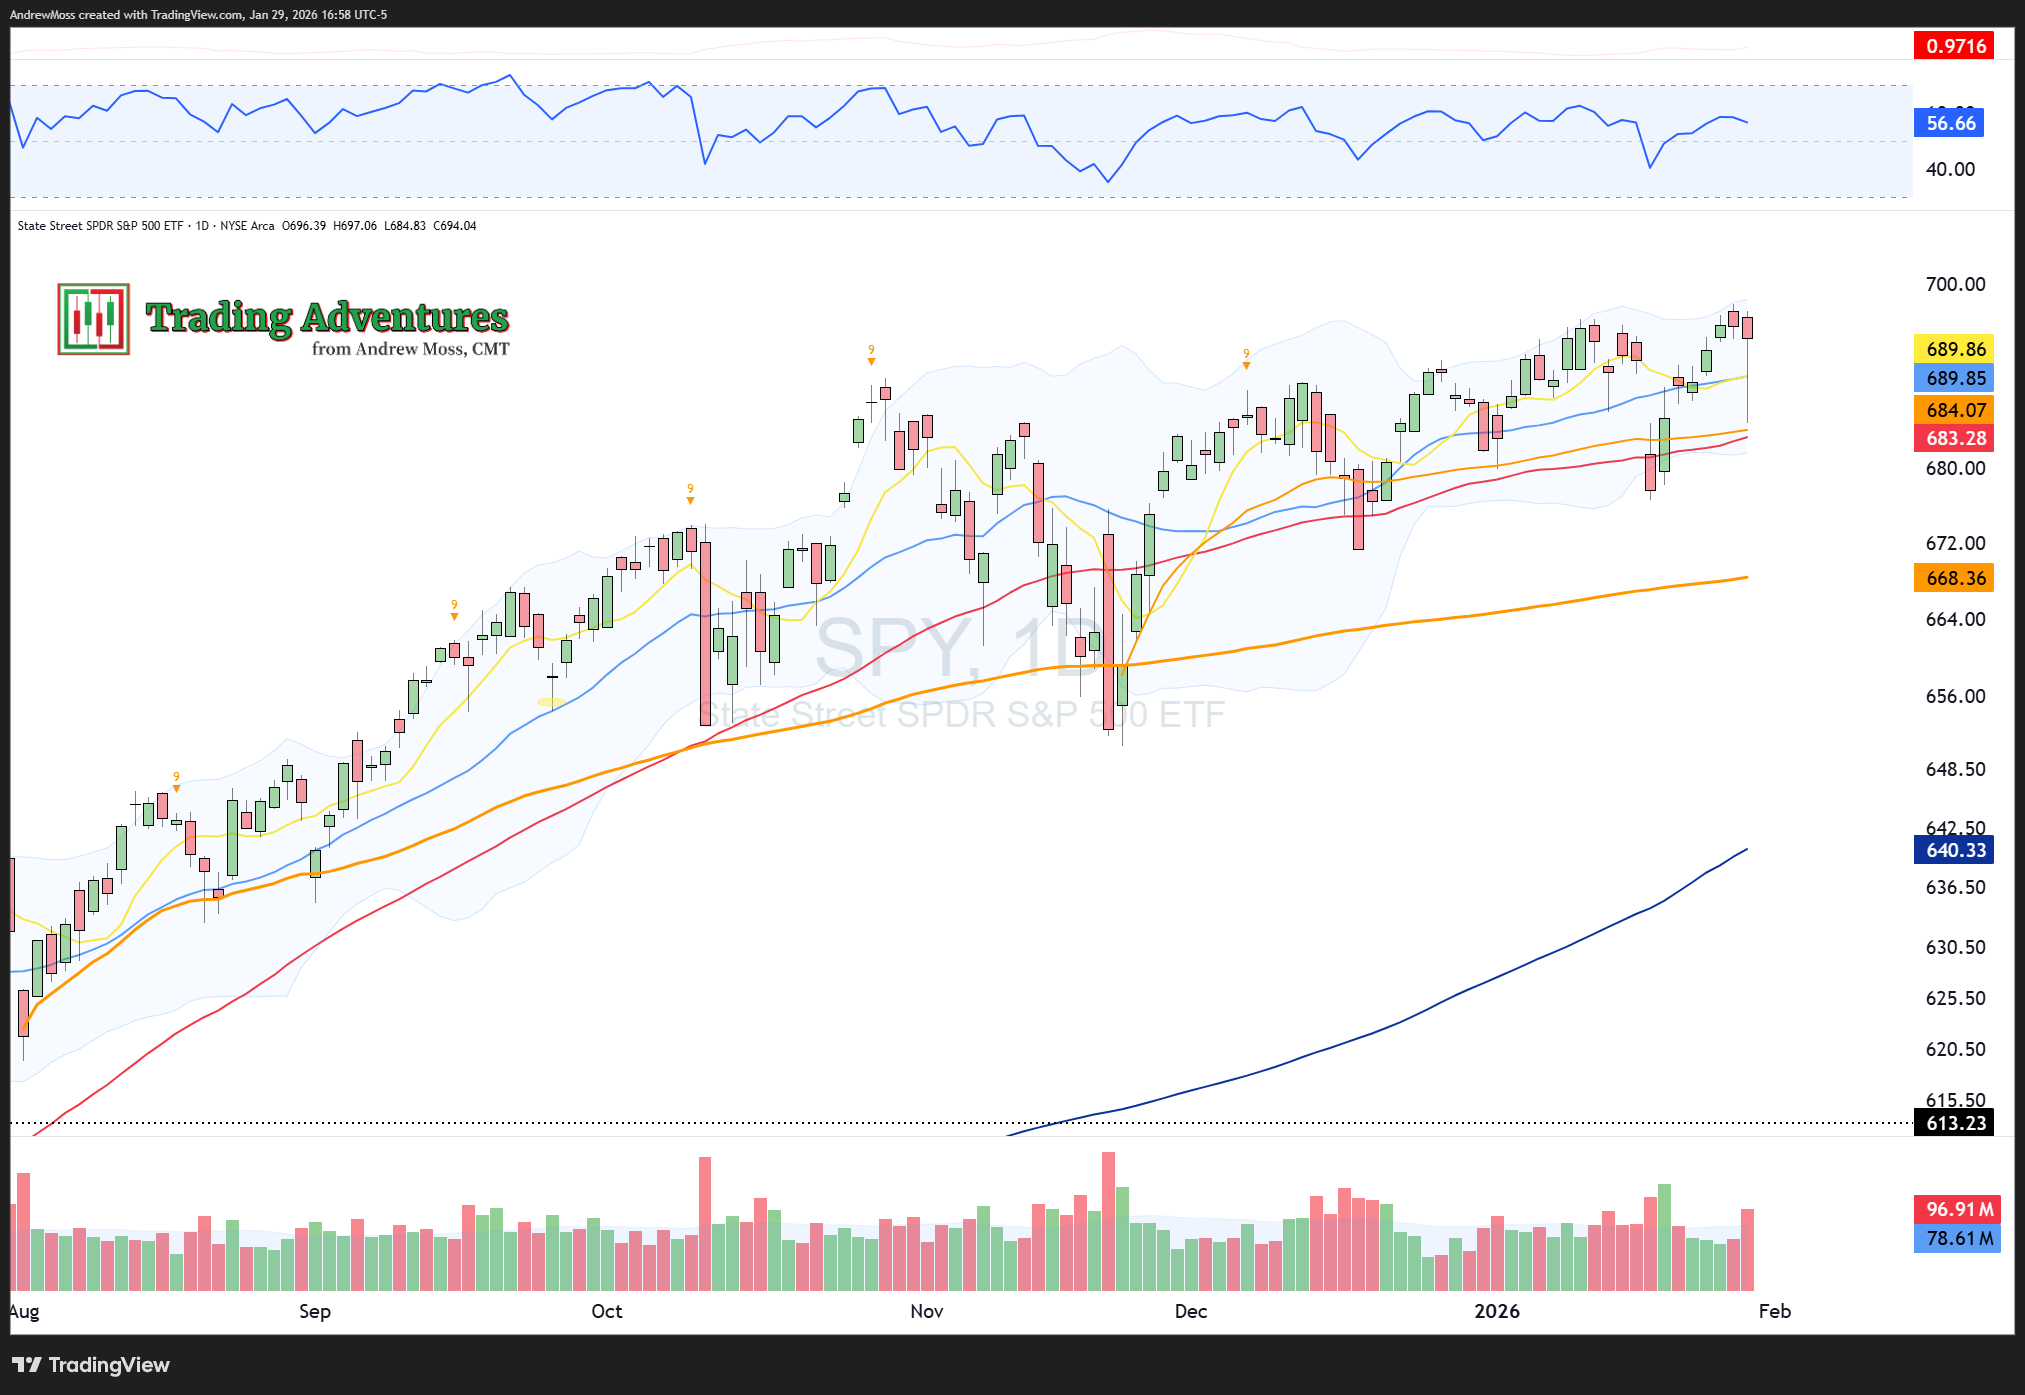
Tuesday’s update focused on internal strength: improving breadth, a rising MAGS/SPY ratio, a weakening dollar, and strong momentum in precious metals. SPY made new highs, and under the surface, the market was firming.
Today’s session tested that strength.
SPY opened at 696.39 and dropped sharply to 684.83 — slicing below the 8-day and 21-day moving averages, nearly tagging the 50-day and the anchored VWAP from the 11/21 low. That early move broke the pattern of higher highs and higher lows and set a new short-term low.
But it didn’t hold.
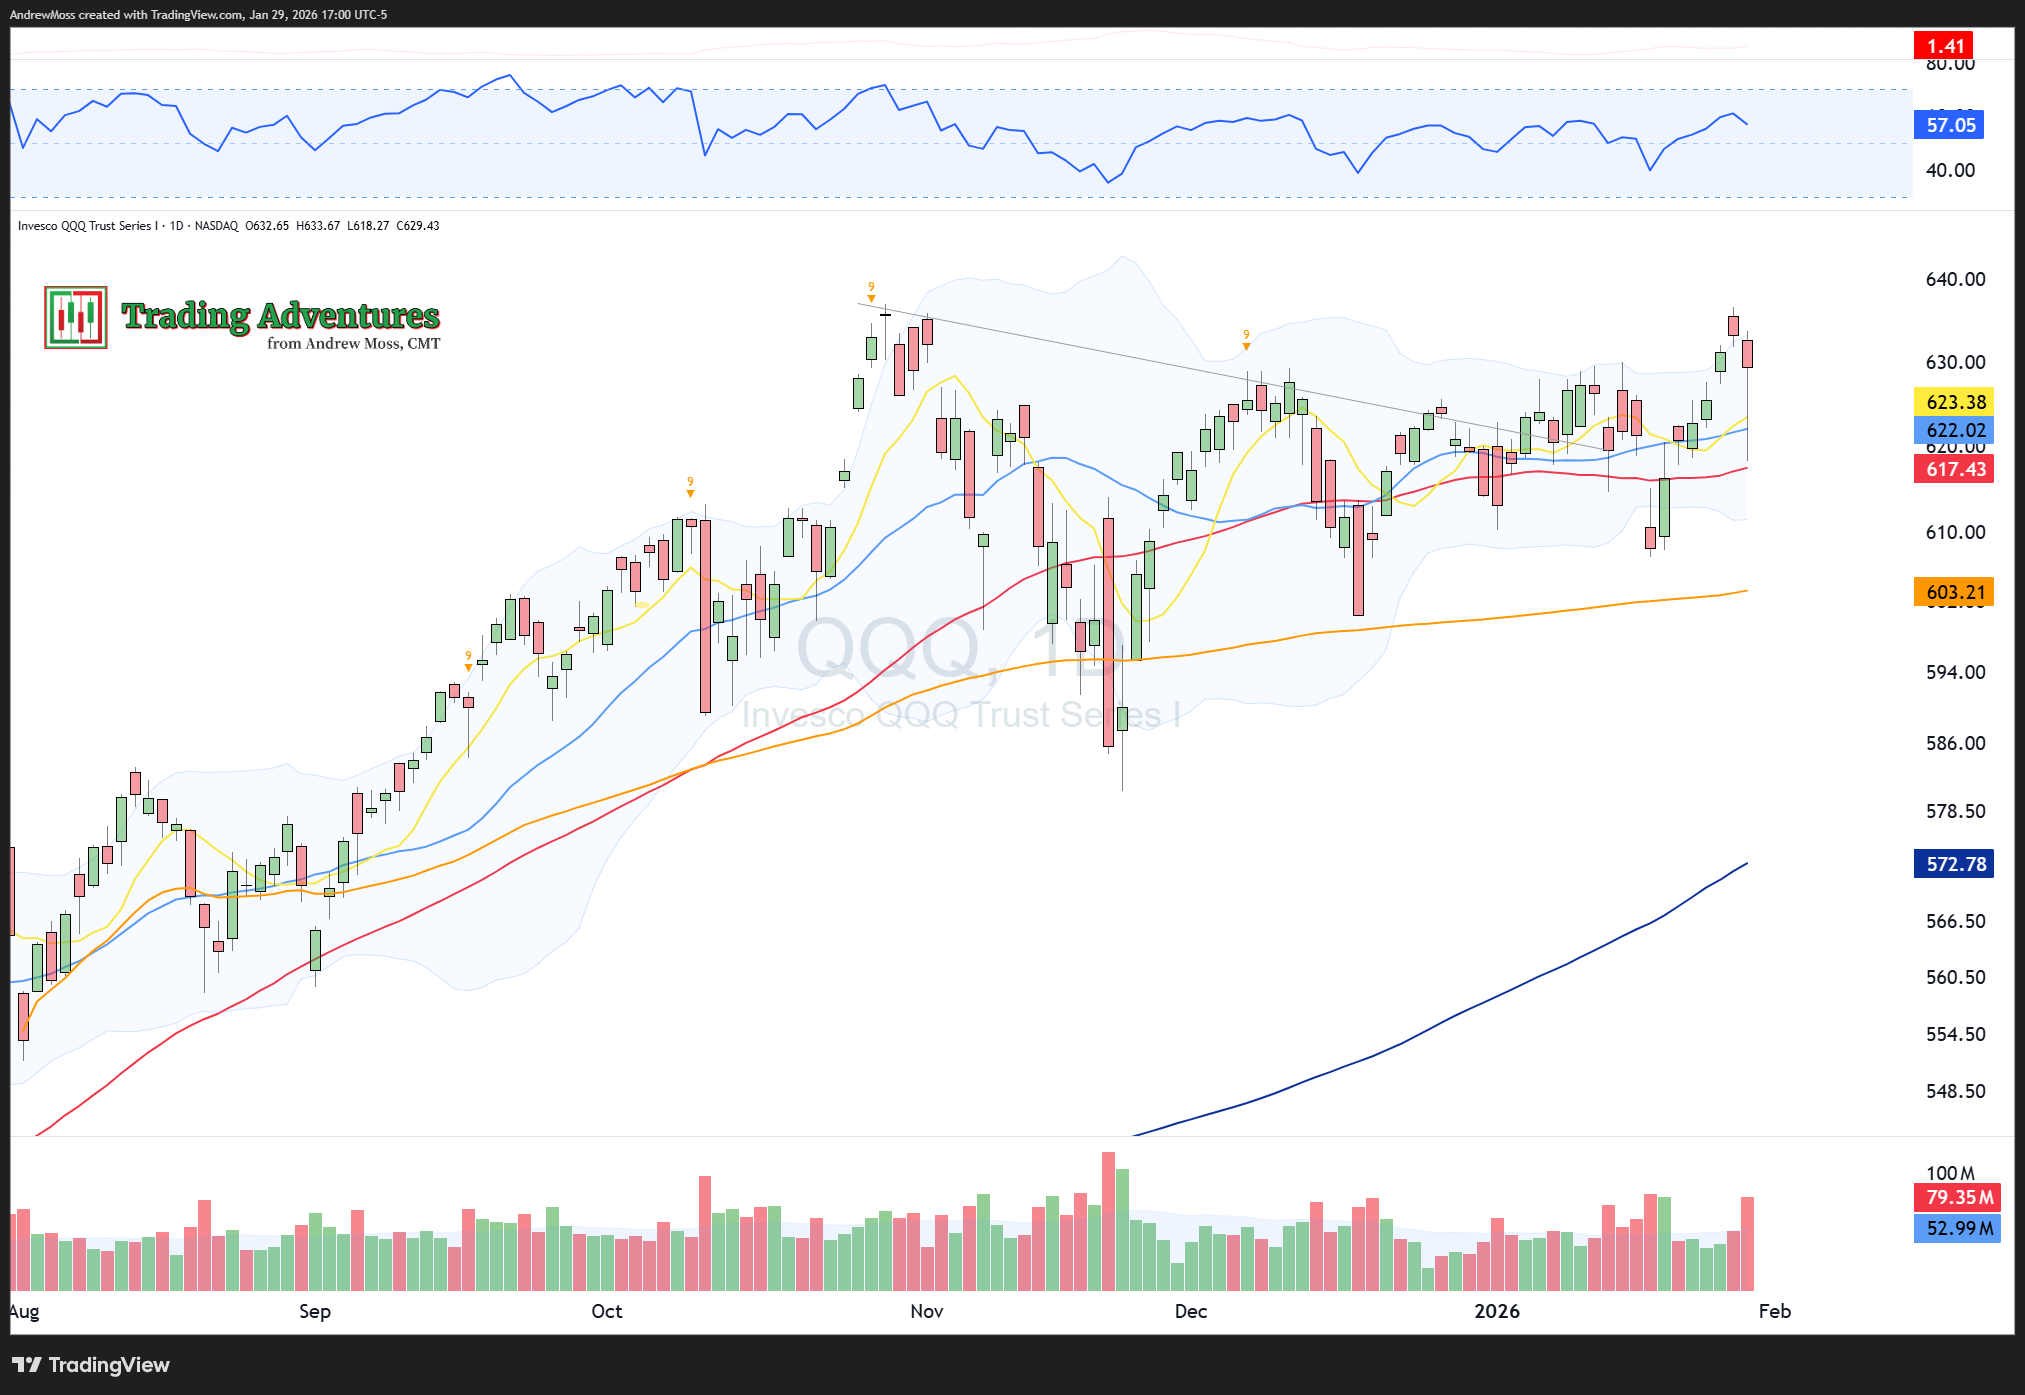
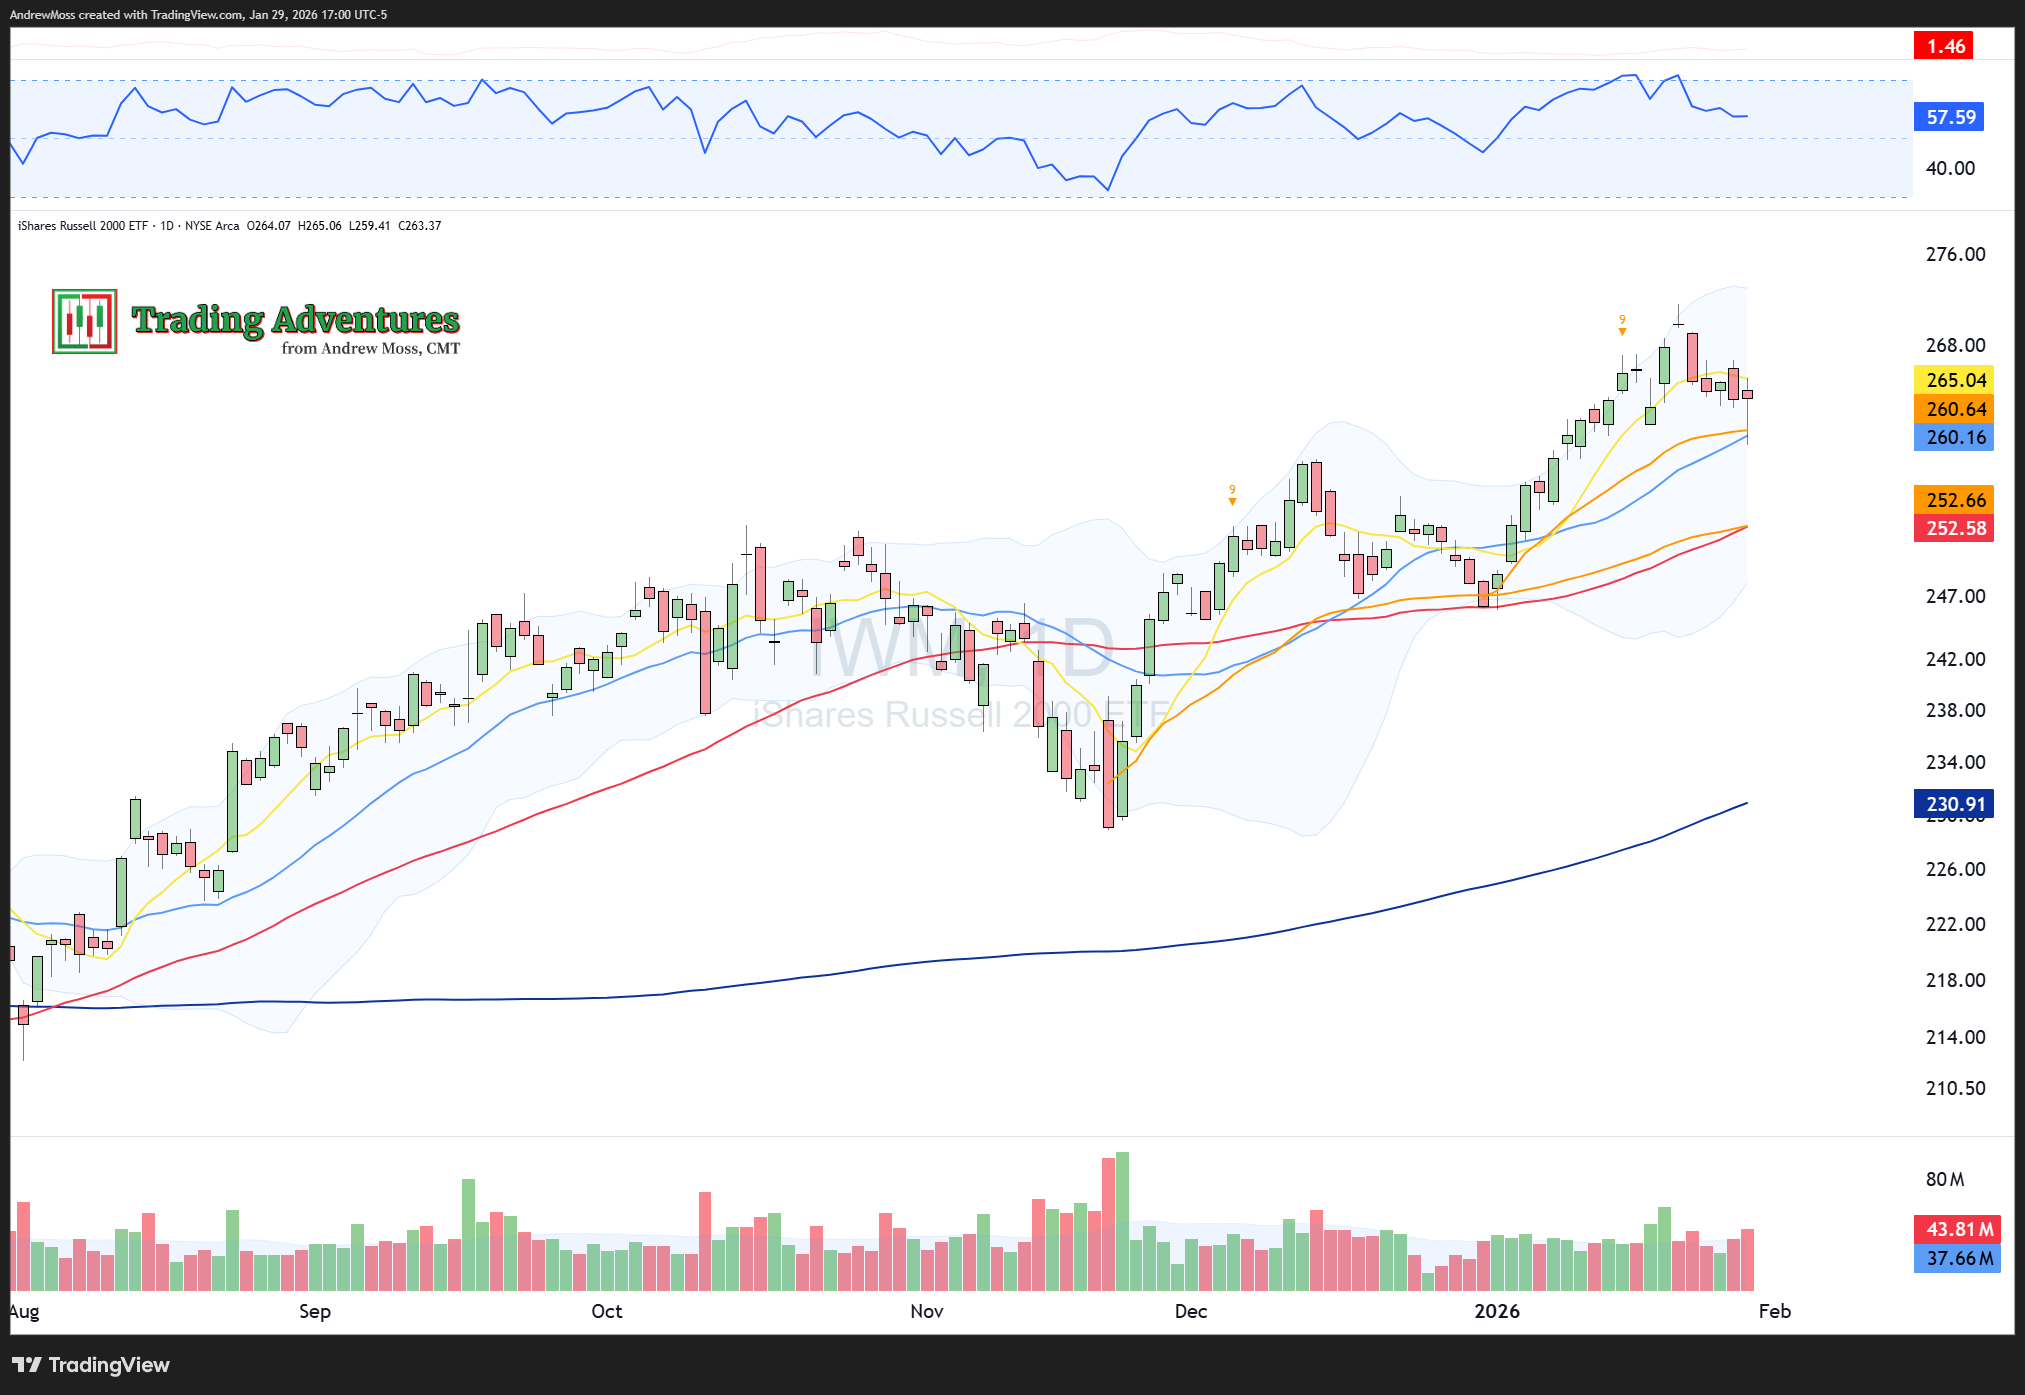
Buyers stepped in decisively. The market recovered quickly, with IWM and DIA closing green. SPY trimmed losses to just -0.25%, and QQQ ended down -0.60%. The downside wasn’t erased — but it was countered.
The Charts
Across indices, we saw long lower shadows — evidence of buyer defense at key levels.
SPY and QQQ both lost and then recovered the week-to-date anchored VWAPs and 5-day moving average zones, reducing the prior extension and resetting short-term risk.
The 5-day moving averages are flattening. Structure is mixed. We now have a lower low, but no confirmation of a breakdown.
For bullish structure to reassert, we need to see a higher high > higher low > higher high sequence develop.
Internals remain supportive, but the roadmap demands patience and clarity.
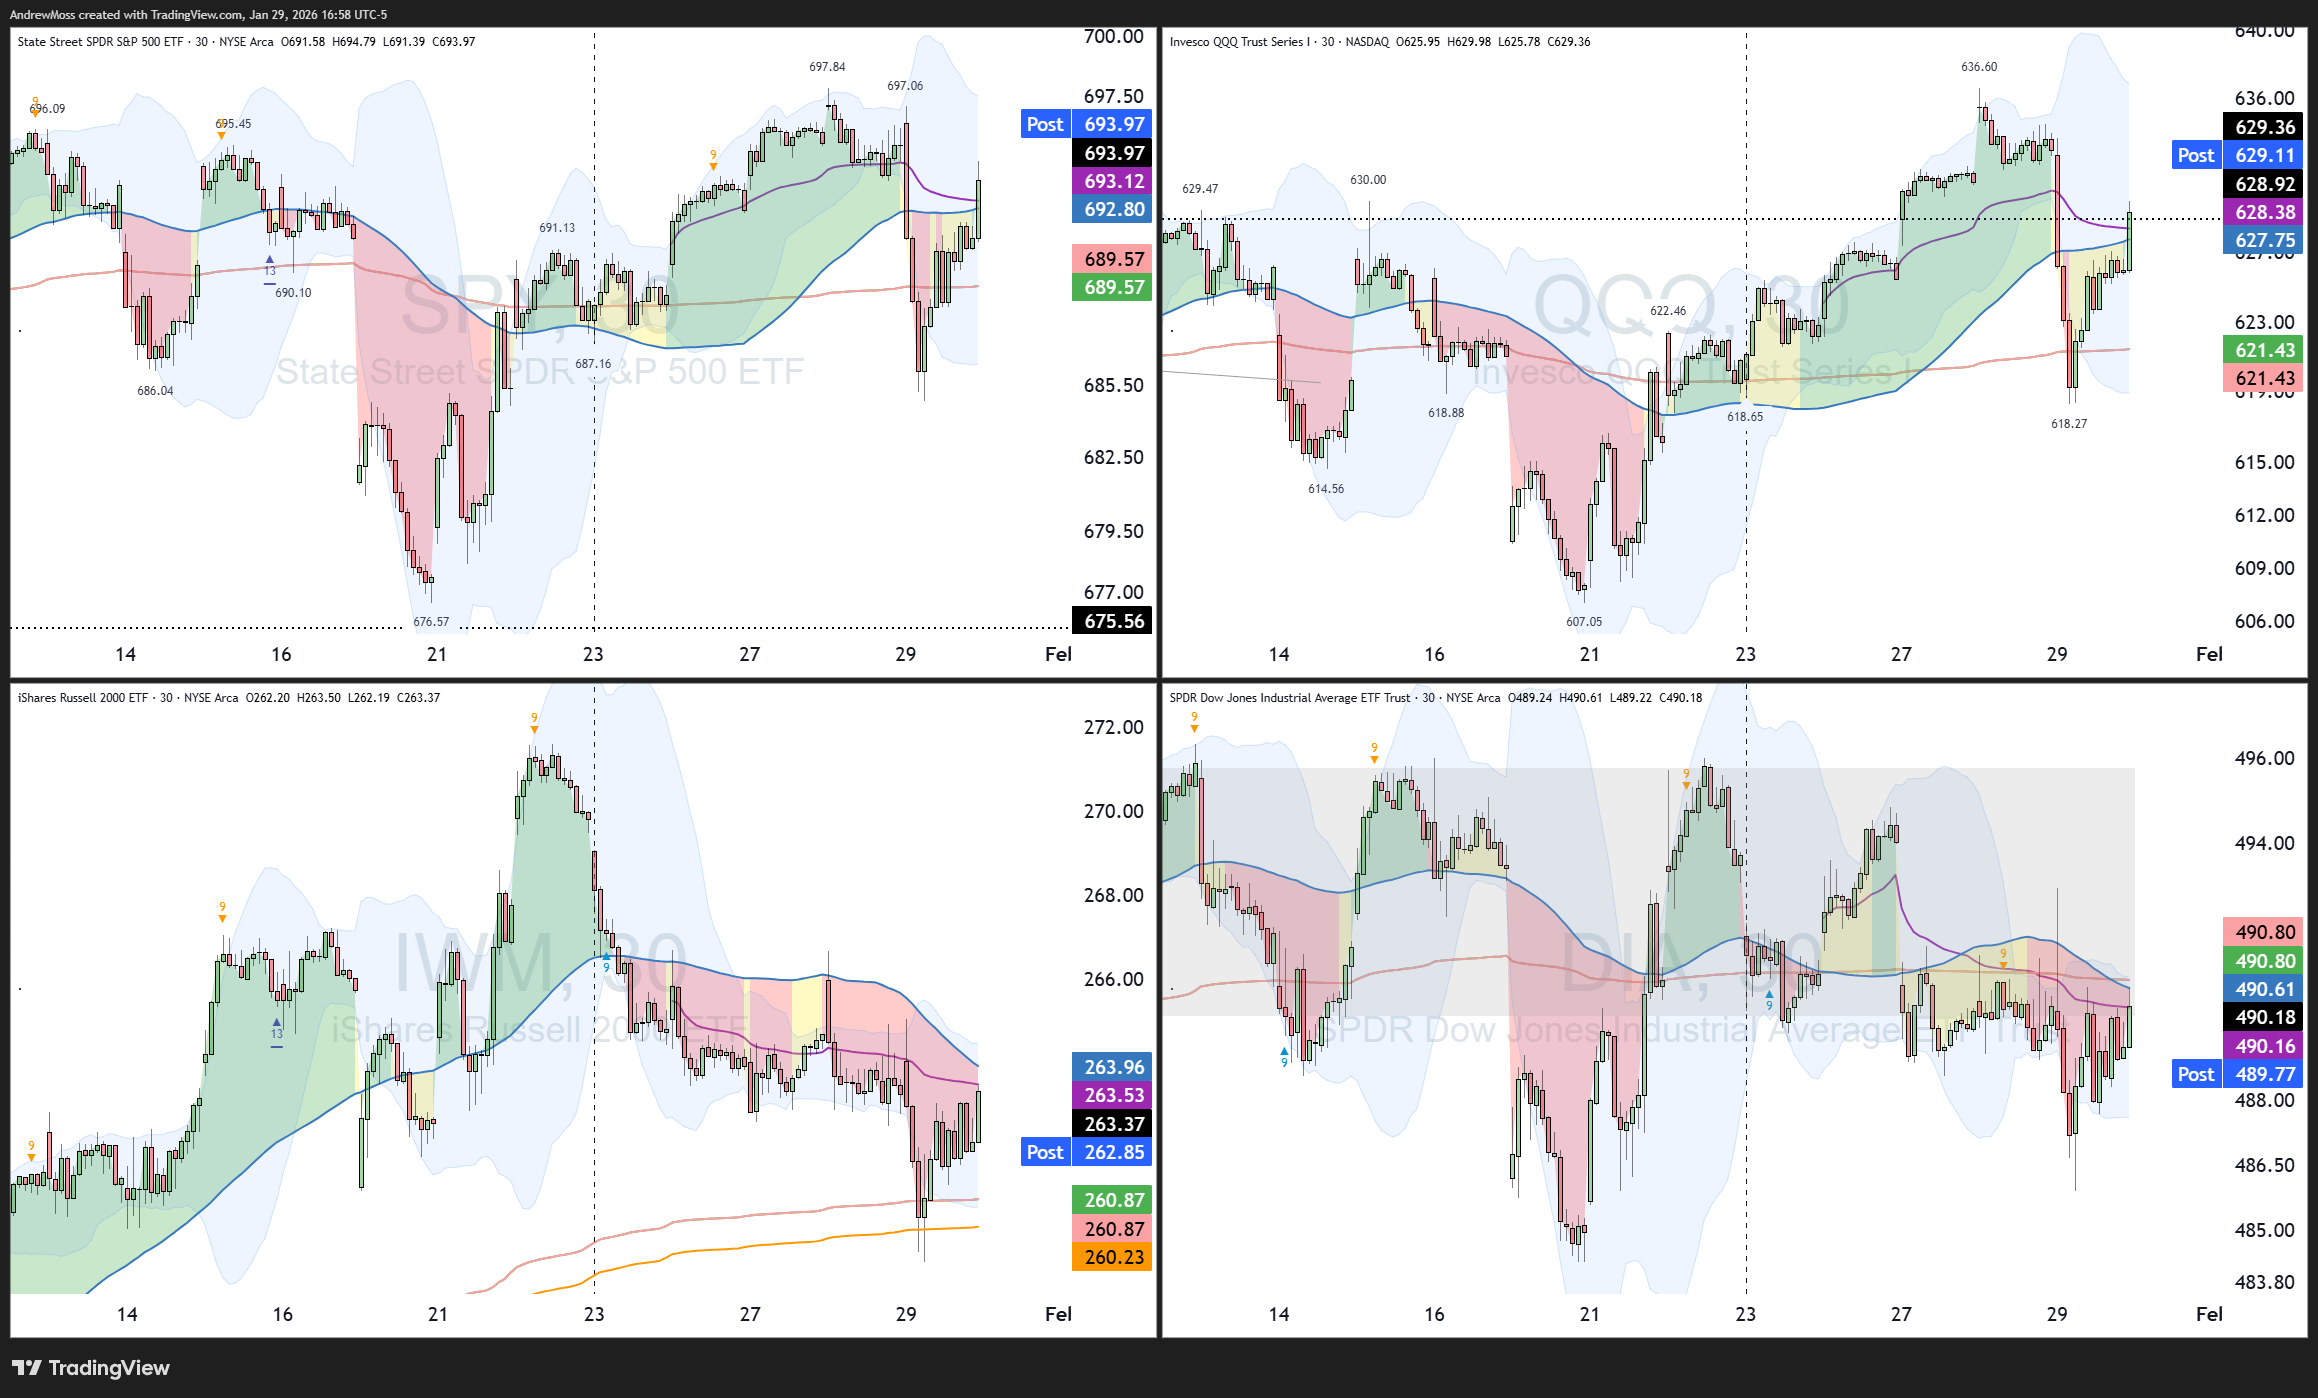
SPY printed an exceptionally long lower shadow lower shadow on today’s candle, illustrating the dip buyers’ resounding efforts. Price nearly touched the 50-day MA and Nov. 21 anchored VWAP before support was established. The 8-day MA is above the 21-day MA (by a penny) keeping the intermediate trend in place.
QQQ with similar action—a potentially beneficial reset just in front of new highs.
IWM was slightly positive on the day, printing a potential hammer that touches the 21-day MA and recent AVWAP. Could this mark the end of a six-day consolidation — and the start of a move to new highs?
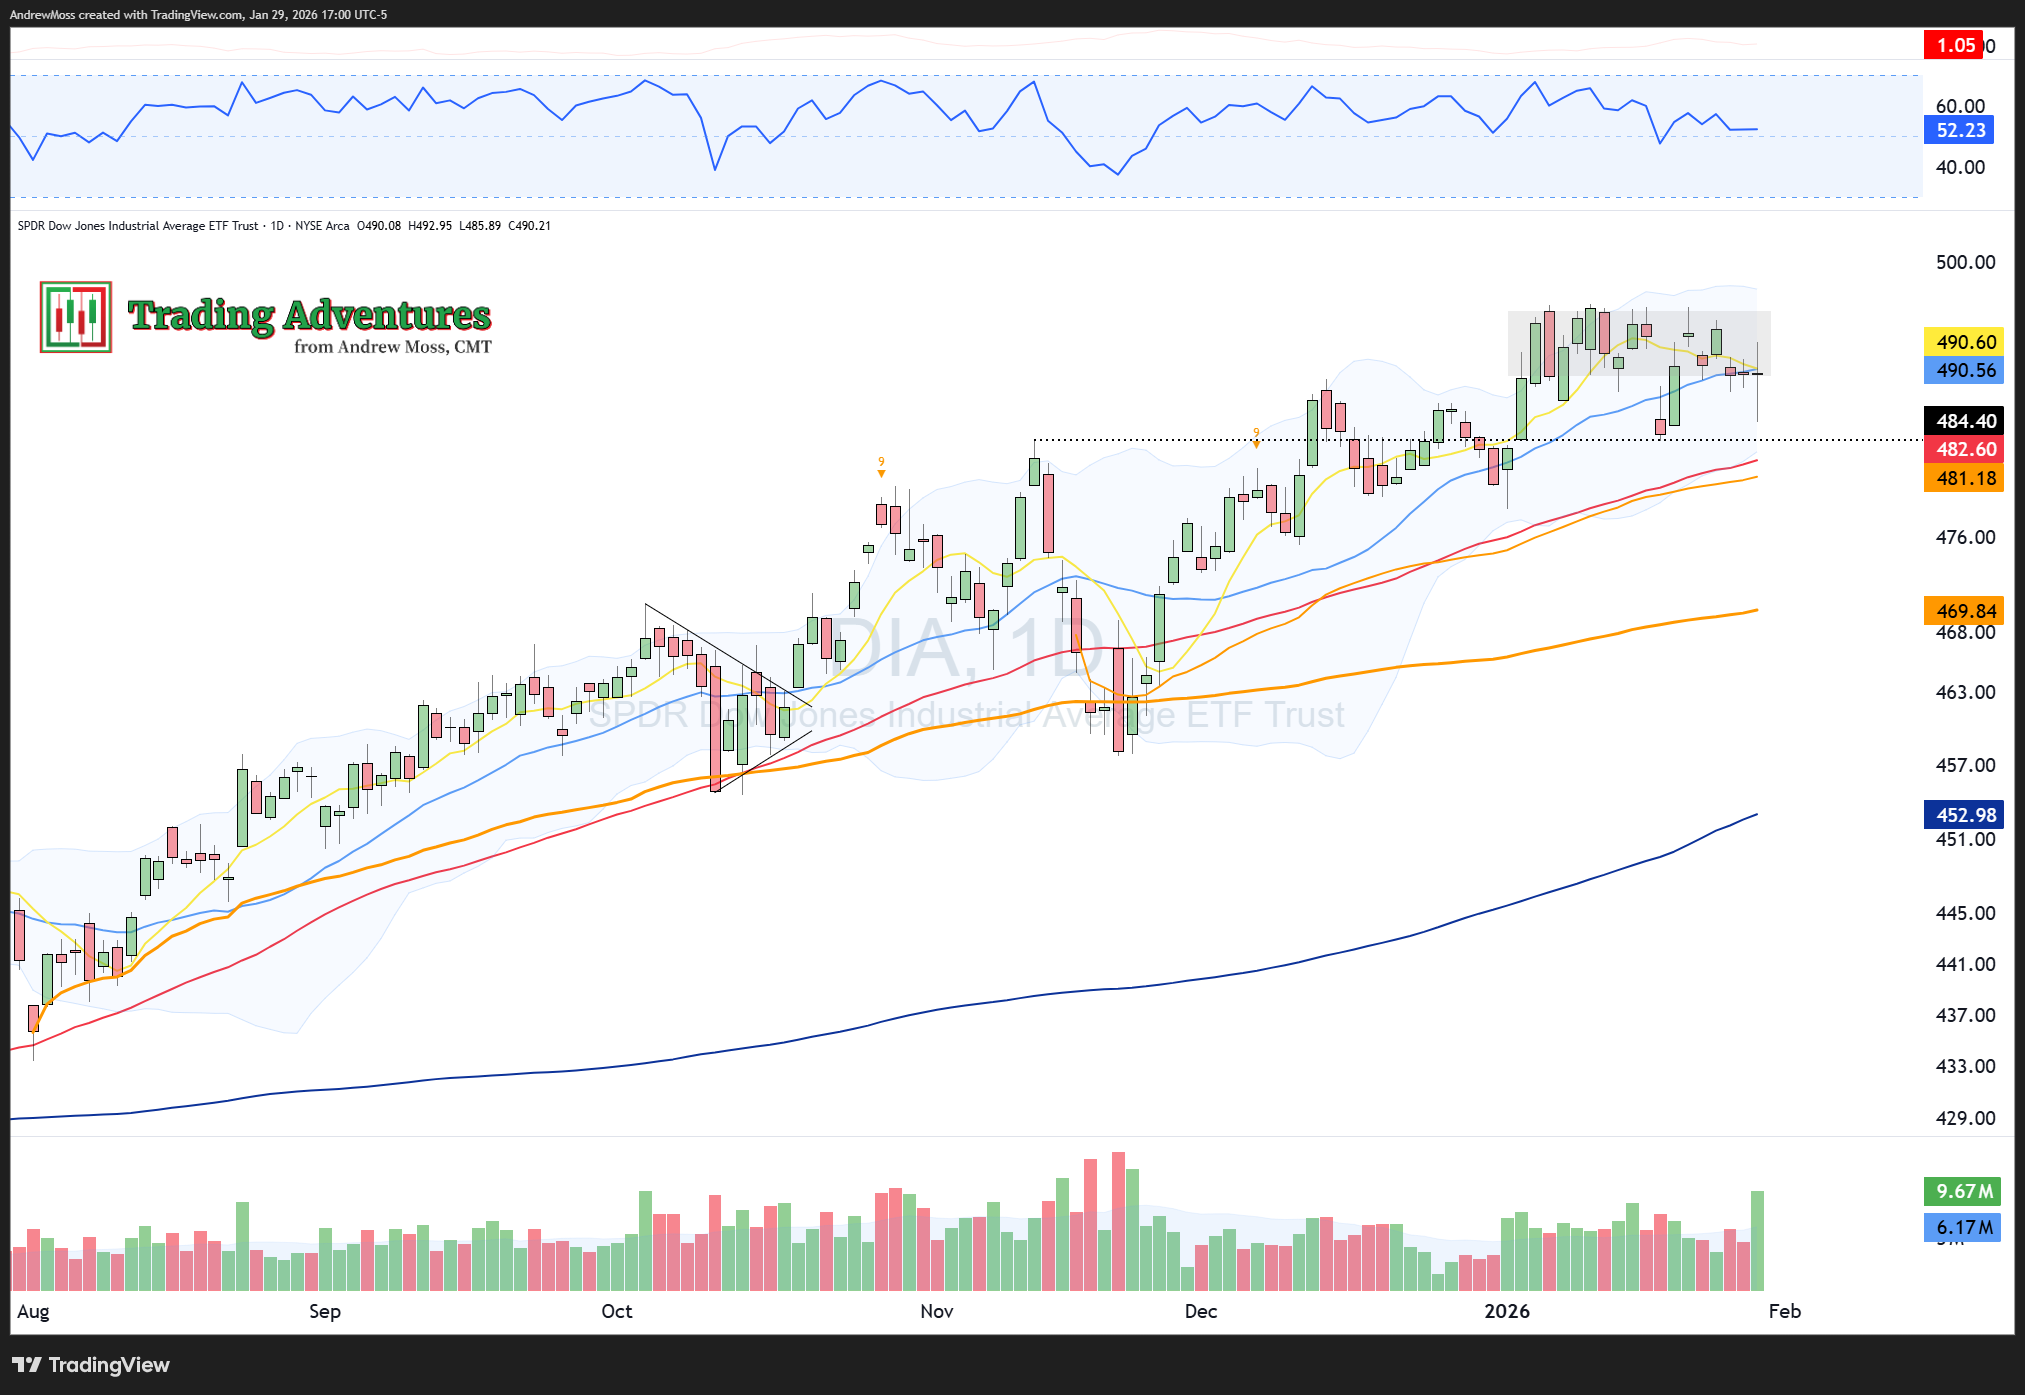
DIA continues testing the limits of the gray-shaded sideways range. It’s worth noting that this was day three beneath the 8 and 21-day MAs, potentially with a downside crossover looming.
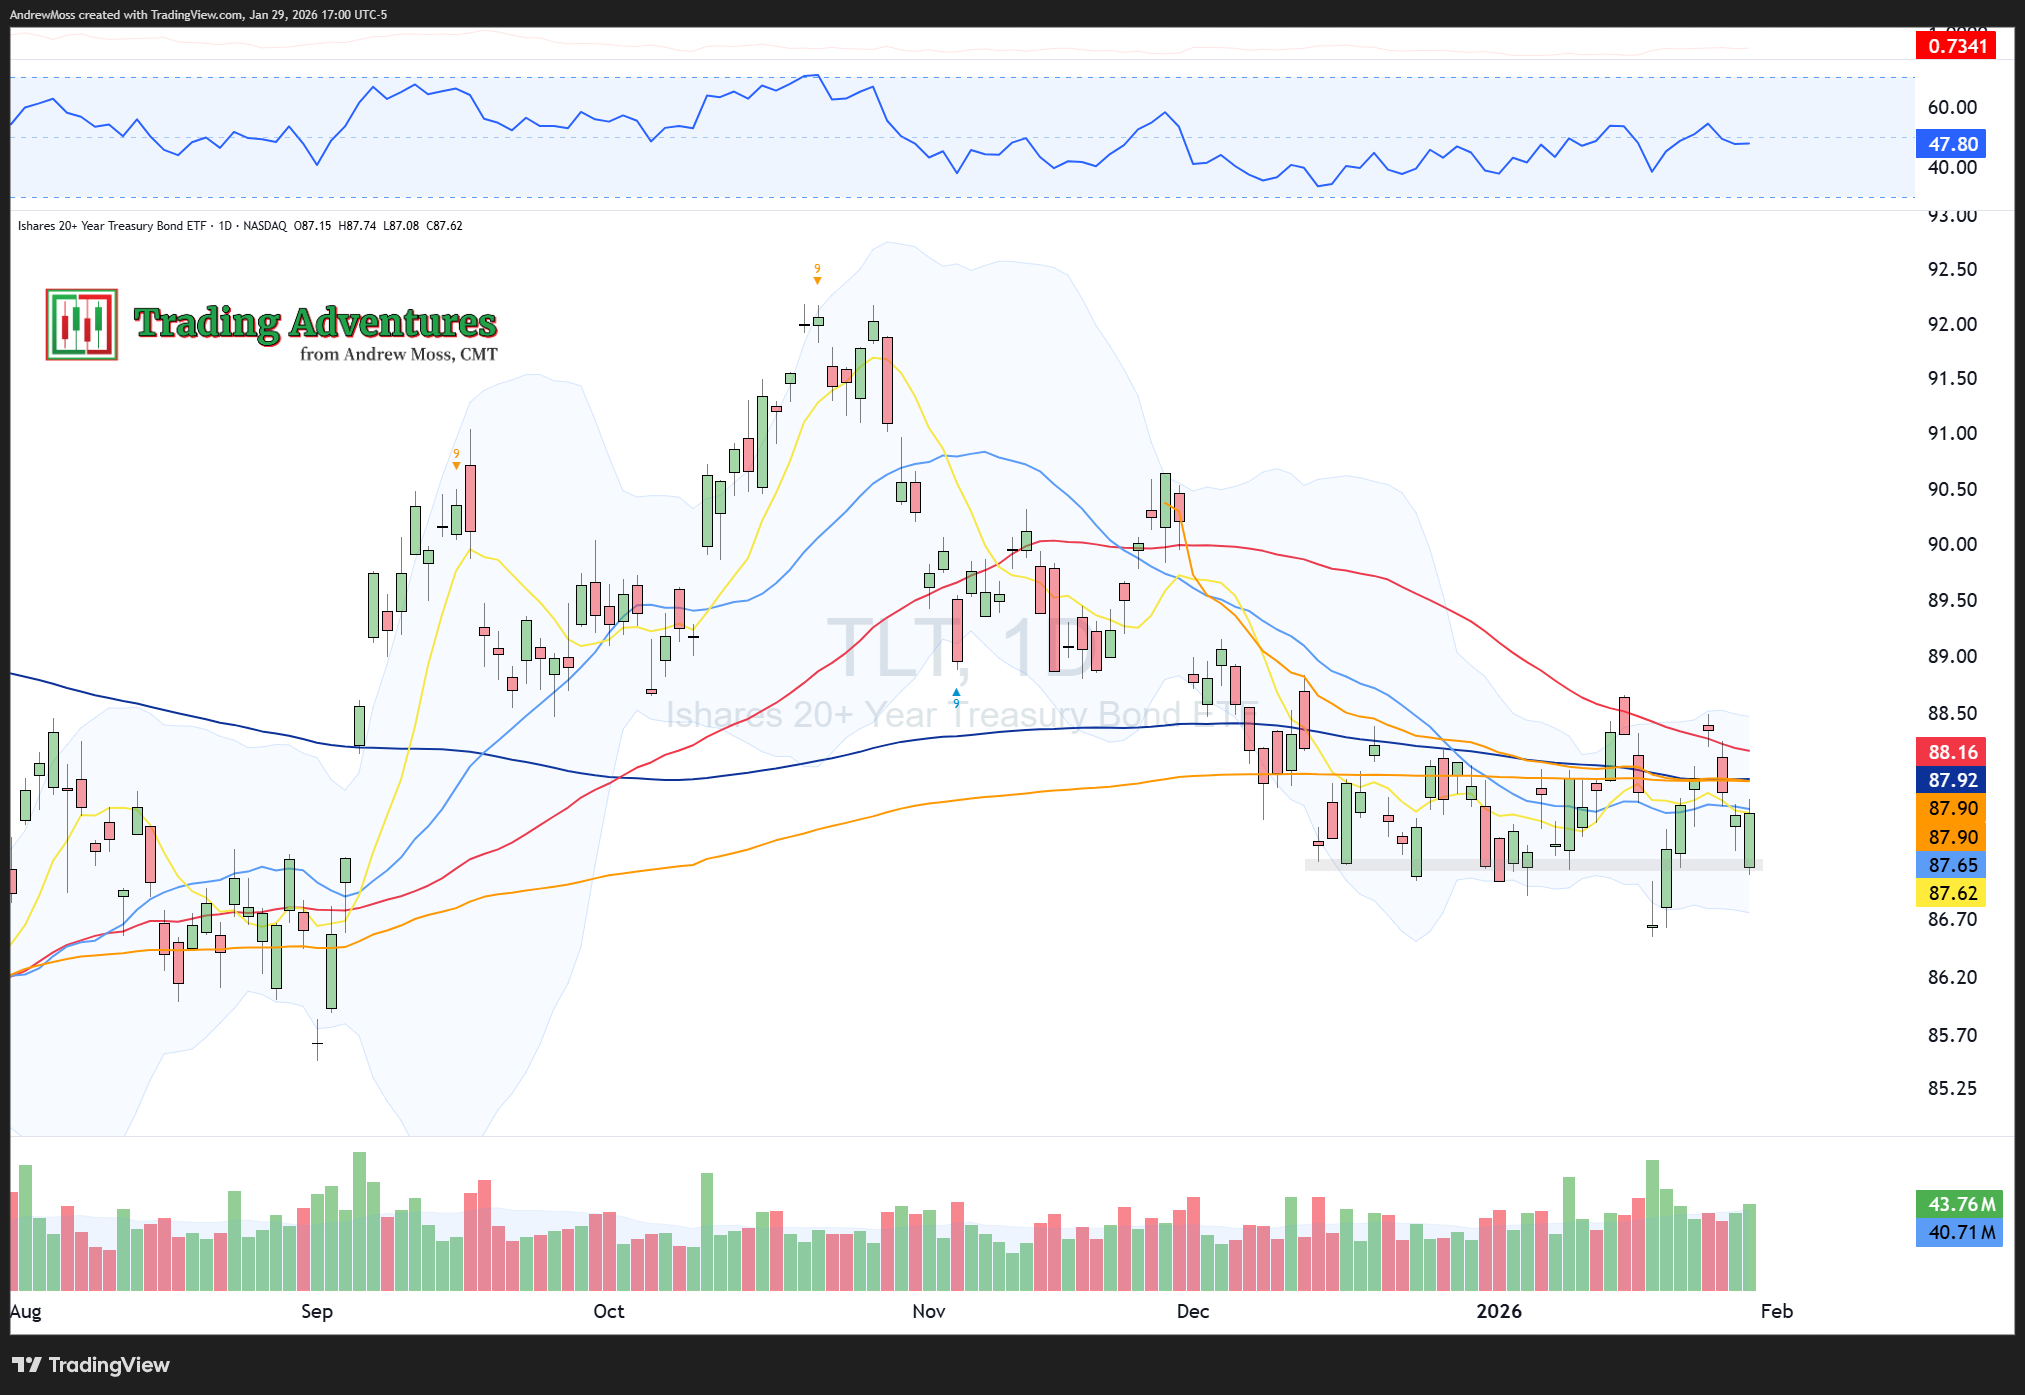
TLT remains stuck. Further consolidation in a downtrend.
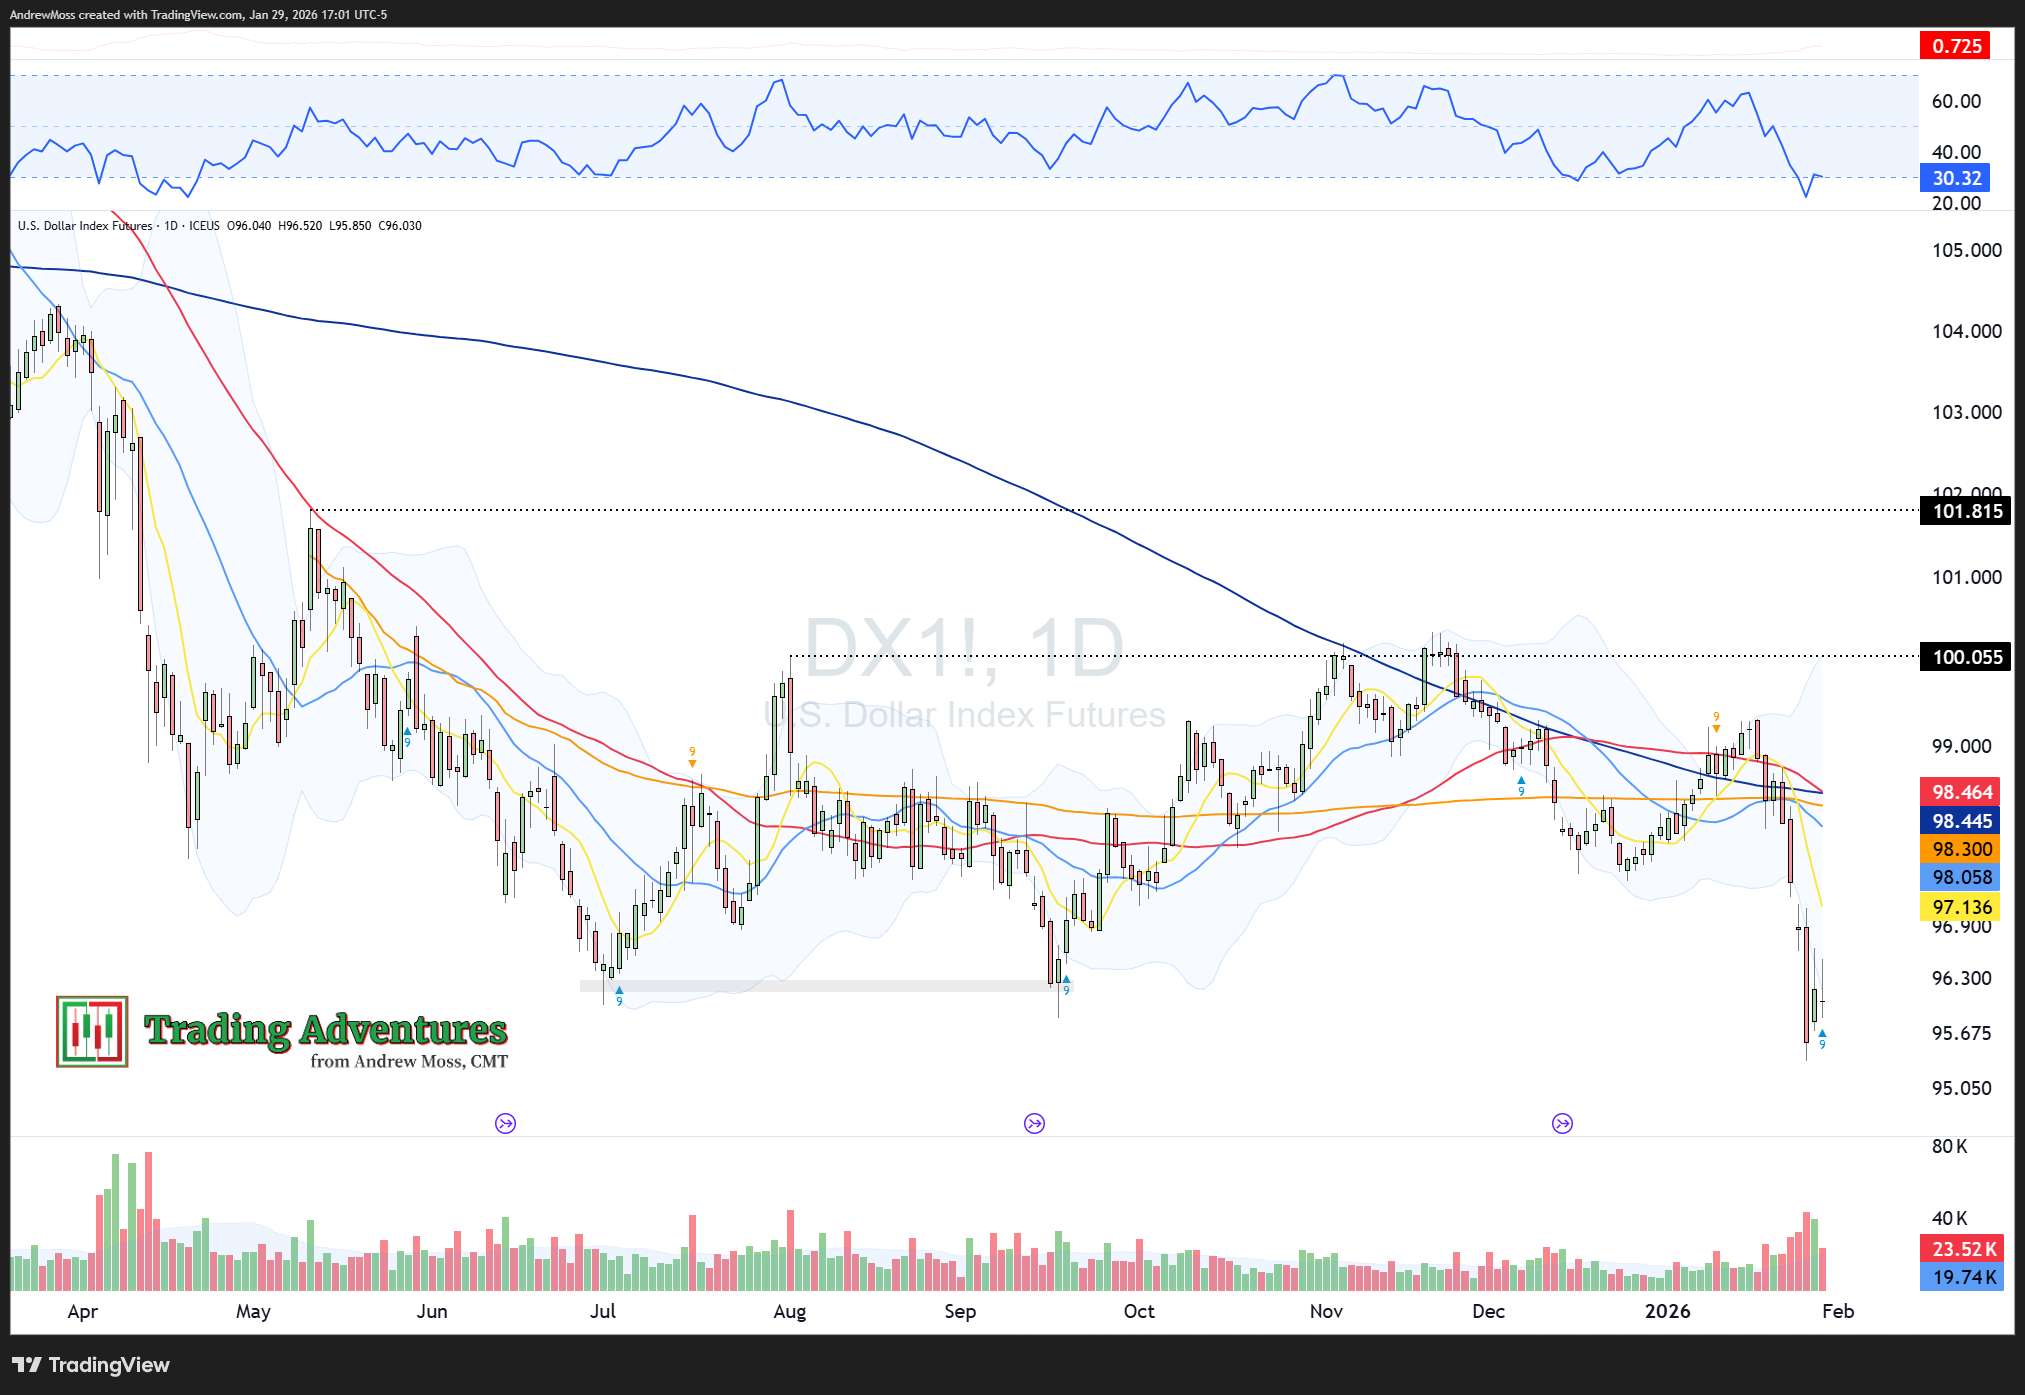
DXY is trying to stabilize, but no signs of recovery yet.
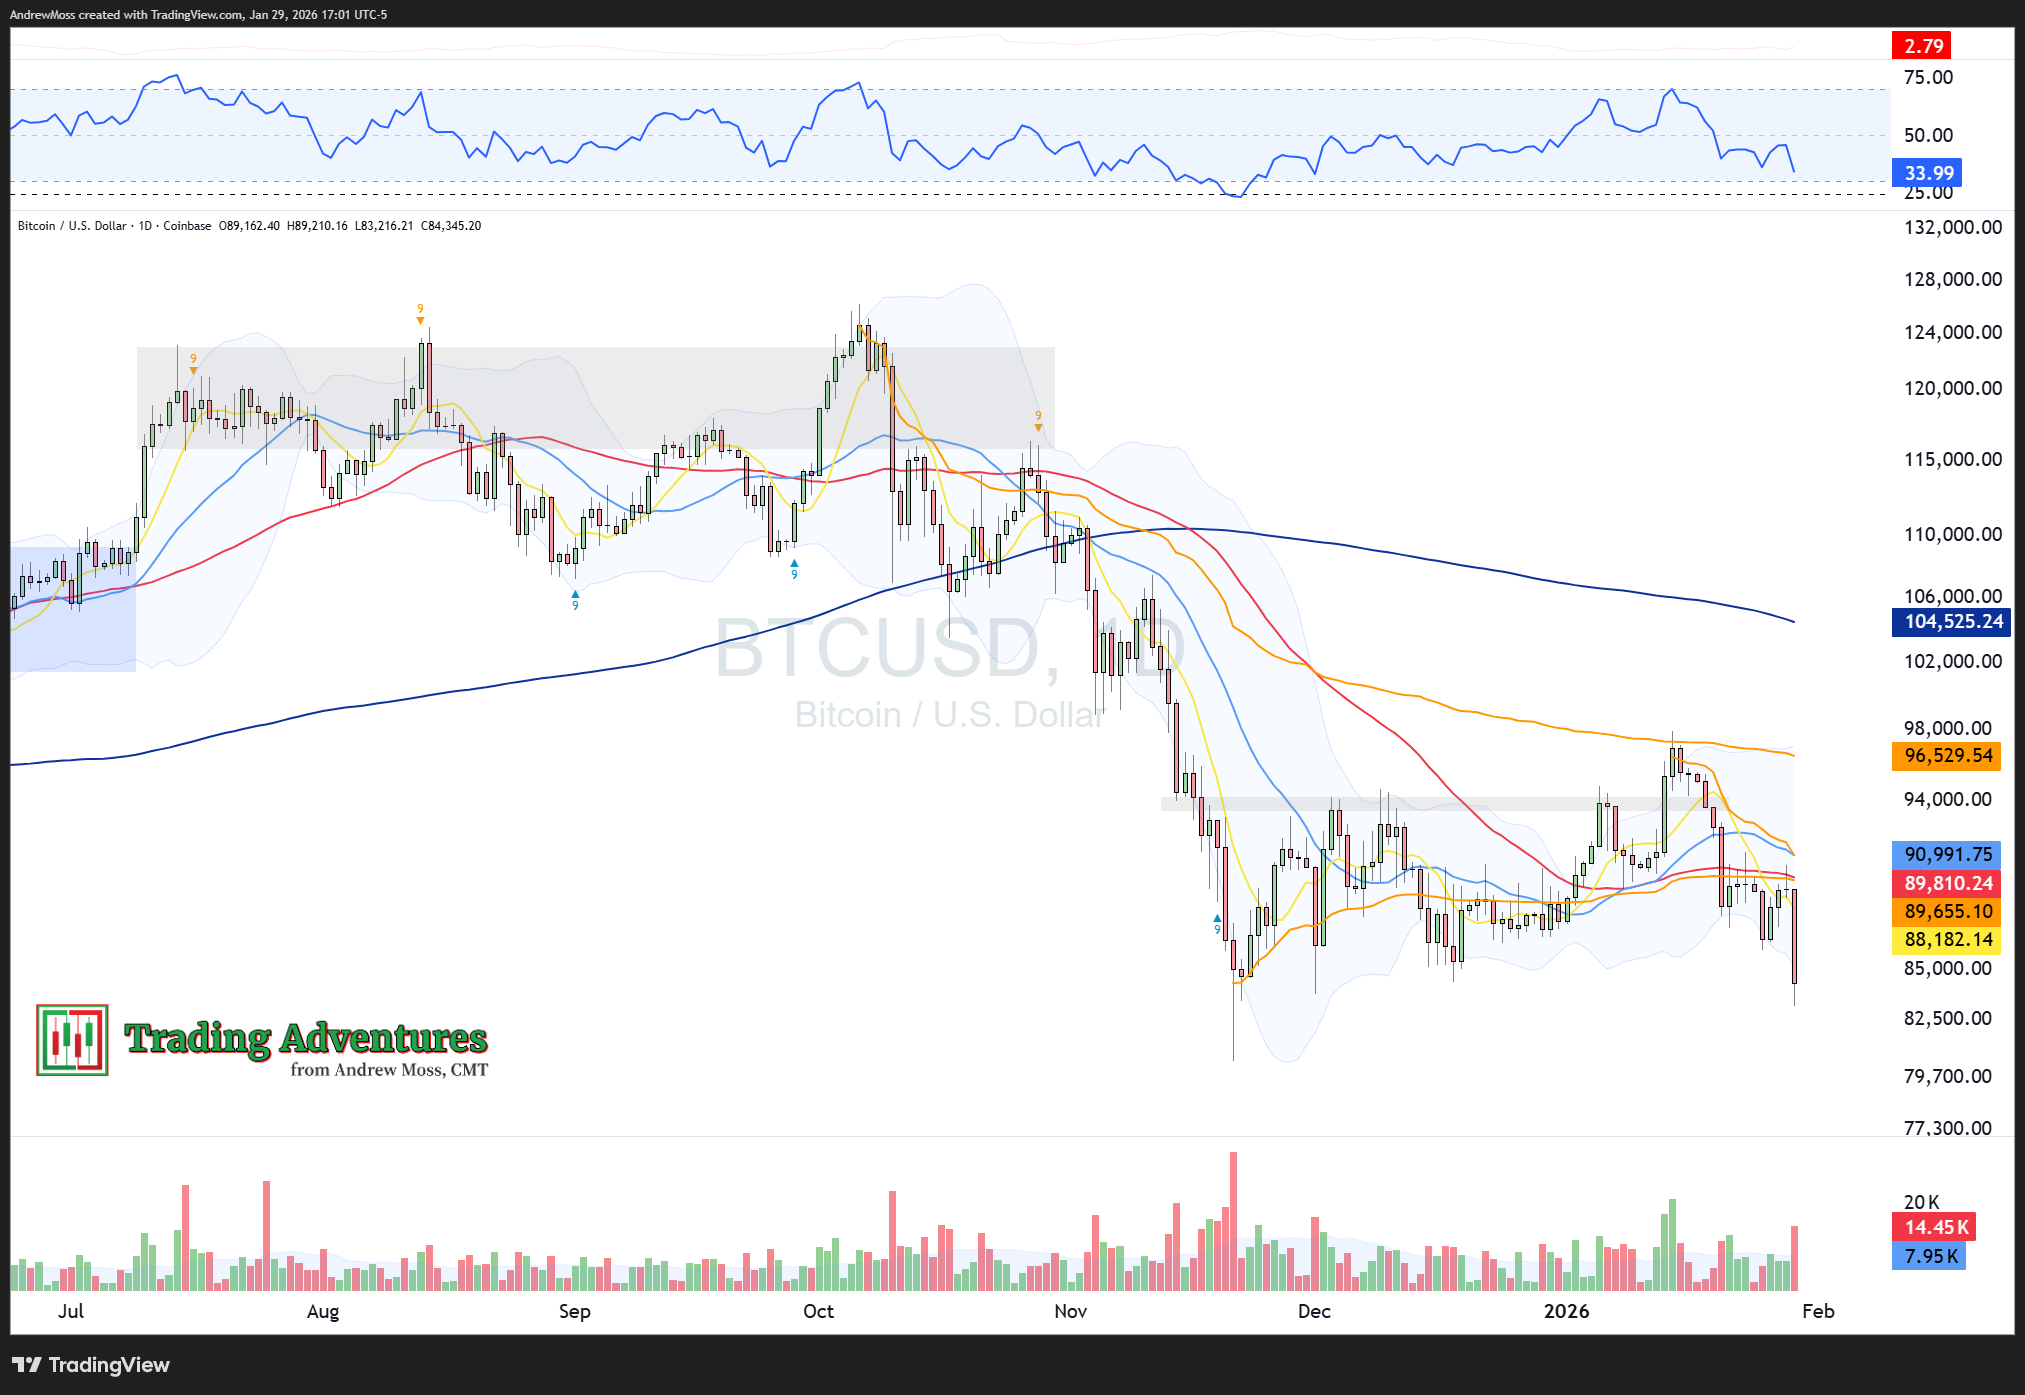
BTCUSD is having another day of persistent selling. Downside continuation.
The Trade
For now, we’re between levels. The sharp recovery suggests buyers are still present — but without a new higher high, this remains a bounce within potential transition.
Respect the flattening 5-day. Let price confirm direction.
Only price pays.
If you like how I think here, this is where that thinking is applied every day.

Important: This content is provided for educational purposes only. If you’re reading this online, please review the full disclosure here.
Brilliant read on how support held when it really mattered. The detail about those long lower shadows capturing teh buyer defense is spot-on, especially seeing how price tested that November VWAP and bounced. I watched this same pattern play out back in '22 where the intial breakdown looked scary but the bounce happenned fast once institutional buyers showed up.