Hammer It Out
Monday Market Update December 4, 2023
Special Announcement!
If you haven’t viewed the Weekly Chart thread, you can see them here.
Checking these every weekend is a good habit. It’s very helpful to know the condition of the larger timeframes before zooming into the daily (or smaller) charts.
The Markets
The leaders take a break.
All of the M7 stocks are below their 8-day MAs. Many other mega caps are as well.
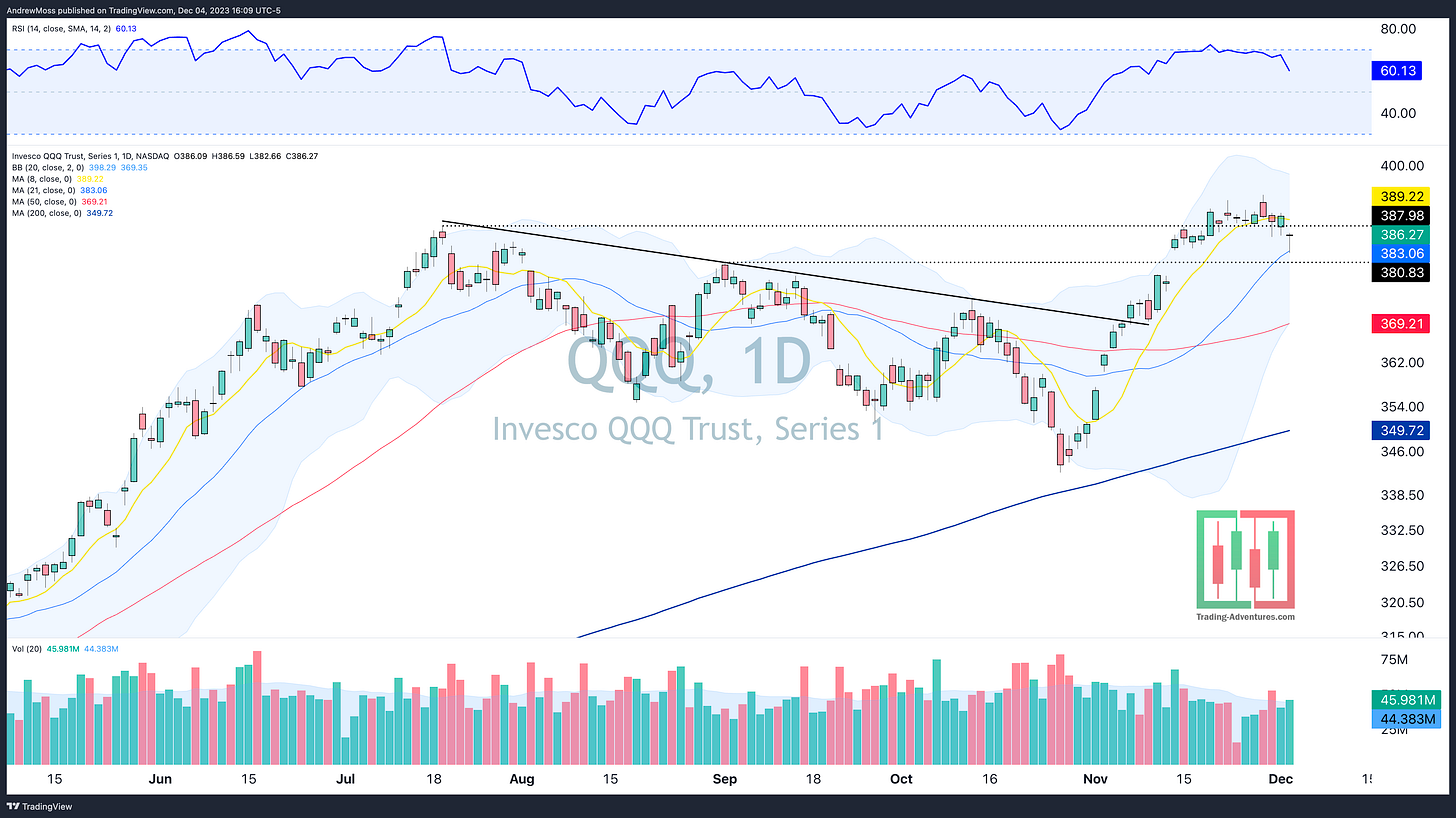
QQQ finally touched the 21-day MA.
Meanwhile, small caps continue to rip higher.
Now that the leaders have been able to rest, they look more attractive to performance chasers, closet indexers, and other buyers with excess cash to employ.
AAPL, AMZN, GOOGL, META, MSFT, and NVDA all printed hammer (or similar) candles today as buyers stepped into the morning dip—a potential reversal pattern.
If these patterns are confirmed tomorrow, we will likely see another move higher across those leading stocks. And while that is happening, the recent rotational leaders (small caps, biotechs, banks, financials, etc) may take a rest.
Let’s go to the charts.
The Charts
click to enlarge
SPY is down slightly relative to Friday’s close. But the overall action is still flat above the 8-day MA. The bullish consolidation continues.
QQQ puts in a hammer on the 21-day MA. Watch for confirmation tomorrow.
IWM continues higher as the RSI approaches 70. Reaching overbought status and staying there (one of the most bullish things a stock can do) is not something small caps have been able to do for quite a long time. Will it be different now?
DIA inside day above the breakout level. More bullish consolidation.
TLT also has an inside day above the pivot level breakout and in the support/resistance zone.
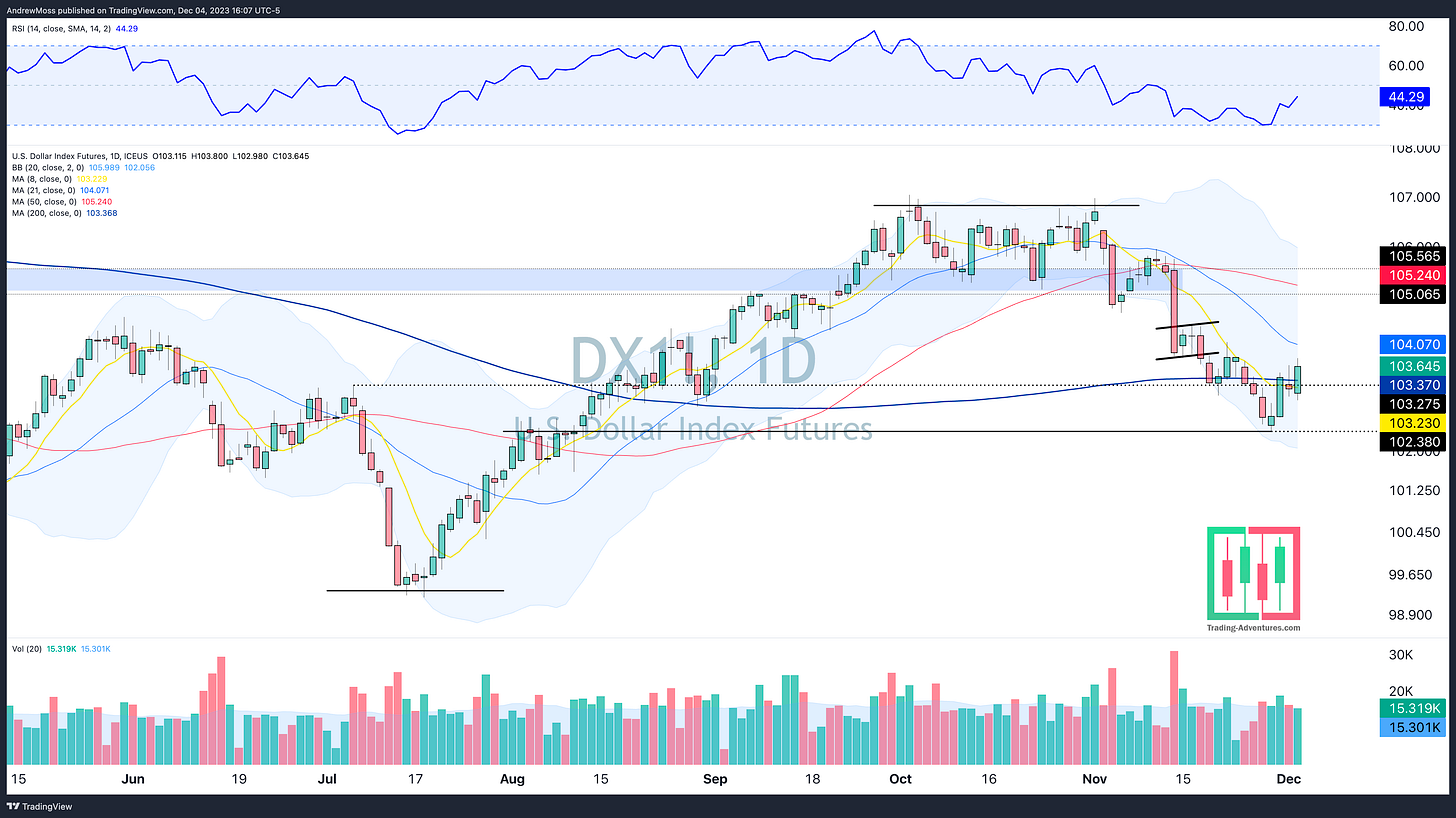
DXY The Dollar is nearing its 21-day MA by moving higher, while many M7 stocks are doing it by moving lower. The polarity continues, which means we must keep watching this chart.
Bonus Charts
Gold charts are making the rounds today as it moved into higher ground last week.
The breakout is getting a lot of attention. But Gold has been here before. Is it different this time?
GLD Weekly Chart
BTCUSD The Bitcoin breakouts continue, signaling a strong market risk-on attitude.
The Closing Bell
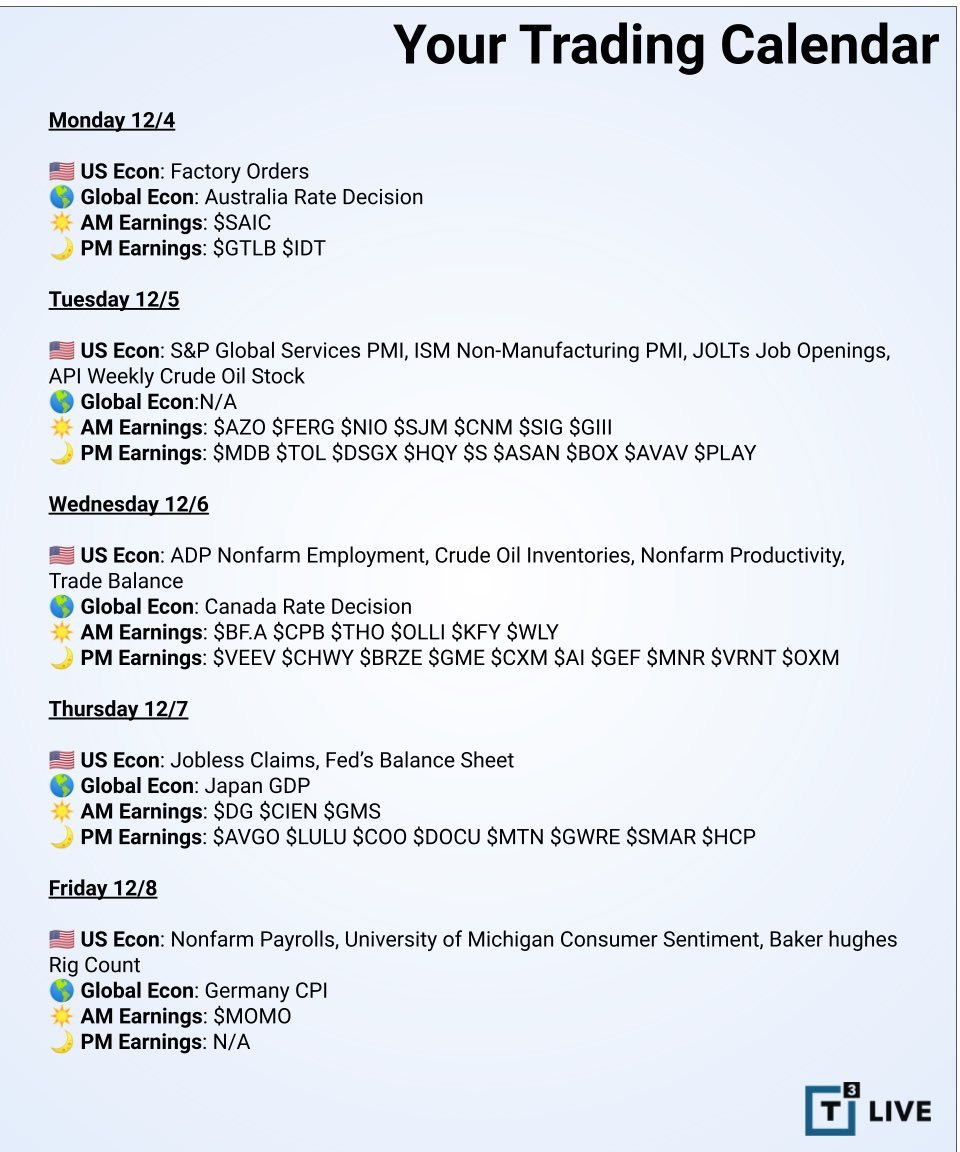
This week's calendar has a number of earnings reports, JOLTs data, and nonfarm payrolls. The Fed closely monitors jobs data, so those reports could have a market impact.
The Disclosures
***This is NOT financial advice. NOT a recommendation to buy, sell, or trade any security. The content presented here is intended for educational purposes only.
Andrew Moss is an associated member of T3 Trading Group, LLC (“T3TG”) a SEC registered broker/dealer and member of FINRA/SIPC. All trades placed by Mr. Moss are done through T3TG.
Statements in this article represent the opinions of that person only and do not necessarily reflect the opinions of T3TG or any other person associated with T3TG.
It is possible that Mr. Moss may hold an investment position (or may be contemplating holding an investment position) that is inconsistent with the information provided or the opinion being expressed. This may reflect the financial or other circumstances of the individual or it may reflect some other consideration. Readers of this article should take this into account when evaluating the information provided or the opinions being expressed.
All investments are subject to the risk of loss, which you should consider in making any investment decisions. Readers of this article should consult with their financial advisors, attorneys, accountants, or other qualified investors prior to making any investment decision.
POSITION DISCLOSURE
December 4, 2023, 4:00 PM
Long: AFRM1215P37, AMZN, META, METC, NVDA, QQQ, RIVN
Short:
Options symbols are denoted as follows:
Ticker, Date, Call/Put, Strike Price
Example: VXX1218C30 = VXX 12/18 Call with a $30 strike


