The Markets
Up > sideways > up > sideways > up > sideways.
The pattern continues. Stock prices move up in a few days. Then they move sideways, or even down a bit, as the moving averages catch up, and then they move higher once again.
Uptrends — they really can be that simple.
The challenge is often not to overthink. Follow the price and let it show you the way. That’s the beauty of the charts—simplicity.
Yes, the news is scary. No, we don’t know how many times the Fed will cut interest rates, when the next recession will be, what stock will have an earnings surprise, or when another war or escalation may break out.
The market may know — or at least it may have a very well-informed guess. News follows price most of the time.
But we don’t know.
And the charts don’t care. They simply show us what is actually happening.
If you’re a big fan of the F word (fundamentals), you don’t have to throw out your playbook. But it may pay well to simplify. Follow the price. Get in tune with what the action and the charts are saying.
Don’t overthink.
To once again use the words of the late Jon Boorman, quoted many times on this page,
Buy uptrends and manage risk.
That’s about as simple as we can make it.
The Charts
SPY is holding the line—the $533 pivot. It has tested each of the last three days, and now we have a new closing high. The longer it stays above that, and once the 8- and 21-day MAs catch up to that level, the more likely this trend will continue to stair-step higher.
The Bollinger Bands are moving higher, as are all the key MAs. Price is not terribly extended beyond short-term MAs. And the RSI is not overbought.
There is room above.
QQQ is still following the same playbook. The uptrend is intact. All we have to do is watch as the MAs follow along and be on the lookout for extreme levels of extension, which are not currently present.
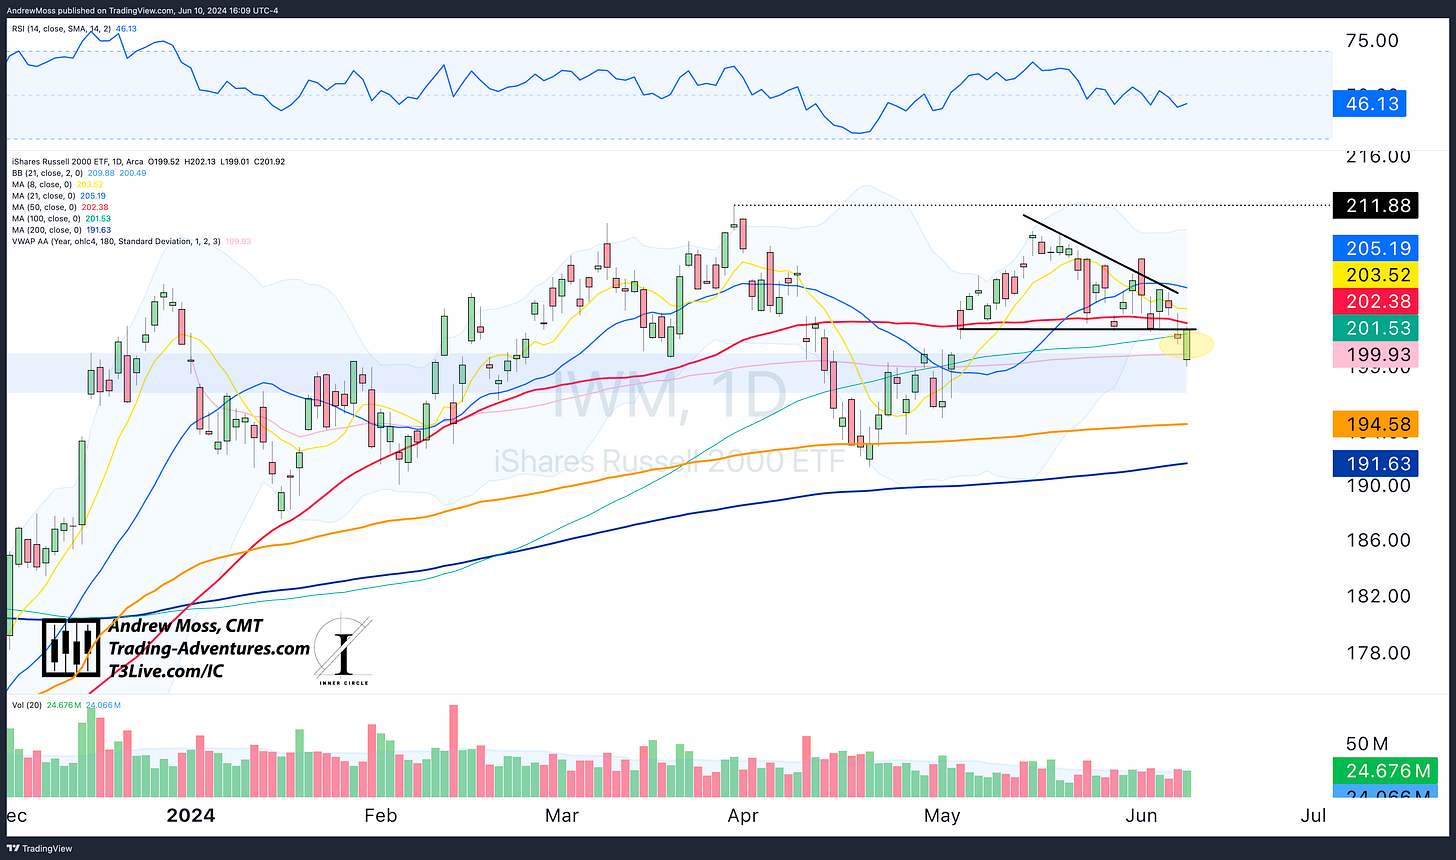
IWM bounced from the YTD AVWAP today and is trying to save the failed breakdown. To confirm that save, we’ll need to see a close back over ~$202 and the 50-day MA by tomorrow.
DIA is positive today, being held up by the 8, 50, and 100-day MAs, which are all within $0.50 of each other — $387.30 to $387.74. If this support continues to hold, the 21-day MA and Friday’s pivot high up near $391 are the next tests.
There is potential for a bearish rising wedge pattern. But so far, it has not been confirmed.
TLT had an excellent bounce and breakout and is retesting the move now. It must hold this trend zone and the 50-day MA. If not, interest rate relief is out the window (or postponed) and likely pressures stocks further.
DXY The Dollar failed its chance at a breakdown on Friday and instead, is breaking out higher today.
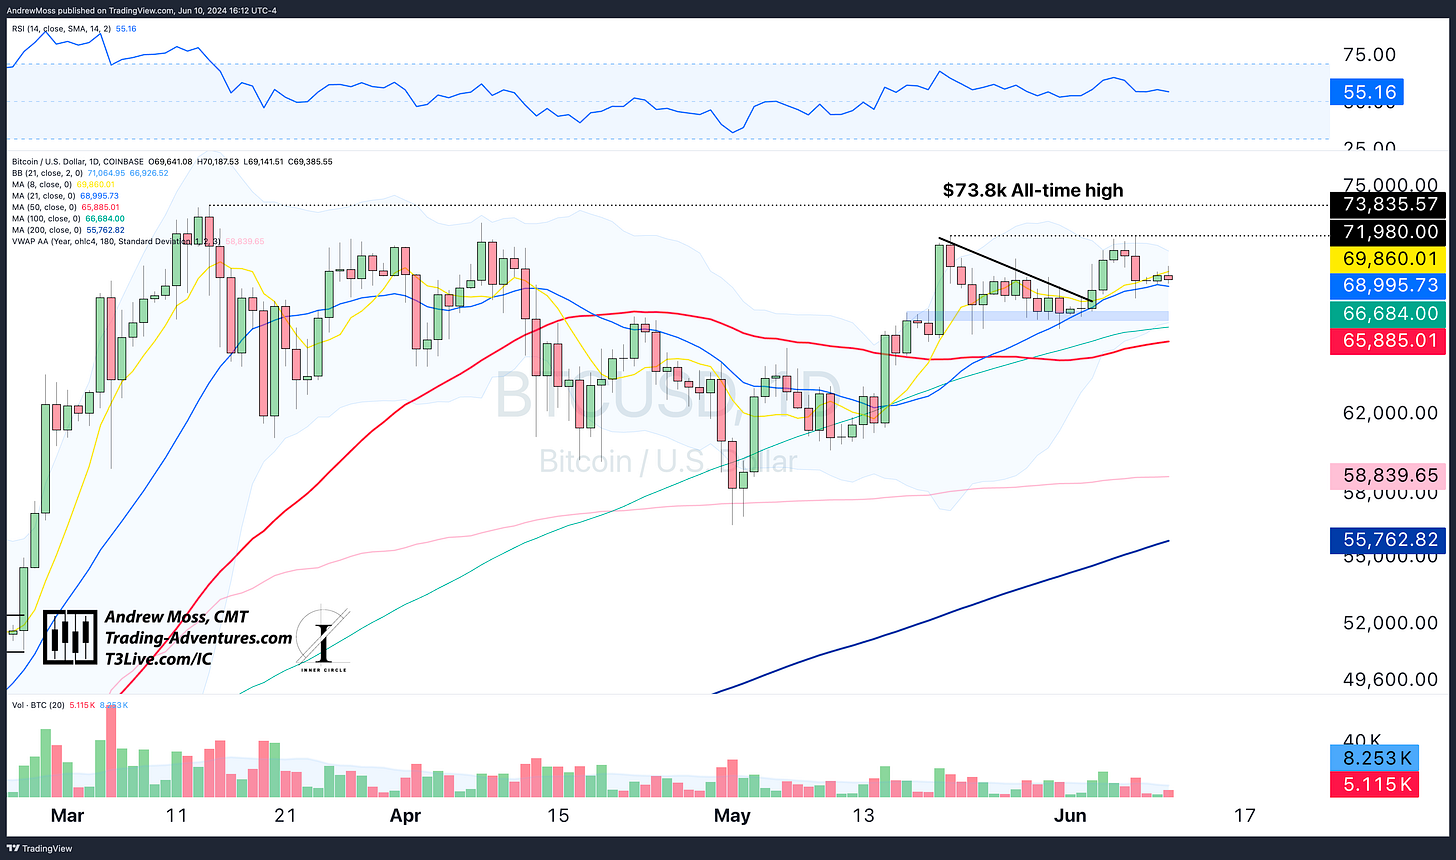
BTCUSD hasn’t been able to get anywhere quickly. It spent three days probing the $71,980 pivot and now has spent four days testing the 8- and 21-day MAs. The chart is still bullish, and more time in this range should add strength to the eventual move up and over.
However, the 21-day MA has rounded over and is now heading lower. So if $BTC is going to attack the pivot again, sooner is better.
The Trade
Again, keep it simple.
I always include charts for TLT, DXY, and BTCUSD because Intermarket analysis is a big part of my process.
BUT, if you’re just trading AAPL, NVDA, SPY, or whatever ABC/XYZ stock, maybe you don’t need to see what Treasury bonds or the US Dollar are doing. For me, they’re context clues and a way to keep tabs on the overall market environment.
I want to be aware, but I’m not opening or closing a trade based on a breakout or breakdown of the Dollar — unless I’m trading the Dollar.
If you find it helpful to know what the other areas of the market are doing, that’s good. If not, that’s ok too. Just make sure you don’t let extenuating circumstances negatively affect your thoughts about trade management.
Absorb what is useful. Discard what is not. Add what is uniquely your own.
— Bruce Lee
Simplify.
Elevate Your Trading
Education, training, and support for your Trading Adventure.
Options Trades - Weekly trade ideas are delivered to your email or text messages in language you can easily understand.
Check out EpicTrades from David Prince and T3 Live. Epic Trades from David Prince
Community - Are you an experienced trader seeking a community of professionals sharing ideas and tactics? Visit The Inner Circle, T3 Live’s most exclusive trading room - designed for elite, experienced traders.
The Inner Circle at T3 Live
Prop Trading - Or perhaps you are tested and ready to explore a career as a professional proprietary trader? 3 Trading Group has the technology and resources you need.
Click here to start the conversation:
T3TradingGroup.com
The Disclosures
***This is NOT financial advice. This is NOT a recommendation to buy, sell, or trade any security. The content presented here is intended for educational purposes only.
Andrew Moss is an associated member of T3 Trading Group, LLC (“T3TG”), an SEC-registered broker/dealer and member of FINRA/SIPC. All trades placed by Mr. Moss are done through T3TG.
Statements in this article represent that person’s opinions only and do not necessarily reflect those of T3TG or any other person associated with T3TG.
Mr. Moss may hold an investment position (or may be contemplating holding an investment position) that is inconsistent with the information provided or the opinion being expressed. This may reflect the financial or other circumstances of the individual, or it may reflect some other consideration. Readers of this article should consider this when evaluating the information provided or the opinions being expressed.
All investments are subject to the risk of loss, which you should consider in making any investment decisions. Readers of this article should consult with their financial advisors, attorneys, accountants, or other qualified investors before making any investment decision.
POSITION DISCLOSURE
June 1O, 2024, 4:00 PM
Long: AMZN, BITO0621C27, CELH0719C75, IBIT, VKTX0621C85
Short:
Options symbols are denoted as follows:
Ticker, Date, Call/Put, Strike Price
Example: VXX1218C30 = VXX 12/18 Call with a $30 strike


