Hurry Up And Wait
Monday Market Update September 18, 2023
The Markets
These days it seems the market is always waiting on what’s next. Of course, we know that stocks are forward-looking instruments. Whatever happened yesterday, or even 10 seconds ago, is old news. History.
What’s coming tomorrow, next week, and six months from now (and so on) is all the stock market cares about. Lately, though, it seems one news item gets behind us with little to no reaction and then there isn’t much to do but look to the next thing on the calendar.
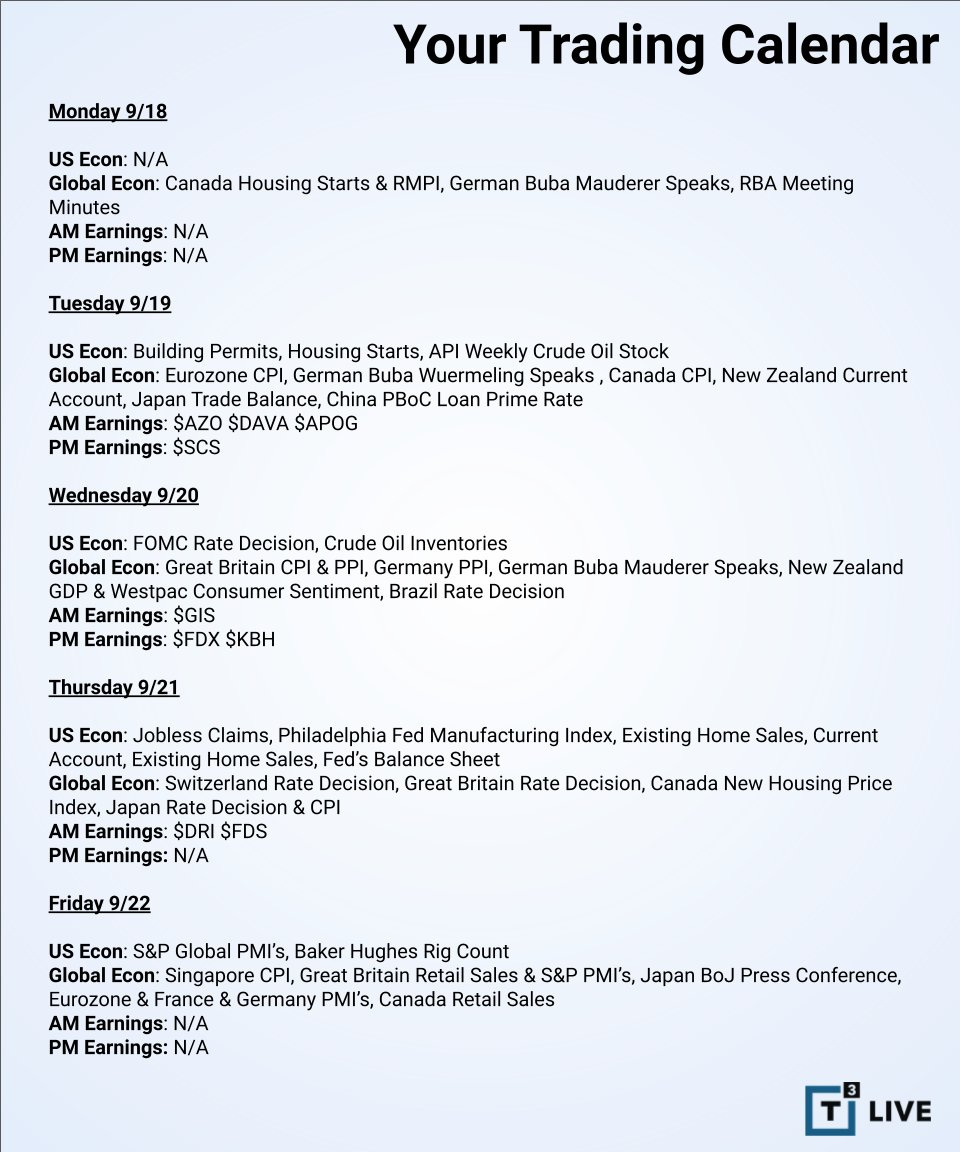
Last week it was inflation data. The week before that was jobless claims. This week it’s the FOMC. By the way, the expectation is for …… nothing. No change in the overnight rates.
So what are we waiting for?
Maybe Jerome Powell’s comments will give some direction. Who knows. Whatever the case, these are the times when it can be especially nice to tune out the news (and the noise) and rely more on the charts.
For the last three weeks, stocks have been mostly contained inside a 2-3% range. For the last 3-4 months that range only expands modestly to about 6-8%. This seems like a good opportunity for a reminder that stock markets can correct in a couple of different ways; by time, or by price.
A price correction is an obvious sequence. Prices go up. They get overbought and extended from the moving averages. Selling comes in. And prices go back down towards their natural equilibrium; a 50, 100, or 200-day moving average for instance.
A time correction is less eventful and sometimes more frustrating. In this scenario, prices chop around in a range instead of selling off. But the end result is the same. The moving averages catch up to the price, potentially setting the stage for the next leg higher.
Could it be that we are seeing that happen now?
The correction is already underway as all four key indexes are trading beneath their 50-day MAs. Now we see how far it goes.
IWM is already below it’s 200-day MA. Do the others follow? Or can they stay above the 100-day MAs and then resume the move higher?
Maybe JPow says something this week that shakes things up and gets prices moving. Or, maybe we will have to endure the choppiness for a few more weeks as the seasonally weaker time of year passes before giving way to a year-end rally.
The Charts
SPY briefly touched the 21-day MA today before settling back into the lower end of the range. There is pivot ($442) and trendline support nearby. Nothing has to happen. And certainly not while we await FOMC. But it would seem that further resolution of this consolidation pattern is coming this week.
QQQ held the $369 pivot and moved above the 21-day MA for a time and then closed a little stronger than SPY.
IWM looks more vulnerable every day. Losing $182 gives way to $180. After that, there is little help until it reaches the low $170s.
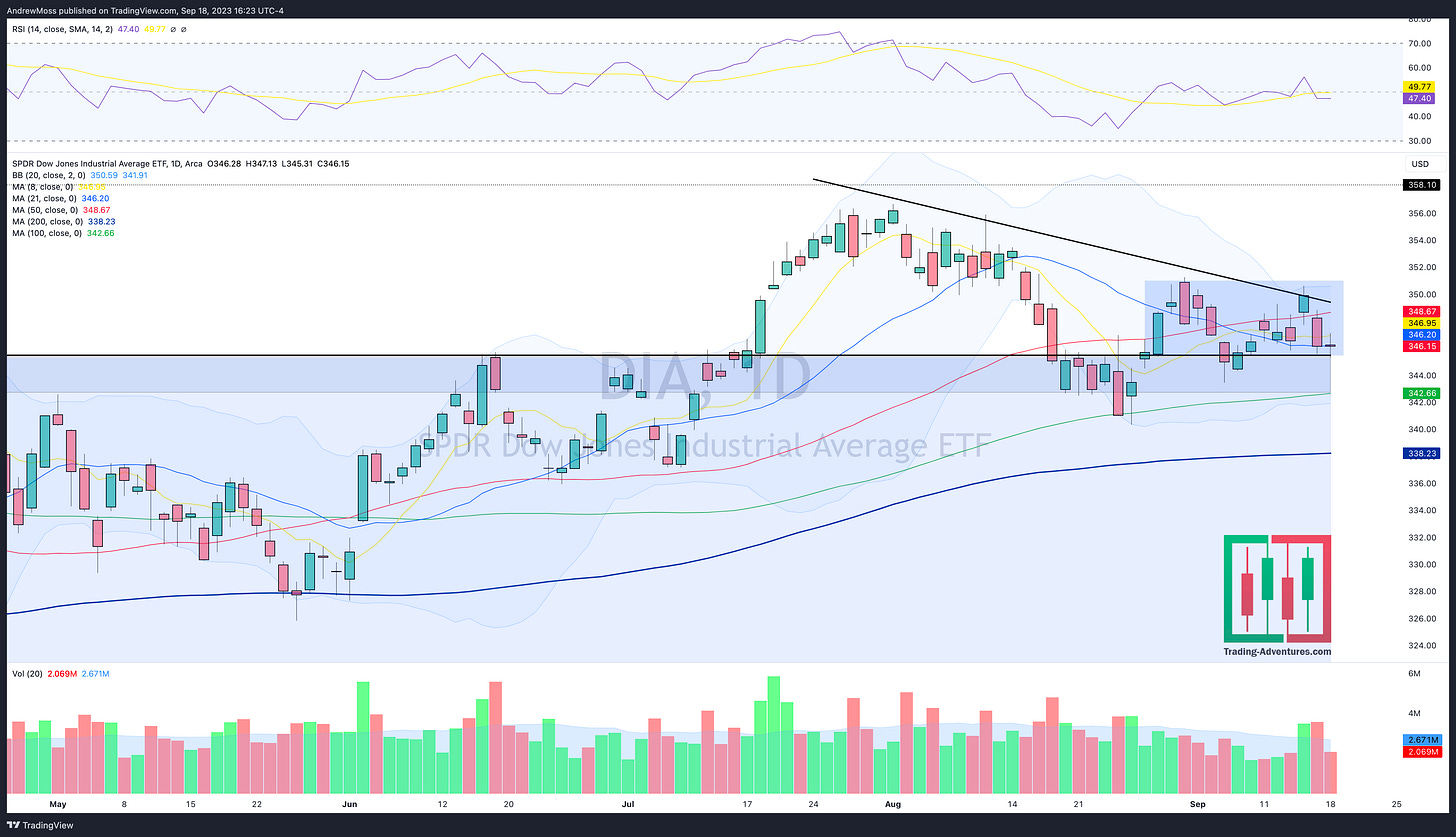
DIA is still riding along above the larger range. No changes here. Yet.
TLT was a small bright spot today as it put in a bullish engulfing candle and closed near the high of the day. Generally speaking - Bonds up > rates down > good for stocks.
DXY also gave some relief today as it takes a breather. Potential resistance is acting as actual resistance.
The Closing Bell
It continues to be a good time to do less while we wait for the charts to show hints of the next big moves.
Here’s the calendar for the week. We’ll meet back here on Thursday to see what happens after the FOMC meeting.
The Disclosures
***This is NOT financial advice. NOT a recommendation to buy, sell, or trade any security. The content presented here is intended for educational purposes only.
Andrew Moss is an associated member of T3 Trading Group, LLC (“T3TG”) a SEC registered broker/dealer and member of FINRA/SIPC. All trades placed by Mr. Moss are done through T3TG.
Statements in this article represent the opinions of that person only and do not necessarily reflect the opinions of T3TG or any other person associated with T3TG.
It is possible that Mr. Moss may hold an investment position (or may be contemplating holding an investment position) that is inconsistent with the information provided or the opinion being expressed. This may reflect the financial or other circumstances of the individual or it may reflect some other consideration. Readers of this article should take this into account when evaluating the information provided or the opinions being expressed.
All investments are subject to the risk of loss, which you should consider in making any investment decisions. Readers of this article should consult with their financial advisors, attorneys, accountants, or other qualified investors prior to making any investment decision.
POSITION DISCLOSURE
September 18, 2023, 4:00 PM
Long:
Short:
Options symbols are denoted as follows:
Ticker, Date, Call/Put, Strike Price
Example: VXX1218C30 = VXX 12/18 Call with a $30 strike


