The Markets
Is this a new bull market?
That’s a difficult question to answer without using some type of technical analysis. Regardless of how a new bull market may be defined; a percentage move off the lows, where the price is relative to a moving average, or the percentage of stocks making new highs versus new lows, the designation will almost always be determined using some type of technical analysis.
Though technical analysis can be approached in many different ways, the most familiar form is probably the stock chart. Charts are an indispensable tool, whether it’s a simple visual representation of price or a more complicated layout, with indicators, oscillators, and drawings.
Another form takes a deeper look at the underlying data. Studies of breadth, cycles, highs and lows, intermarket analysis, bullish percents, momentum, and all the rest require more thought and consternation. These analyses don’t always point to a clear buy/sell decision. Rather, the objective is to add to the story by determining, ‘what is the weight of the evidence’ saying? What is ‘the path of least resistance’ for securities prices?
Walter Deemer has been doing this type of analysis longer than most. When asked the question, “Is this a new Bull Market?” his answer is yes. (he’s not alone)
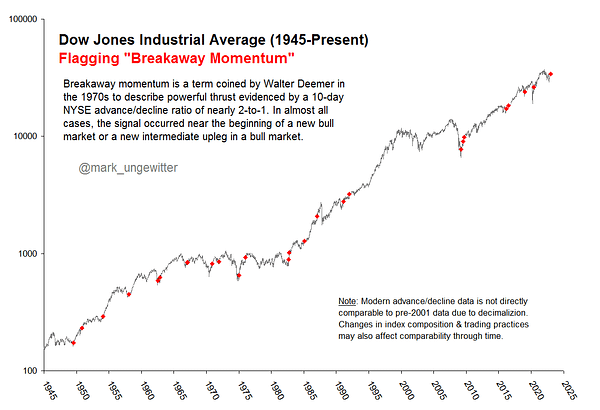
Yesterday he pointed out an occurrence of a rare breadth thrust.

Mark Ungewitter followed up with this chart marking the previous instances.
Mark also adds this wisdom:
I don’t know if this is a new bull market. And I don't know if stock prices will continue higher from here. But based on this analysis I’d say there is a good chance that they probably will.
Some charts of individual names have seen impressive breakouts this week. Chinese stocks (see FXI) appear to have turned the corner. Economic data is improving? Or at least is having a less negative impact on stock prices.
These factors add weight to the bullish case and the path of least resistance for prices looks to be higher. There continue to be tests and resistance levels ahead. That can’t stop until new all-time highs are made (DIA is less than 10% away).
With these improvements, it is possible that stocks continue pointing in the direction of those highs.
The Charts
SPY — is passing the tests. It is trading above the 8/21/50-day moving averages and the support/resistance zone (shaded area). Staying above these levels is important. As long as that happens, the 200-day, the downtrend line, and the $410 pivot are next.
QQQ — is a little messy as tech continues to lag a bit. It’s trading around the 50-day MA but has room to go higher. Below 269 would be cause for concern.
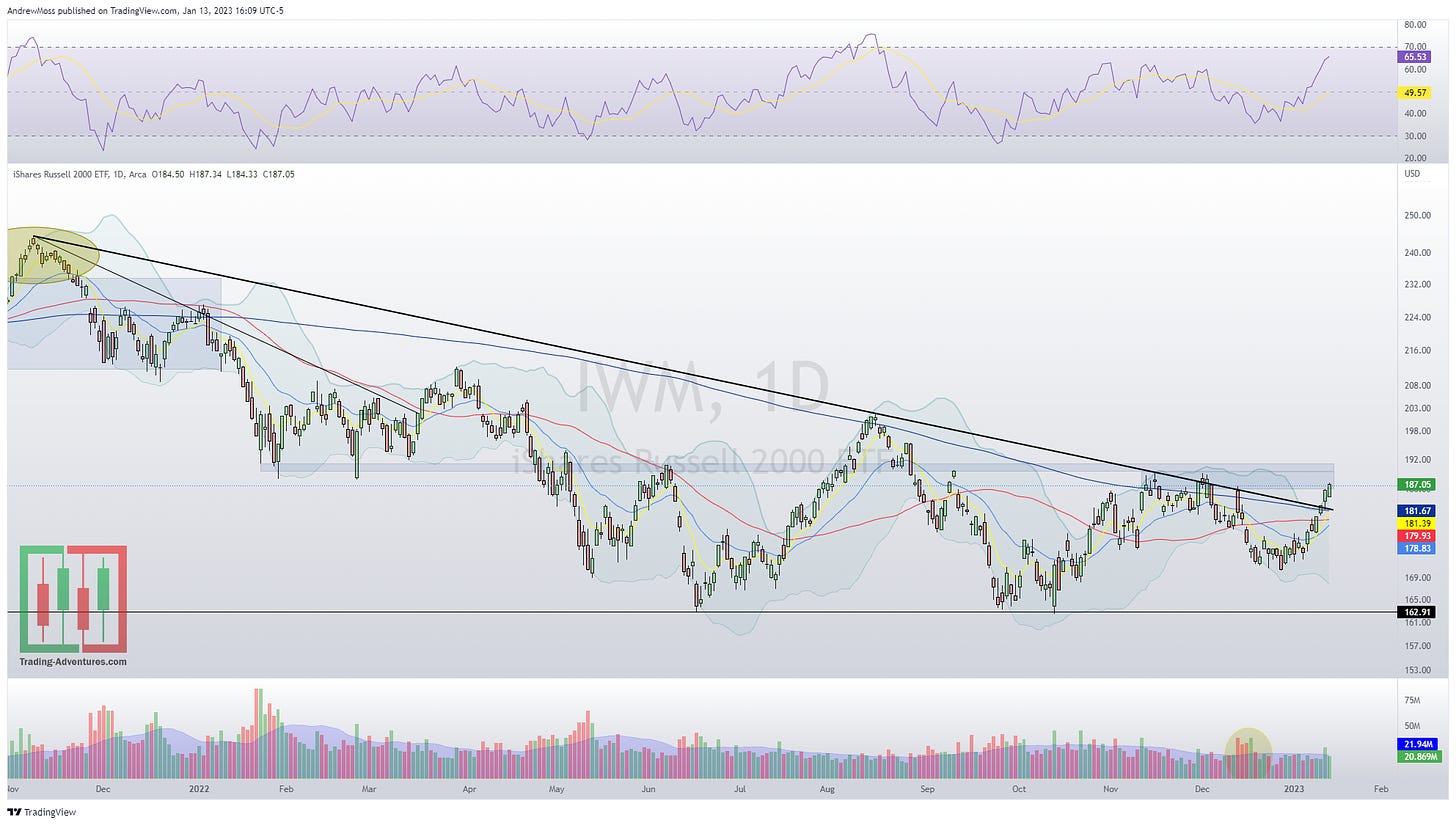
IWM — is holding yesterday’s break above the 200-day MA well. The area from 186-191 (shaded area) could be challenging. If it can work its way through that over the coming days or weeks that will open the door to 201 and then 210. Back below the trendline and 200-day would mean a failed breakout and lower prices.
DIA — continues to lead the way. Watch the 8/21/50-day MAs below and the 348 and 354 pivots above.
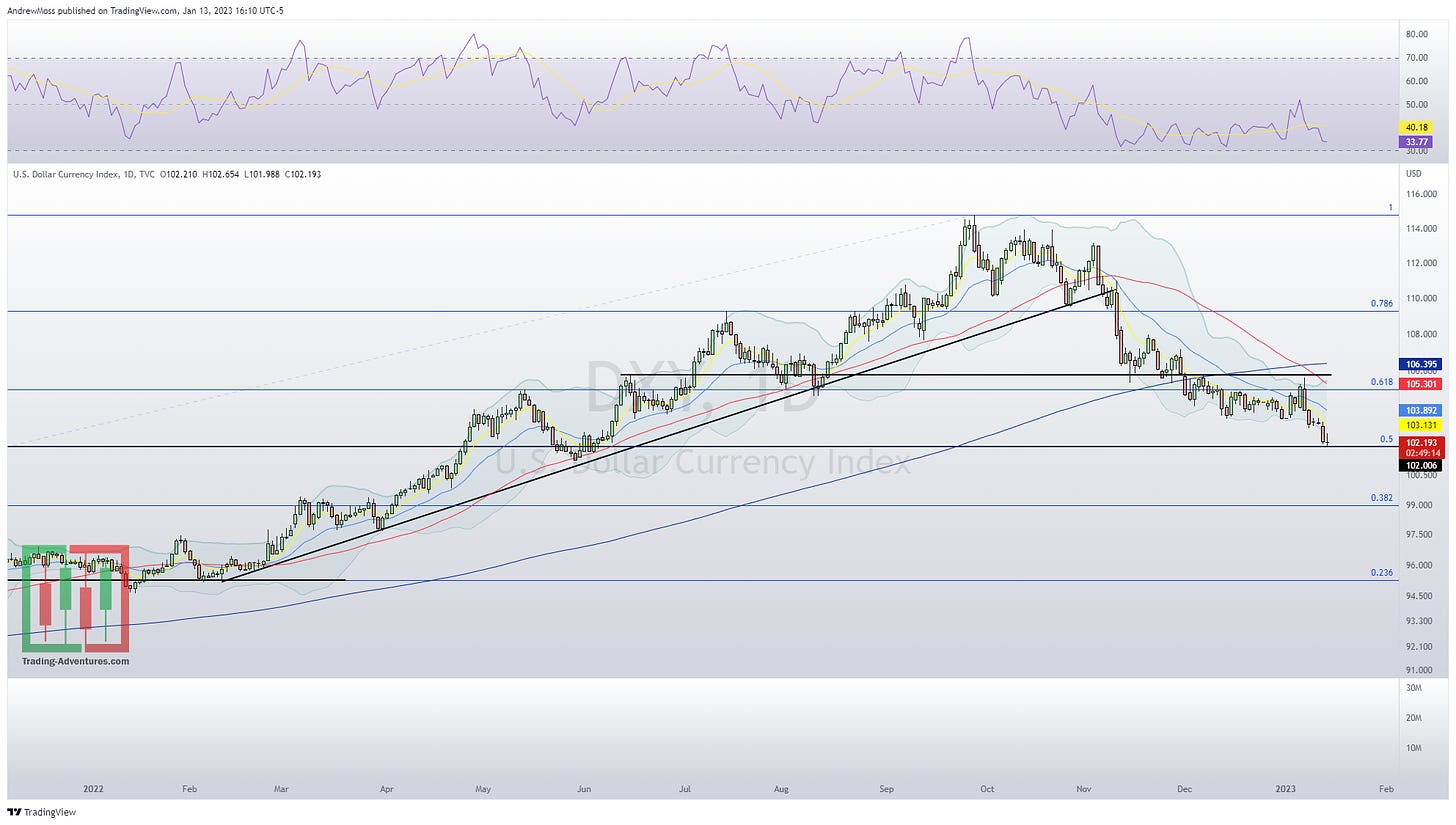
DXY — The Dollar tailwind is still helping stocks as this index hit 102 and the 50% retracement level pointed out months ago. A slowdown in the rate of decline wouldn’t be a surprise here.
VIX — volatility is making new lows and moving down and out of the long-standing range. Let’s see if it can stay low.
What do you see in the charts? Hit the comment button and let me know.
Friday the 13th isn’t that scary
Jeffrey Hirsch of the Stock Trader’s Almanac has an excellent look at this infamous date.
click through to view the complete stats


That’s all for now. Thanks for reading, sharing, and subscribing.
Have questions? Perhaps that’s something you’d like to see more of here?
The lines are always open. Reply to this email (if that’s where you’re reading), leave a comment, or better still, @ me on Twitter where I share more timely updates. And as always, weekly charts will be there in the morning.
Enjoy the weekend!
***This is NOT financial advice. NOT a recommendation to buy, sell, or trade any security. The content presented here is intended for educational purposes only.
Andrew Moss is an associated member of T3 Trading Group, LLC (“T3TG”) a SEC registered broker/dealer and member of FINRA/SIPC. All trades placed by Mr. Moss are done through T3TG.
Statements in this article represent the opinions of that person only and do not necessarily reflect the opinions of T3TG or any other person associated with T3TG.
It is possible that Mr. Moss may hold an investment position (or may be contemplating holding an investment position) that is inconsistent with the information provided or the opinion being expressed. This may reflect the financial or other circumstances of the individual or it may reflect some other consideration. Readers of this article should take this into account when evaluating the information provided or the opinions being expressed.
All investments are subject to risk of loss, which you should consider in making any investment decisions. Readers of this article should consult with their financial advisors, attorneys, accountants or other qualified investors prior to making any investment decision.
POSITION DISCLOSURE
January 13, 2023 4:00 PM
Long: GE0120P77, TJX0217C82.50
Short:
Options symbols are denoted as follows:
Ticker, Date, Call/Put, Strike Price
Example: VXX1218C30 = VXX 12/18 Call with a $30 strike


Breadth thrust has a really good track record. Even though I mostly use macro analysis, from that indicator alone, I moved my exposure from 35/65 risk assets/t-bills to 45/55.