

July 2, 2022 Weekend Market Review
What does it all mean?

Welcome to the weekend! I hope that you’re all gearing up for an epic July 4th celebration when you’re finished reading this!
Let’s take a look at some weekly charts to see what’s been happening.
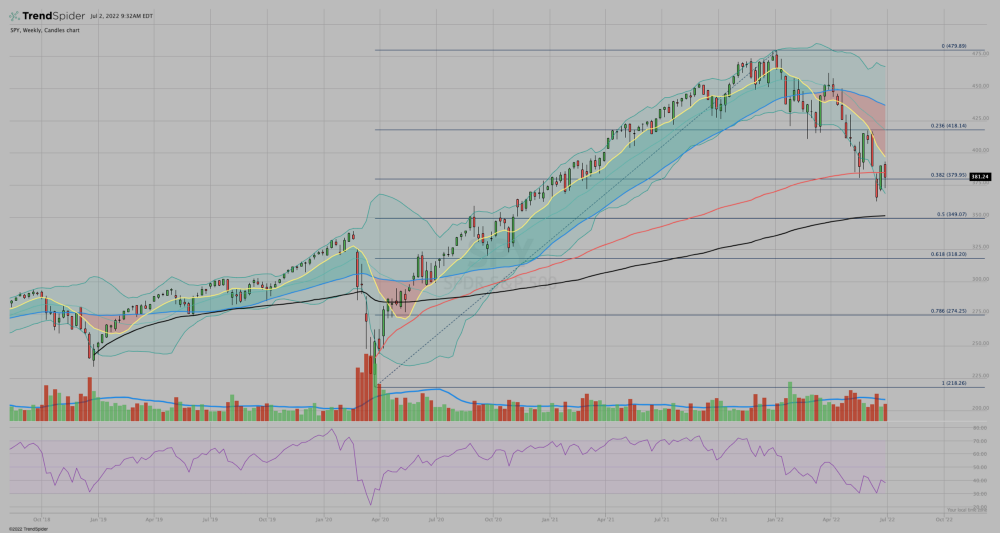
$SPY — downtrend bounce, more chop on either side of $380, the Covid low anchored VWAP, and the 38.2% Fibonacci retracement
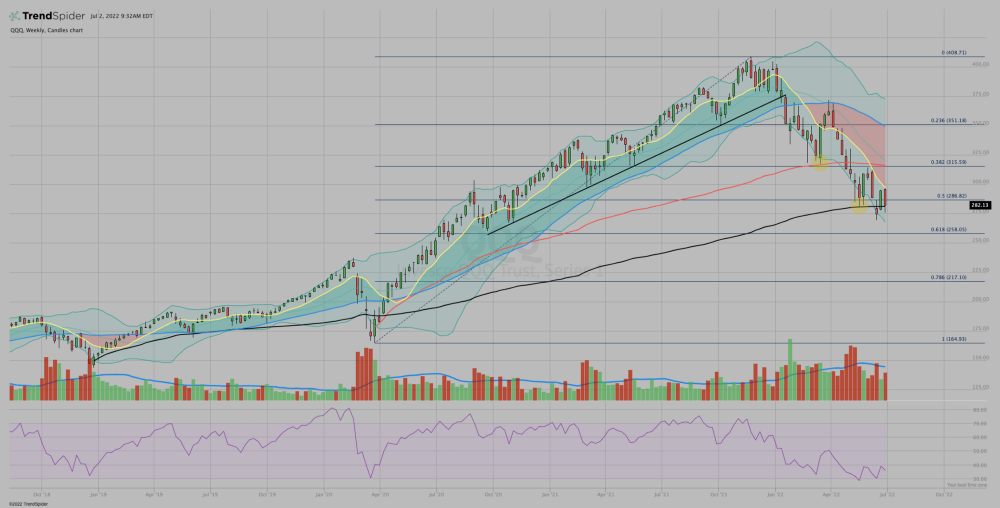
$QQQ — downtrend bounce, trading on both sides of the 50% retracement level, supported by the 12/2018 low anchored VWAP, found resistance at the 10wk moving average
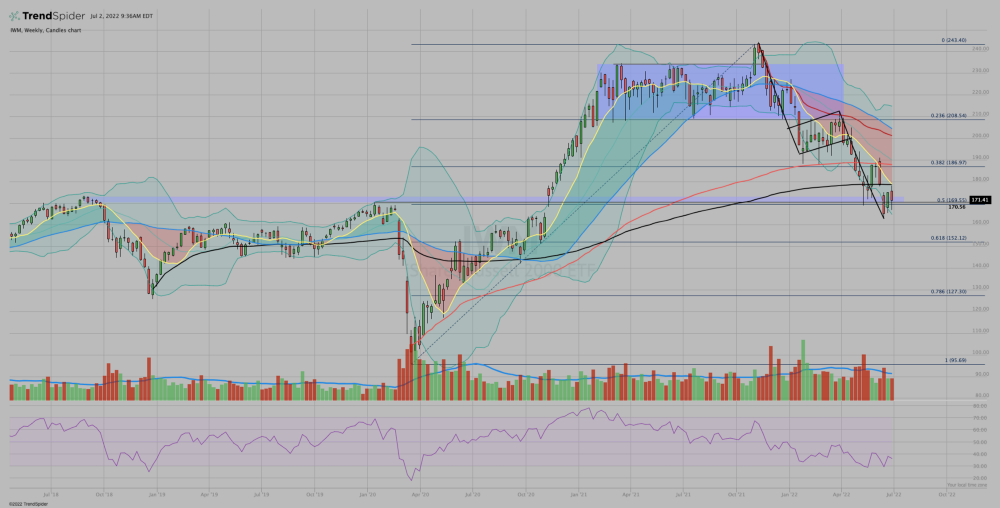
$IWM — downtrend bounce after hitting the bear flag measured move target, also supported by the pre-Covid highs/50% retracement, resistance coming from 10wk moving average and the 12/2018 low anchored VWAP
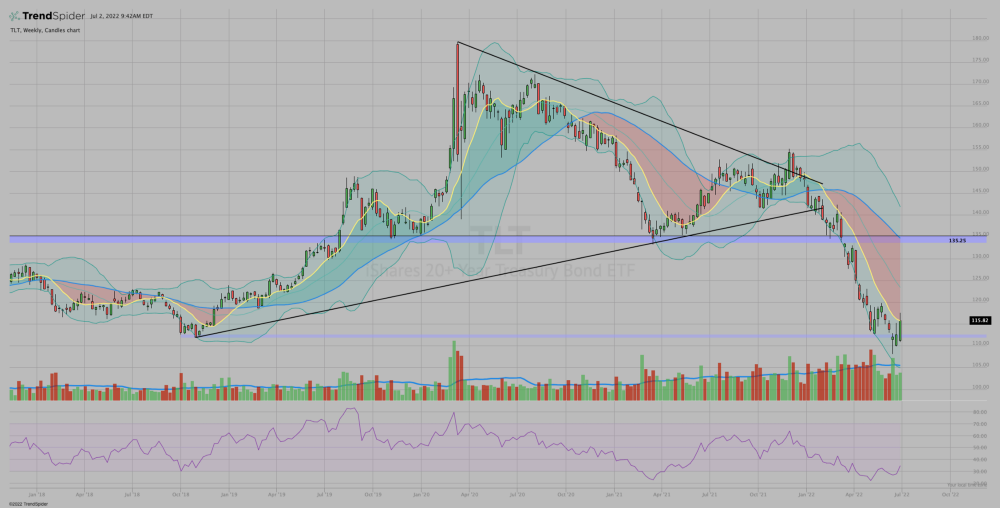
$TLT — found support at the 10/2018 lows and bounced back to the 10wk moving average. Maybe some relief from the rising interest rate move?
Many, many more charts in this Twitter thread.
But for now, What does it all mean?
When I look through the weekly charts each weekend I can’t help but wonder, “what does it all mean? What are these charts telling me?” It’s important to have a “big picture” view.
But it’s also important to keep it simple. Instead of wondering if the selloff in oil and other commodities means inflation will wane and recession will be averted, maybe just recognize the simple fact that prices have been coming down. Maybe that is all it means.
Now, can we find an opportunity with that information? Is there a trade? Can we write a game plan and take a position?
That’s all we need to do. We don’t have to predict the trajectory of the world economy.
Find a trade.
Write your game plan.
Execute.
Manage risk.
Repeat.
That’s it. That’s the whole system.
So as you consider these charts, and maybe the ones I linked above, remember to keep it simple.
Have a great weekend celebrating Independence Day! 🇺🇸
PS — What do you think it means? I’d really like to know. So drop your questions and comments below. And sharing with a friend is always welcomed and appreciated.