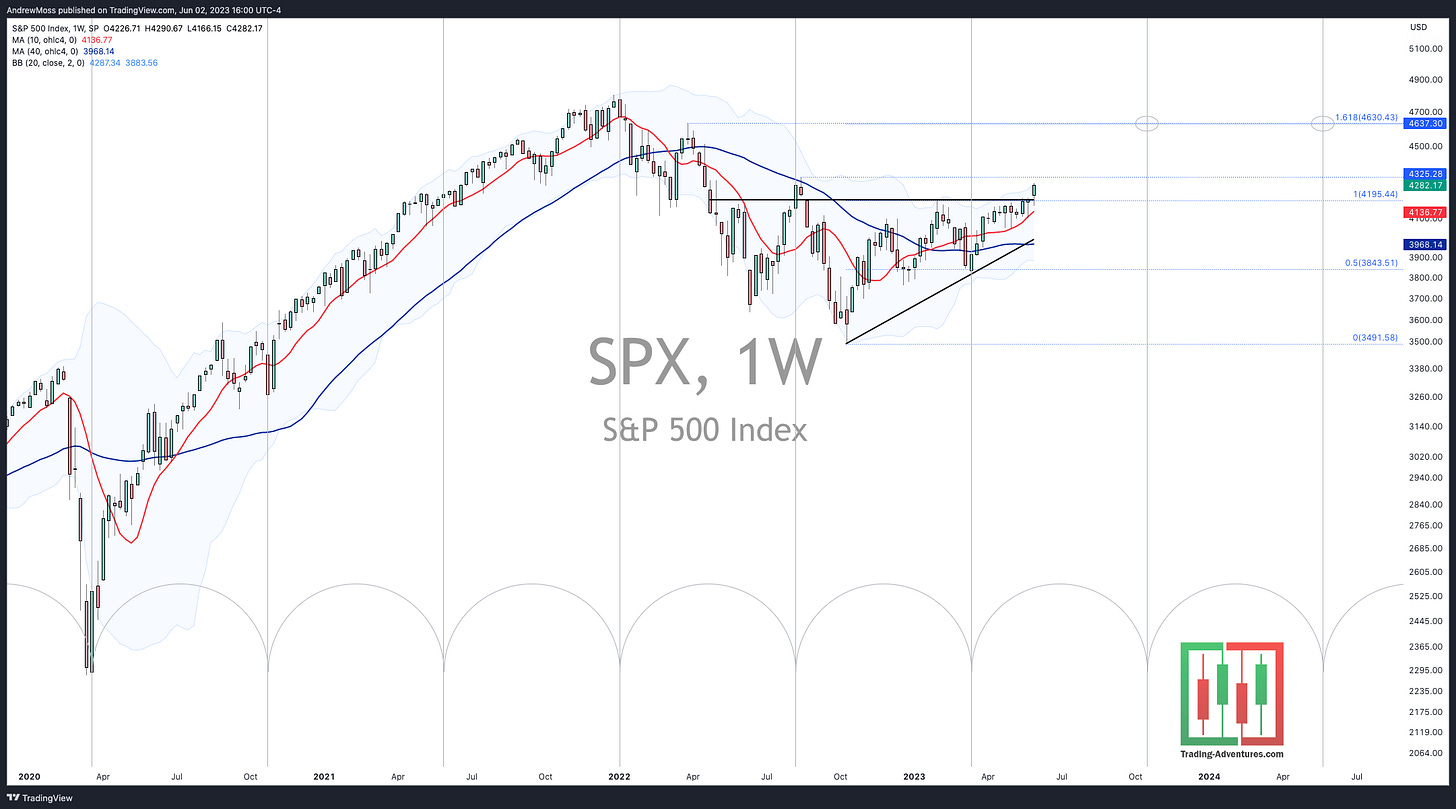
Looking Ahead - Mapping Out A Path to 4630
Weekend Market Update June 2, 2023
The Markets
The SPX breakout appears to be legitimate. The approach this time has been much more systematic and persistent with the price moving closer to equilibrium and with a lower RSI.
Today SPX is getting excellent follow-through. Even better than that, the laggards (DIA and IWM) are moving strongly higher while the leader (QQQ) is taking a break. This is the healthy rotation we’ve been watching for.
These factors add significant weight to the ‘new bull market’ argument, so it makes sense to look a bit farther ahead to identify some possibilities.
SPX is well over the $4200 breakout level now and the next spot to watch is the August pivot high at $4325. As prices get a bit extended away from the 8 and 21-day MAs that would be a great spot for some sideways price consolidation.
Beyond that, there is significant room overhead and a clearly identifiable path to $4630. At that level, we have the confluence of a pivot ($4637) dating back to last March, and the 1.618% Fibonacci extension ($4630) of the move from the October low to the $4200 breakout.
The next question is, when?
Year-end isn’t a bad place to start looking. That move is a little more than 8% above current prices and looking at work from Ryan Detrick (shared in Wednesday’s article) we can see the statistics showing the probability of a +9.4% move for the rest of this year.
Going a step further by adding some cycle lines to the chart above shows the possibility of that target being met even sooner. Notice how these cycle lines coincide with significant occurrences over the last few years. If that pattern holds then it’s not unreasonable to imagine seeing SPX $4630 by October of this year.
Far from a certainty. And it feels a little too fast. But it is one possible path.
The Charts
SPY has successfully retested the breakout level and is accelerating higher. Classic bull market action. Now we see if it can touch 431 before resting a bit.
QQQ has a solid up-day as well. But it didn’t run away, which is a good thing. With the RSI > 75 this will very likely need some time to work along sideways.
IWM The small caps are finally playing some catch-up. $181-$182 is the area on my ‘checklist’ and it’s doing well in that spot today. Now, can it stay?
DIA The Dow 30 made a very nice bounce from its 200-day MA and is back above all of the key moving averages. $344-$346 is the next test where it needs to get up and out of the box.
The Closing Bell
This week great progress has been made for the bullish case. It probably won’t be long until we start hearing calls for correction. And indeed the market won’t go straight up from here, even if the strength does persist.
As always, we will focus on the price action and trade the market that’s in front of us. When a change comes, we’ll see it there.
Don’t forget - Weekend Weekly Charts on Twitter tomorrow morning.
Be there!
And the monthly charts went up yesterday morning. Take a look at those too.
The Disclosures
***This is NOT financial advice. NOT a recommendation to buy, sell, or trade any security. The content presented here is intended for educational purposes only.
Andrew Moss is an associated member of T3 Trading Group, LLC (“T3TG”) a SEC registered broker/dealer and member of FINRA/SIPC. All trades placed by Mr. Moss are done through T3TG.
Statements in this article represent the opinions of that person only and do not necessarily reflect the opinions of T3TG or any other person associated with T3TG.
It is possible that Mr. Moss may hold an investment position (or may be contemplating holding an investment position) that is inconsistent with the information provided or the opinion being expressed. This may reflect the financial or other circumstances of the individual or it may reflect some other consideration. Readers of this article should take this into account when evaluating the information provided or the opinions being expressed.
All investments are subject to the risk of loss, which you should consider in making any investment decisions. Readers of this article should consult with their financial advisors, attorneys, accountants, or other qualified investors prior to making any investment decision.
POSITION DISCLOSURE
June 2, 2023, 4:00 PM
Long: AMD, ENVX, GOOGL, NNOX, SNOW0616P165, UVIX
Short:
Options symbols are denoted as follows:
Ticker, Date, Call/Put, Strike Price
Example: VXX1218C30 = VXX 12/18 Call with a $30 strike


