

March 27, 2022 Market review/preview
$SPY $QQQ $IWM $TLT $VIX

Weekly Chart Time
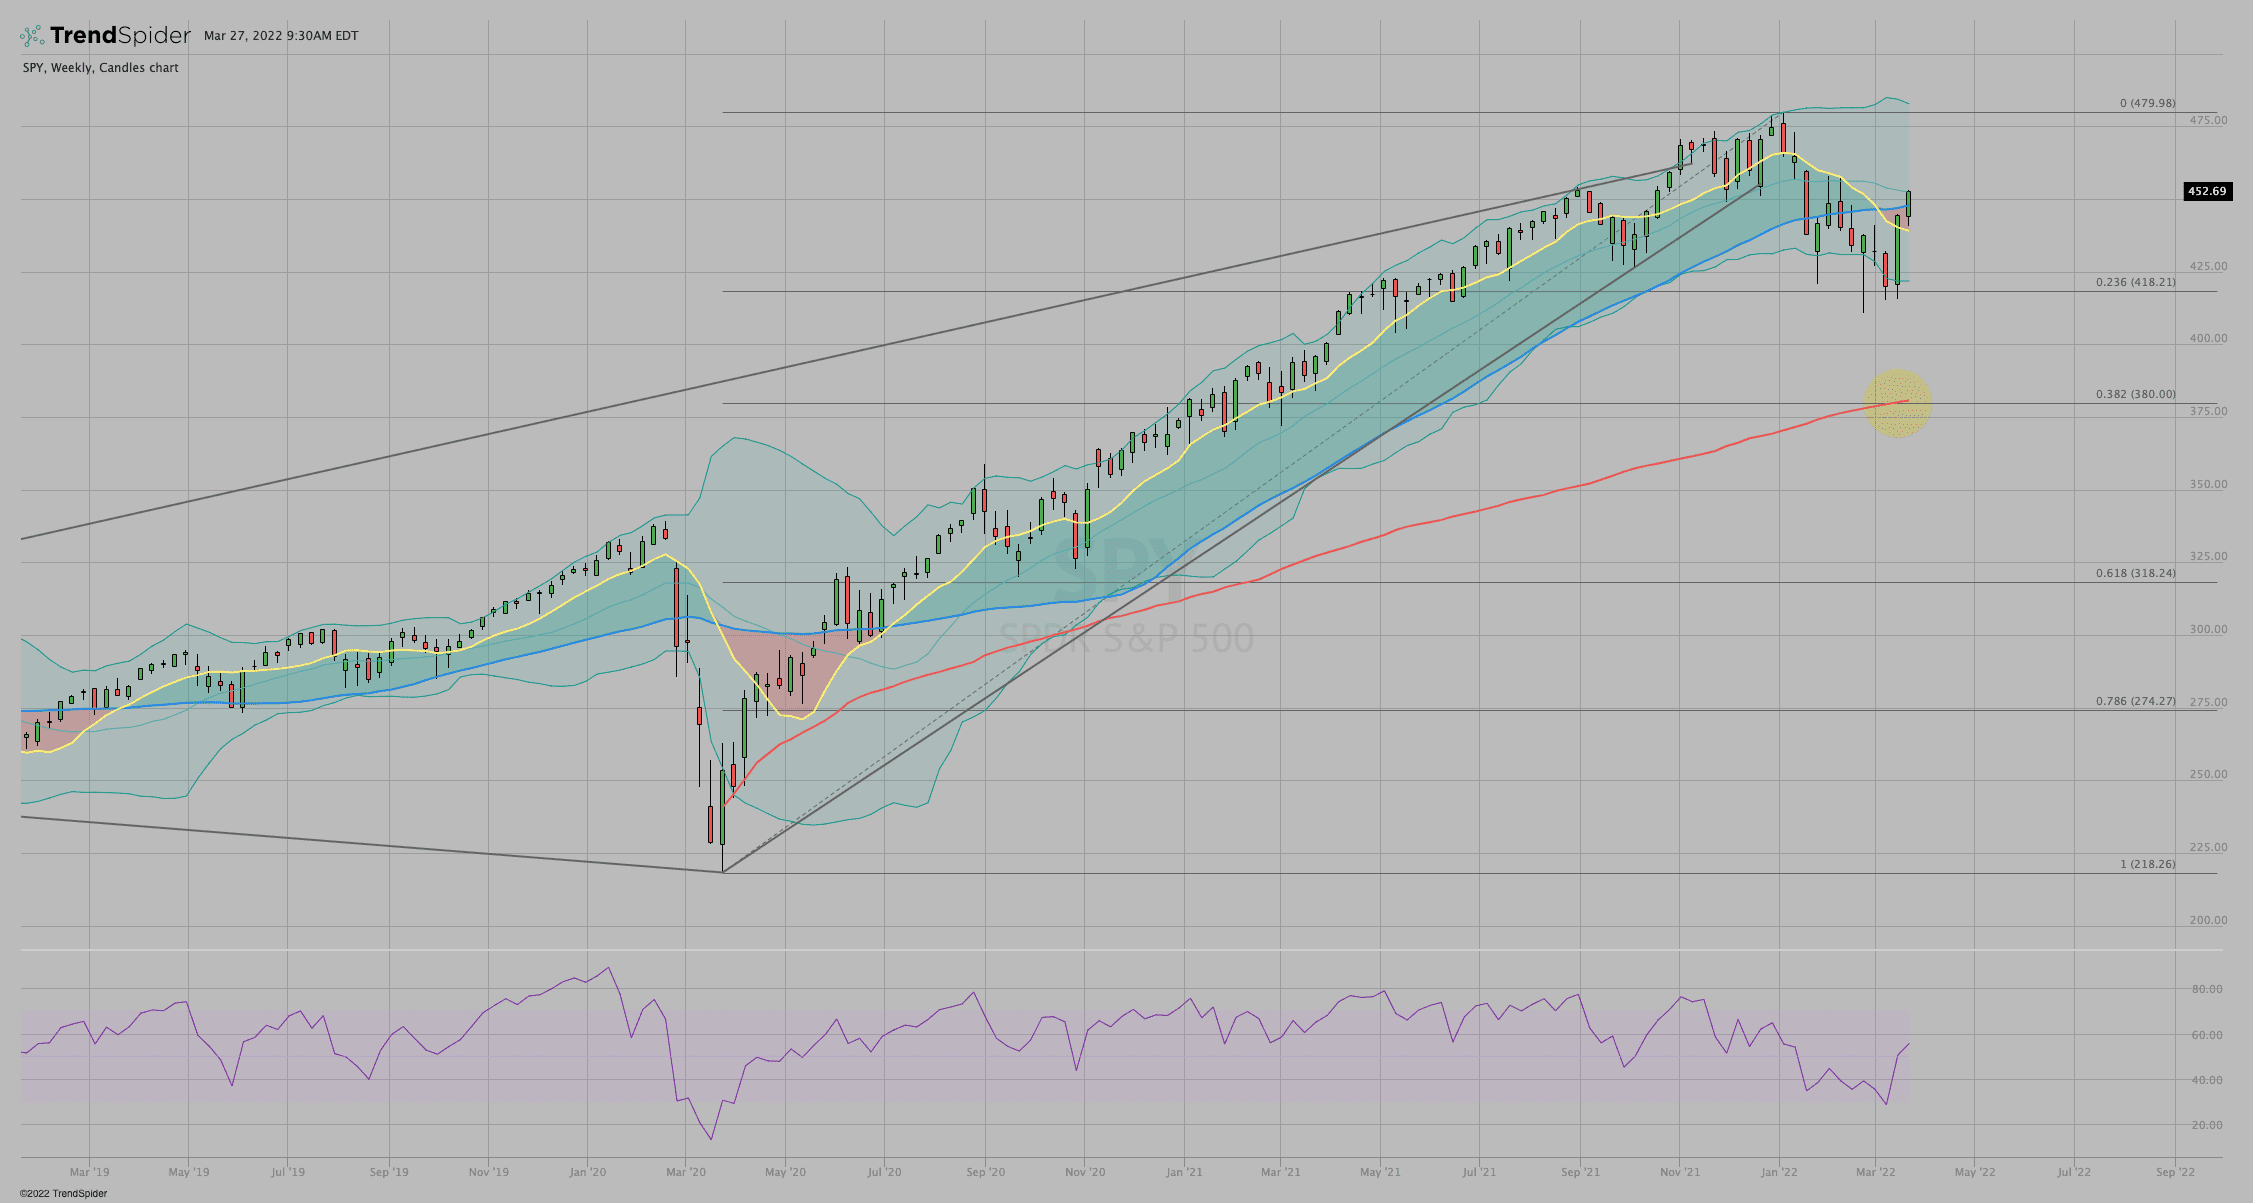
$SPY
- Up ~9% in two weeks
- Back above the 10/40wk SMAs
- Exactly at the middle of the @bbands
- RSI back over 50
https://share.trendspider.com/chart/SPY/339539bk0we
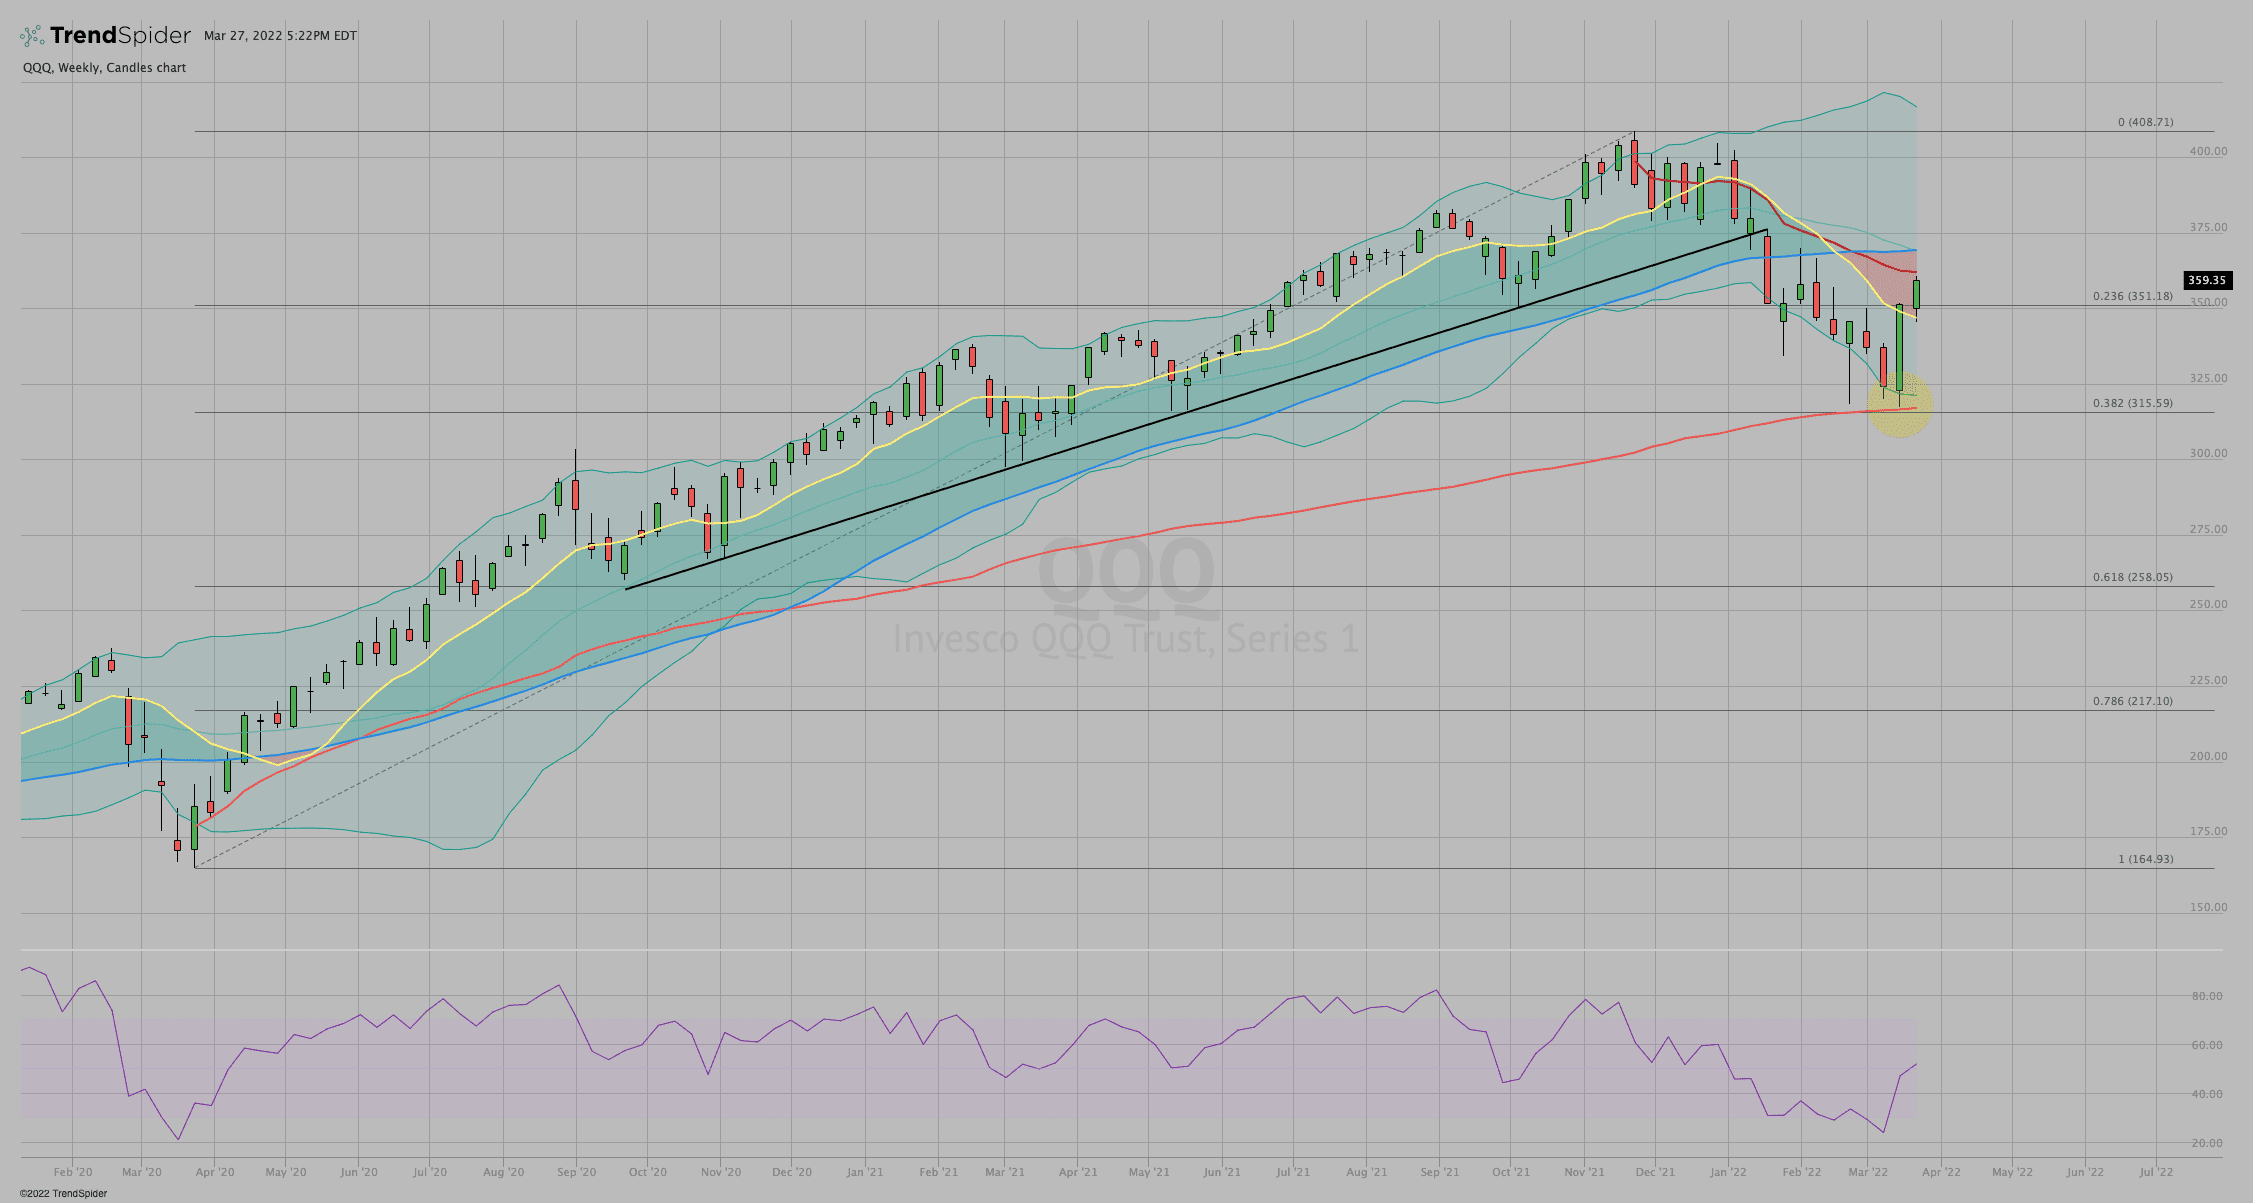
$QQQ
- ~13%+ low to high over two weeks
- Back into 10/40wk SMA cloud
- Strong bounce from the Covid low AVWAP and the 38.2% Fib retracement
- RSI just back over the 50 mark
- ATH AVWAP is just overhead
https://share.trendspider.com/chart/QQQ/339539sefdc
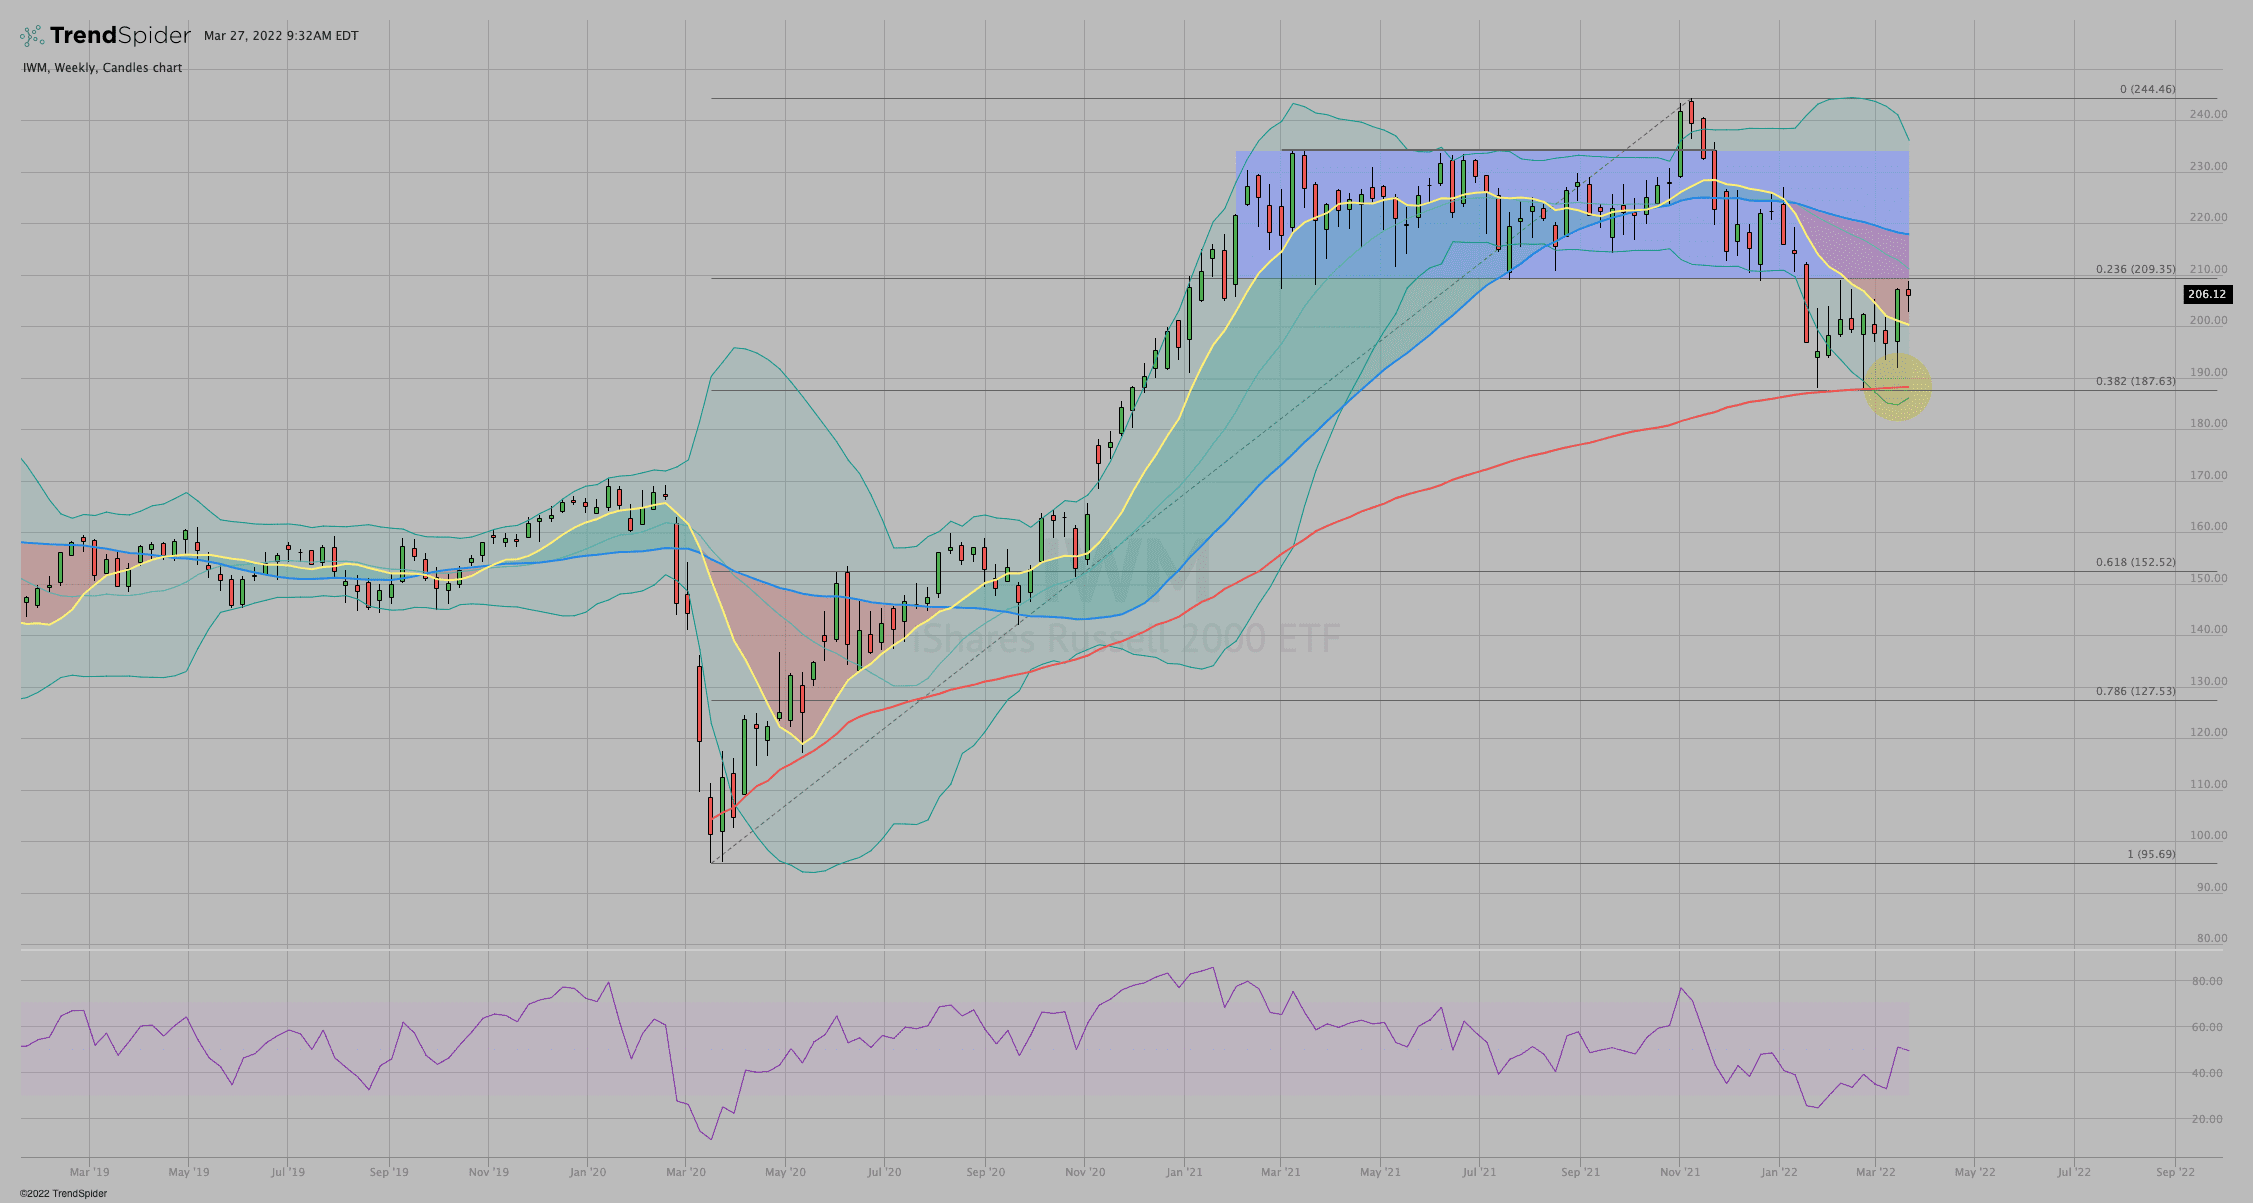
$IWM
- ~8%+ low to high over two weeks
- Back into the 10/40wk SMA cloud
- At bottom of the sideways channel
- Solid bounce from the Covid low AVWAP and the 38.2% Fib retracement
- $210 looks like resistance so far
- $211 is the ATH AVWAP
https://share.trendspider.com/chart/IWM/339539bn6x3
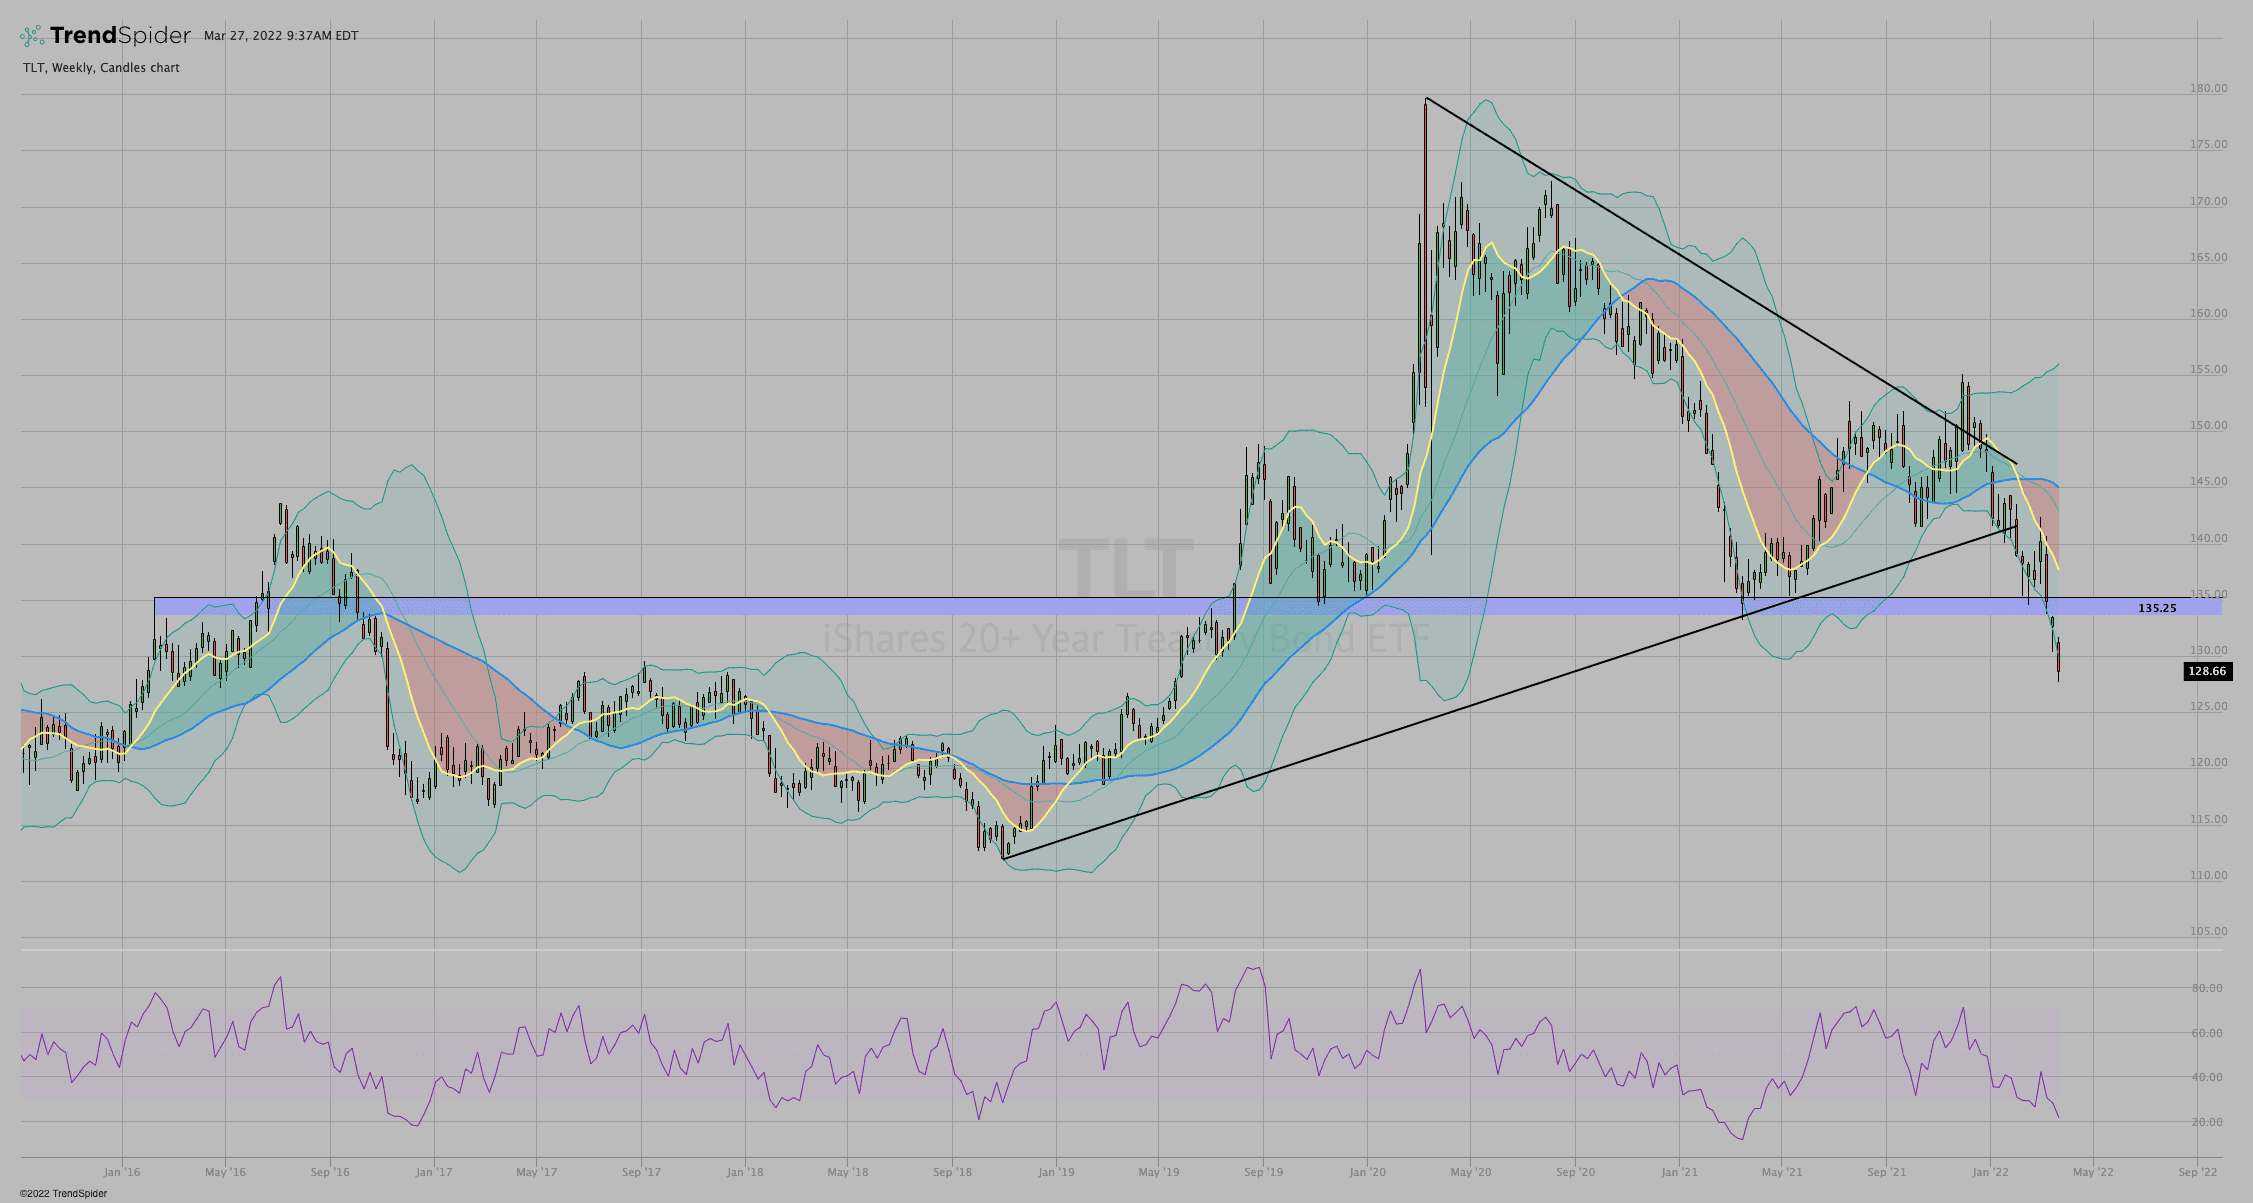
$TLT
- After showing a hammer last week that looked like it wanted to retest, TLT has confirmed the breakdown through 133.50-135
- RSI is low, oversold, and falling
https://share.trendspider.com/chart/TLT/339539bso4m
$VIX
- 3 consecutive lower weekly highs - 1/21/22 - 2/21/22 - 3/7/22
- Now back to 20
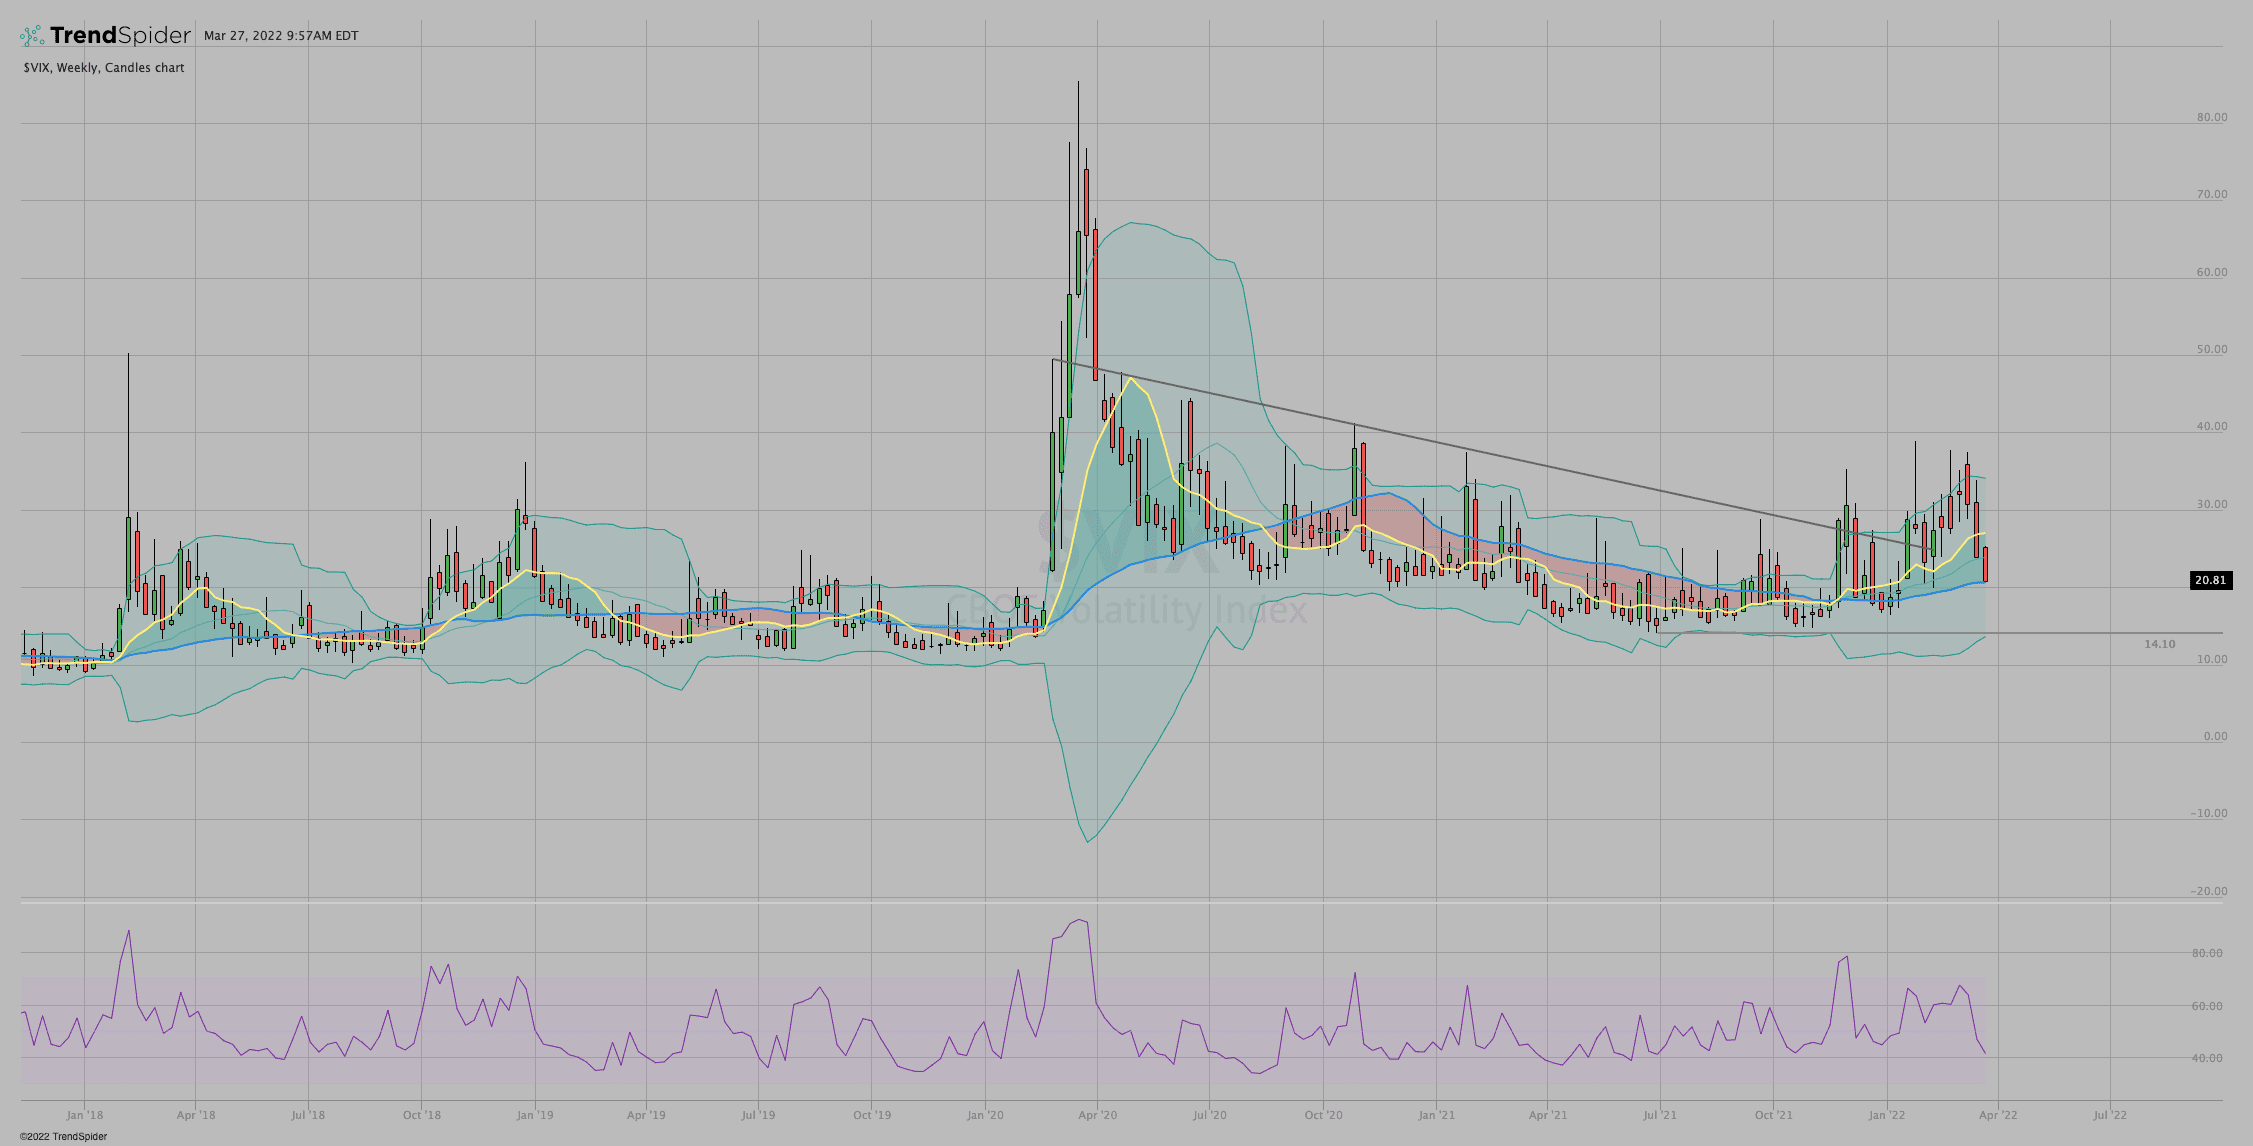
https://share.trendspider.com/chart/VIX/339539cirql
What next?
The sideways consolidation was actually more upward continuation. More layers of probability continue to show up adding to the bullish case. I remain cautious of "too far too fast", but in a bullish/buy-the-dip mindset and will work to choose entries carefully.
Adding fuel to the fire
Thanks to @Pdunuwila and @TheChartReport for pointing these out. This is the best, free, daily technical summary out there.
https://www.thechartreport.com/03-24-22/


I know, you know - "Past performance does not guarantee future results." There are no guarantees. But this helps the probabilities.
Good luck this week and trade 'em well.