

Market Update
And Fed-Day Game Plan

I am pleased to announce the launch of reader-supported subscriptions to Trading-Adventures.com. For just $15 a month, you can further support this work and enhance your Trading Adventure.
Go deeper than the indexes to analyze market moves beneath the surface.
More charts, more analysis, and more education to improve your trading and enhance your success.
Subscribe now to support this Trading Adventure and take a significant step forward on your own. It's all available for less than a cup of coffee each week.
Been here a while and enjoy the freebies? No worries. Free subscribers will continue to receive the Market Update articles twice a week.
And you can help in other ways.
Share Trading Adventures
Forward this email to friends, family, coworkers, and fellow traders
Thank you for considering a paid subscription to Trading Adventures. I look forward to supporting you on your trading journey!
The Markets
FOMC tomorrow has the markets in a holding pattern.
Expectations are leaning heavily toward a 0.25% rate cut. However, the market wants to know the Chairman’s thoughts and guidance for 2025.
Will there be more rate cuts next year?
If so, how many?
Is that because the economy is strong and healthy?
Or does he still see vulnerabilities?
This will be evident in the press conference and the revised “dot plot.”
Meanwhile, we’re entering the seasonally strong period of December. It’s a time that often brings a year-end rally, taking us to the next potentially significant seasonal tendency, The Santa Claus Rally.
Here is another view of the average action to complement the one shown last week.
From Jeffrey Hirsch (@almanactrader)—
![[December Seasonal Chart Update]](https://substackcdn.com/image/fetch/$s_!ClrV!,f_auto,q_auto:good,fl_progressive:steep/https%3A%2F%2Fsubstack-post-media.s3.amazonaws.com%2Fpublic%2Fimages%2Fc7ccc0f6-577c-4be0-bb80-e9ed416a312c_900x484.jpeg "[December Seasonal Chart Update]")
The Charts
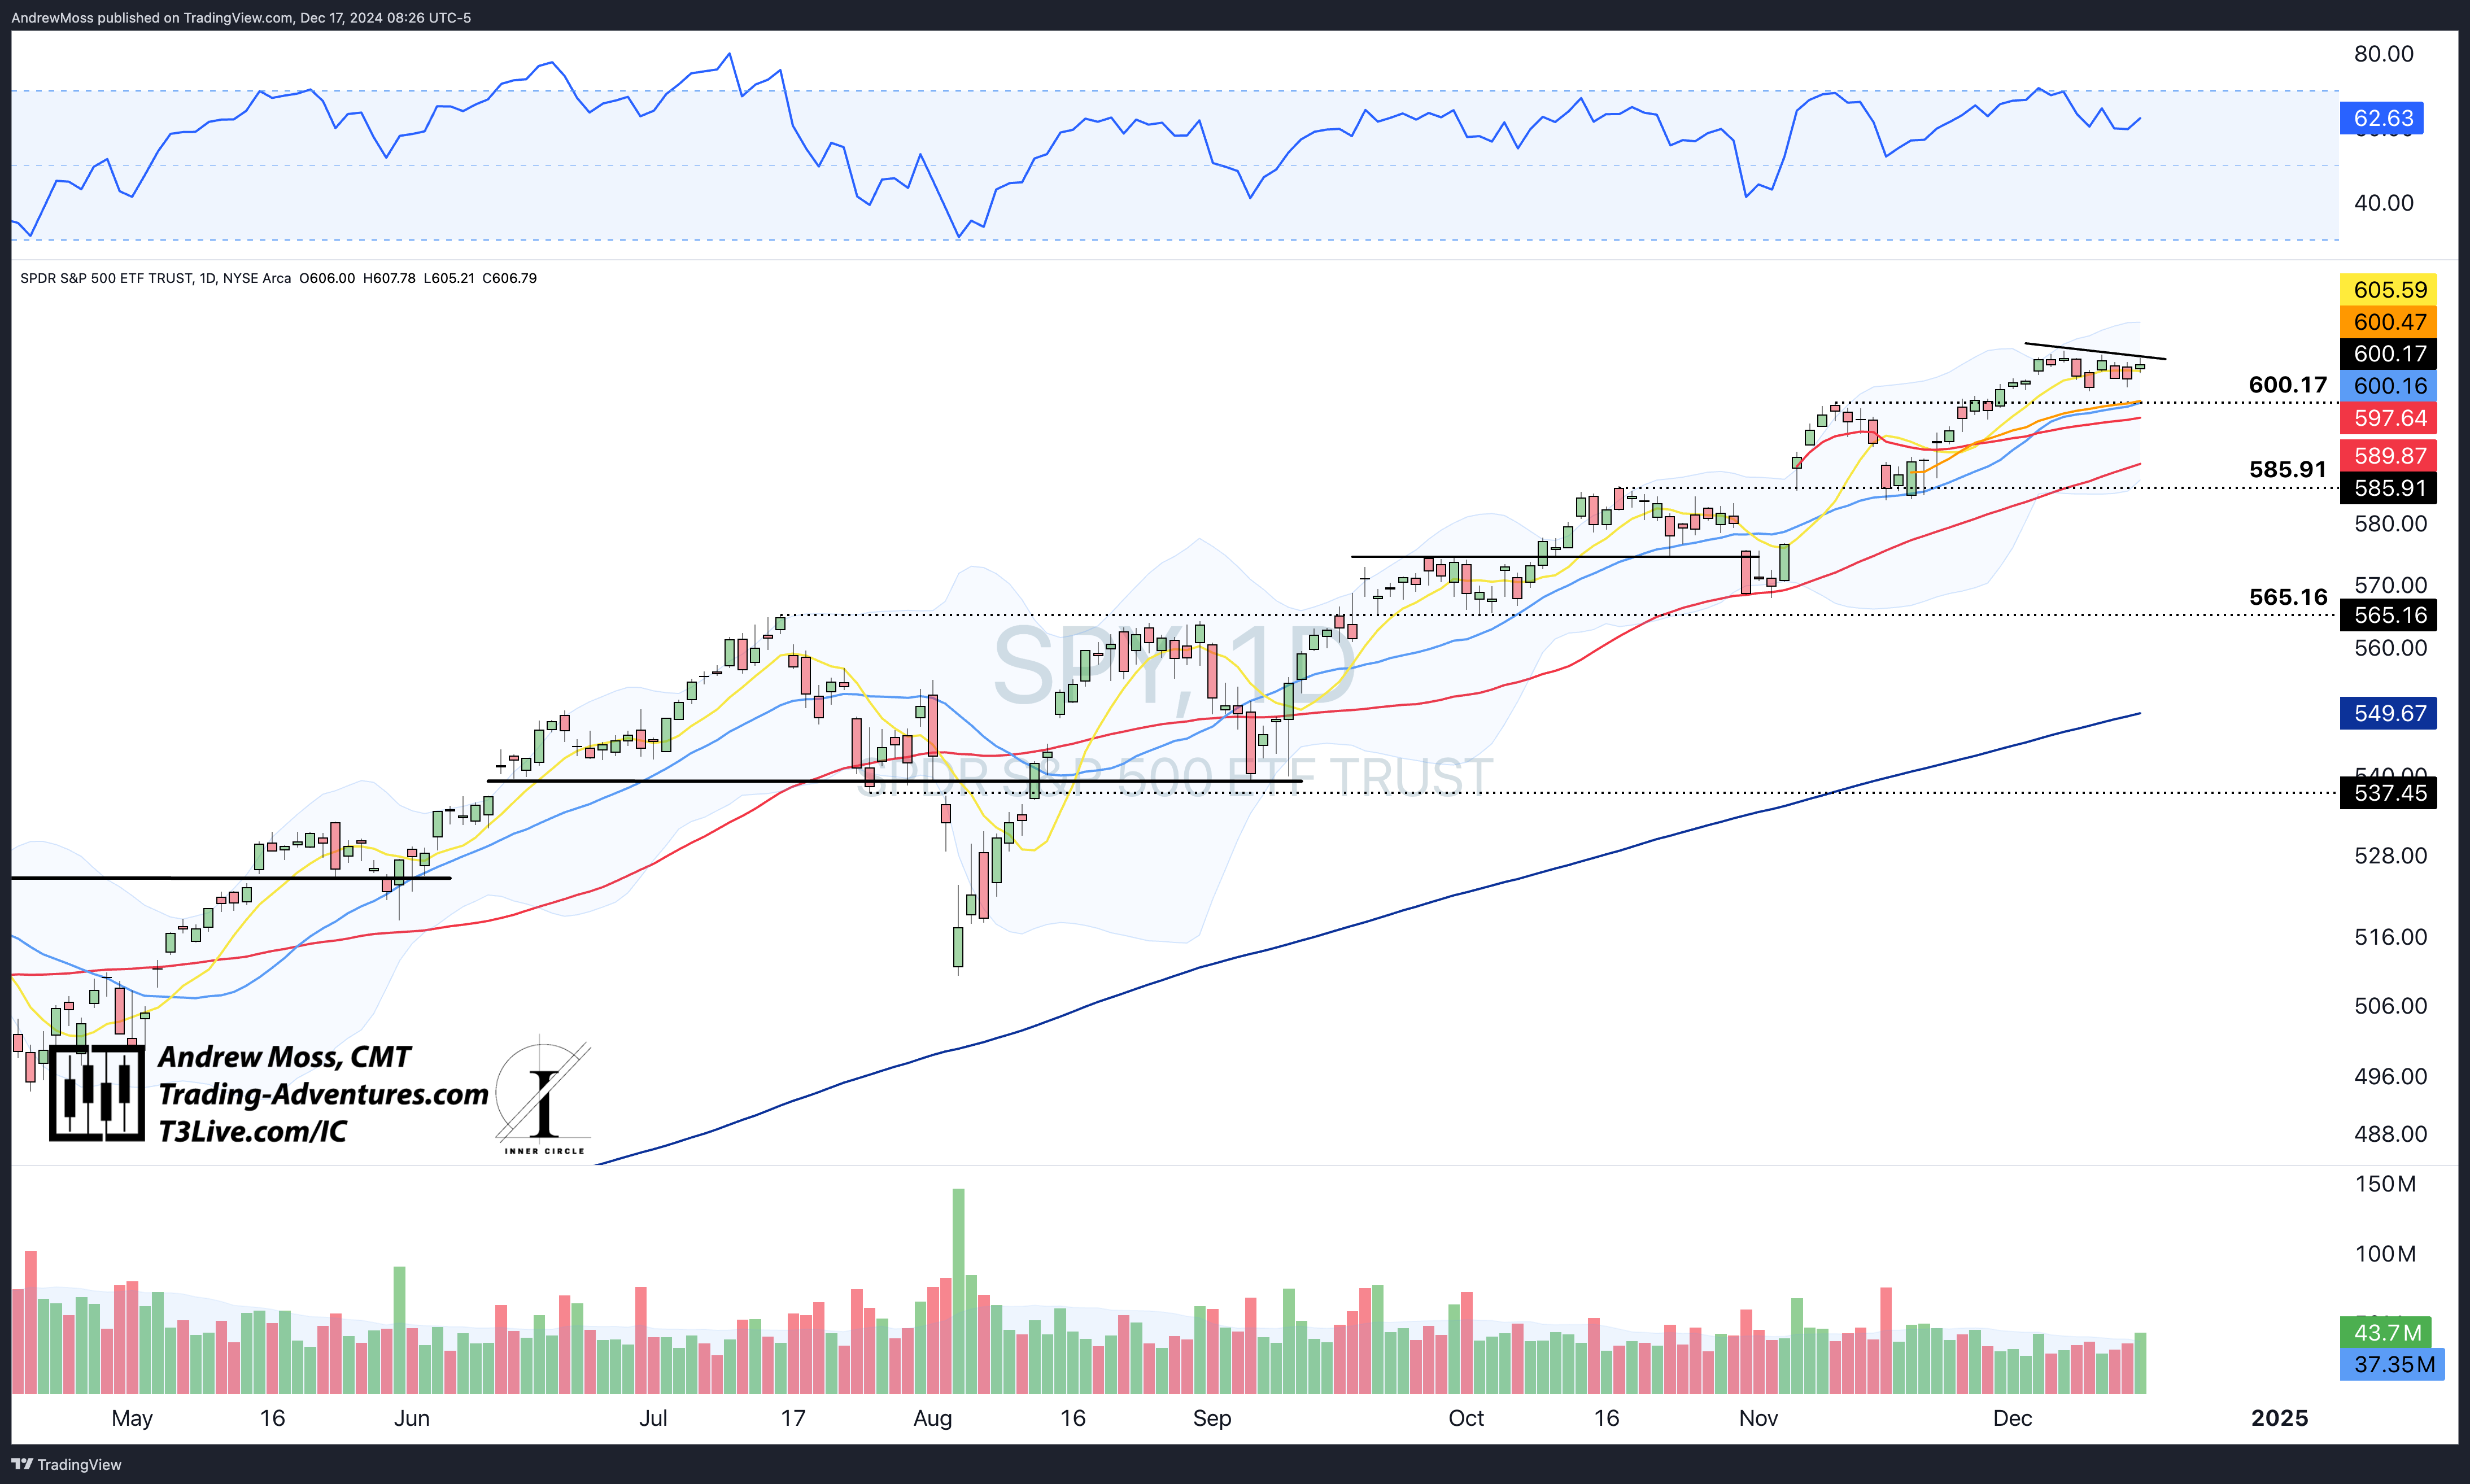
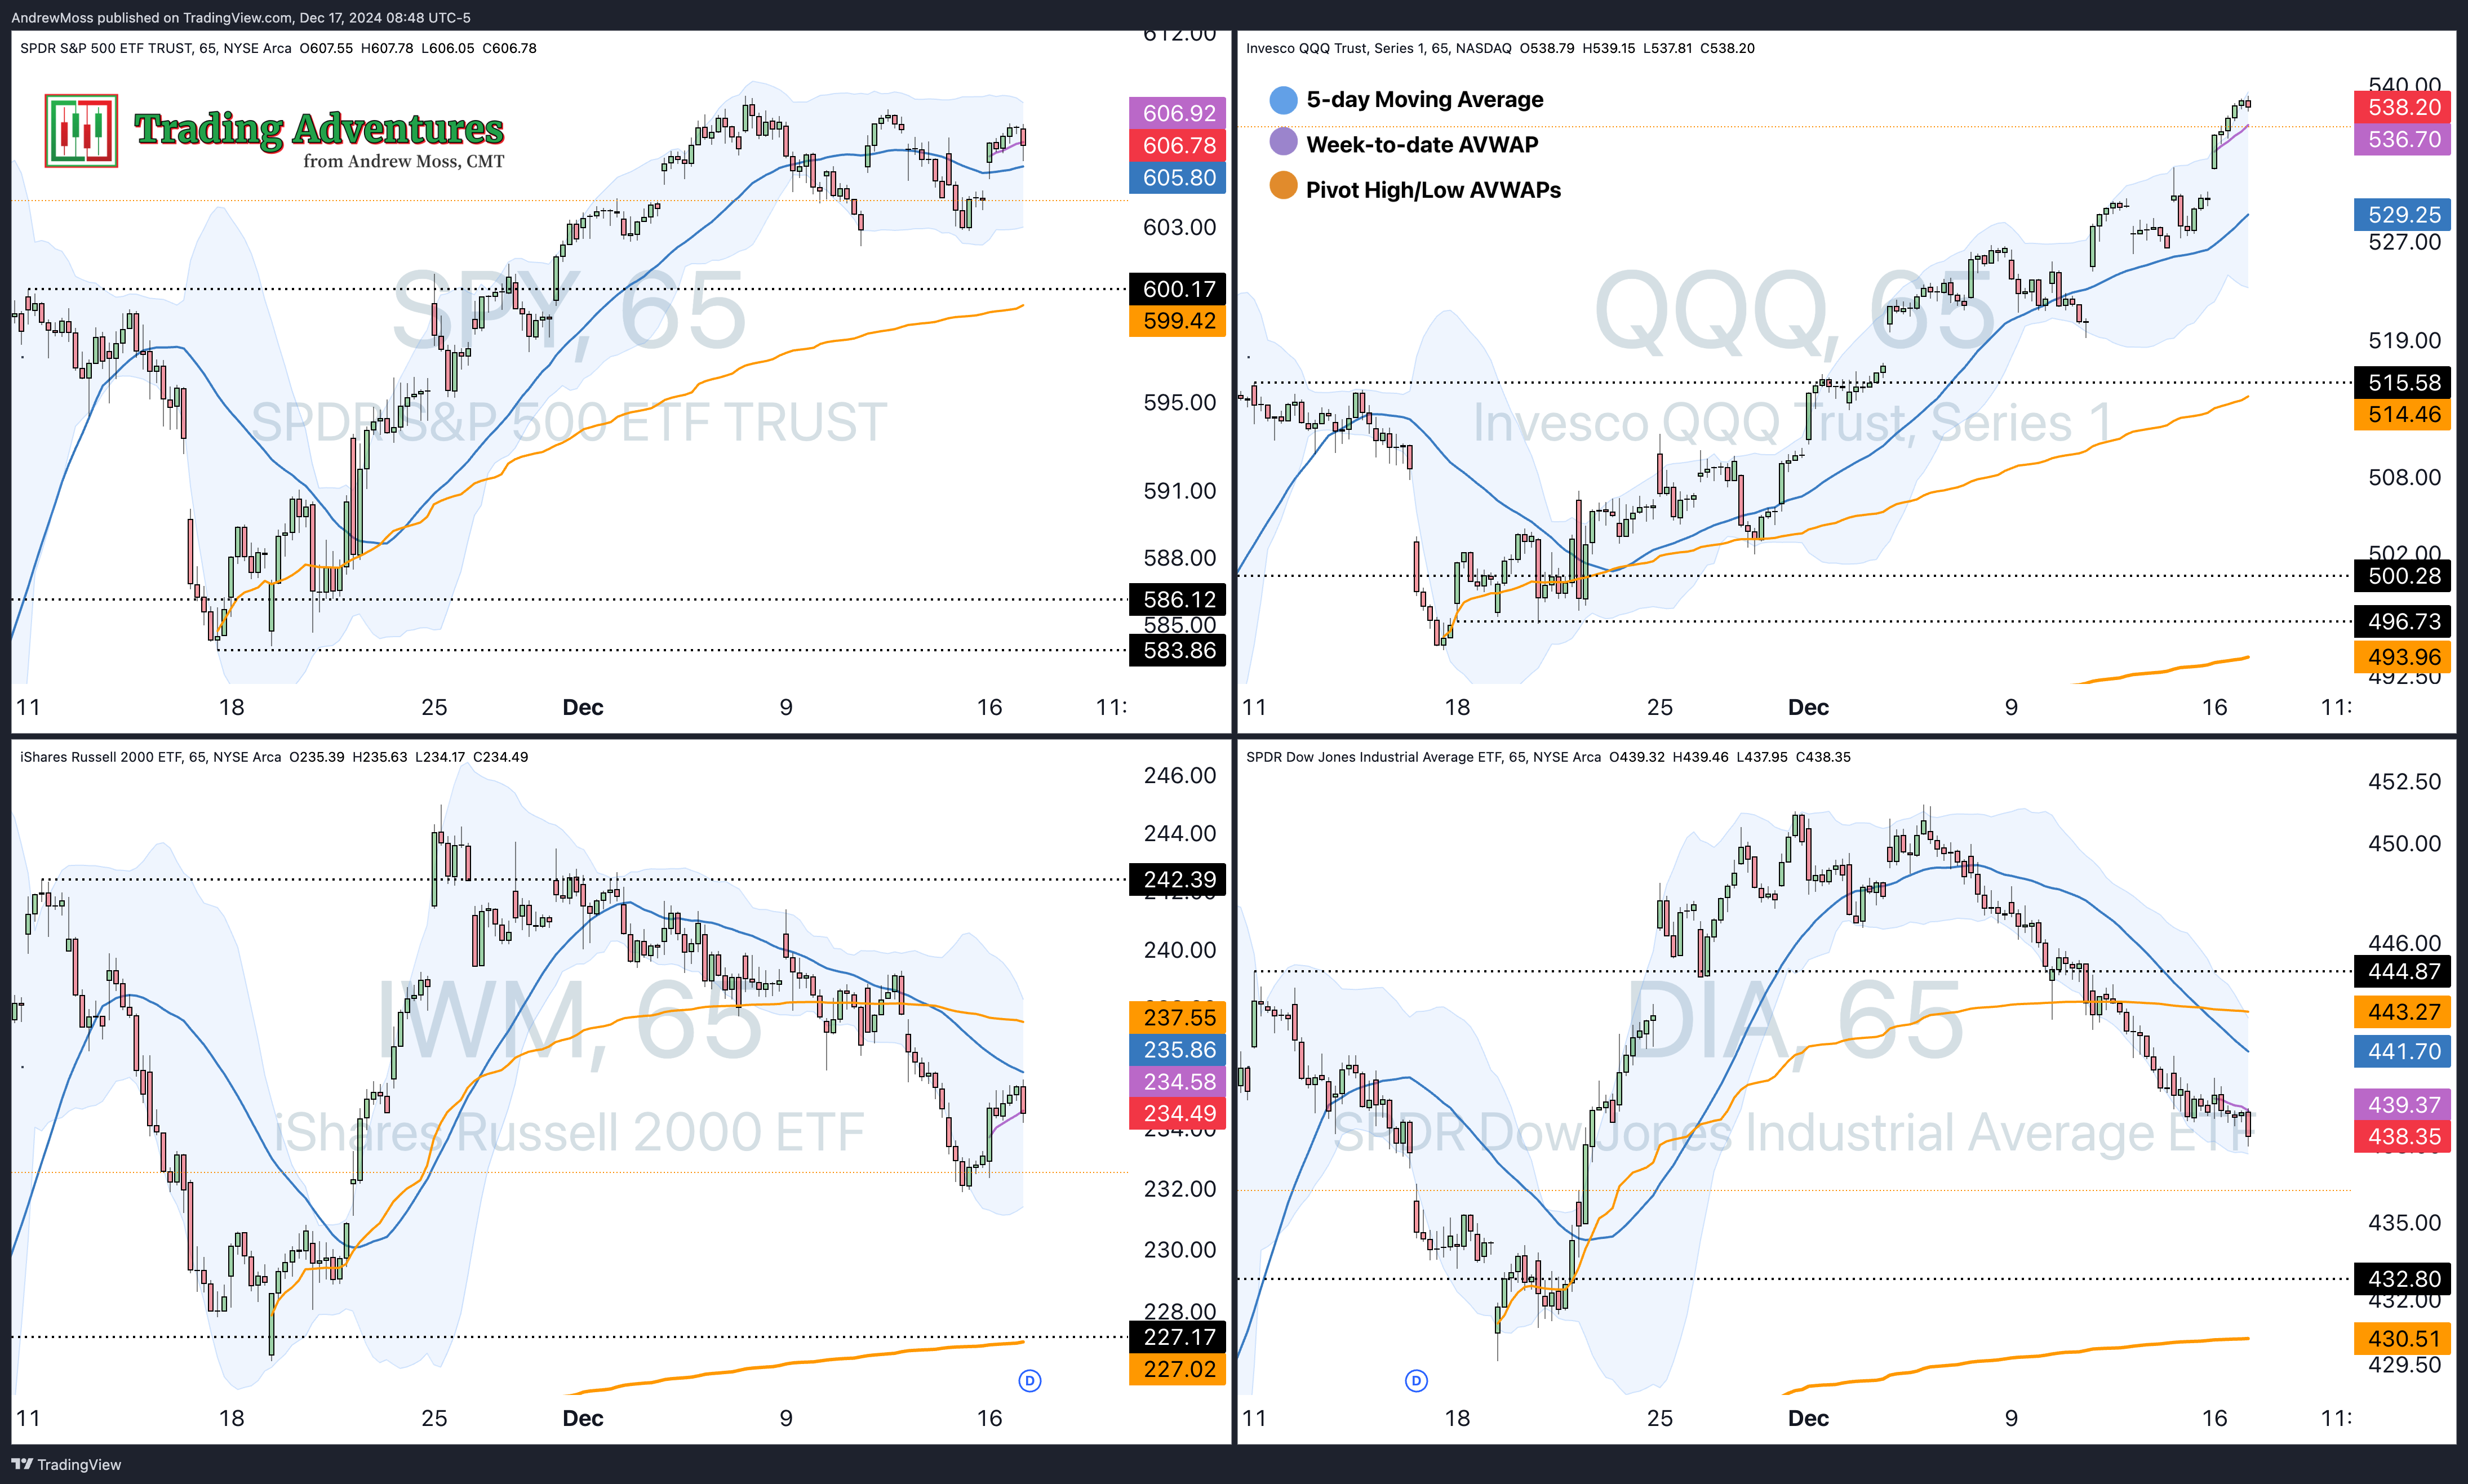
SPY has been bouncing around the 8-day MA for six days, forming a bullish consolidation. A clear short-term trendline is in place and a pivot high of $609.07 to mark the upper boundary. A move beyond that would signal a breakout and the beginning of the next leg higher.
Below, the already significant support area near $600 continues to build as the 21-day MA and a couple of AVWAPs gather there.
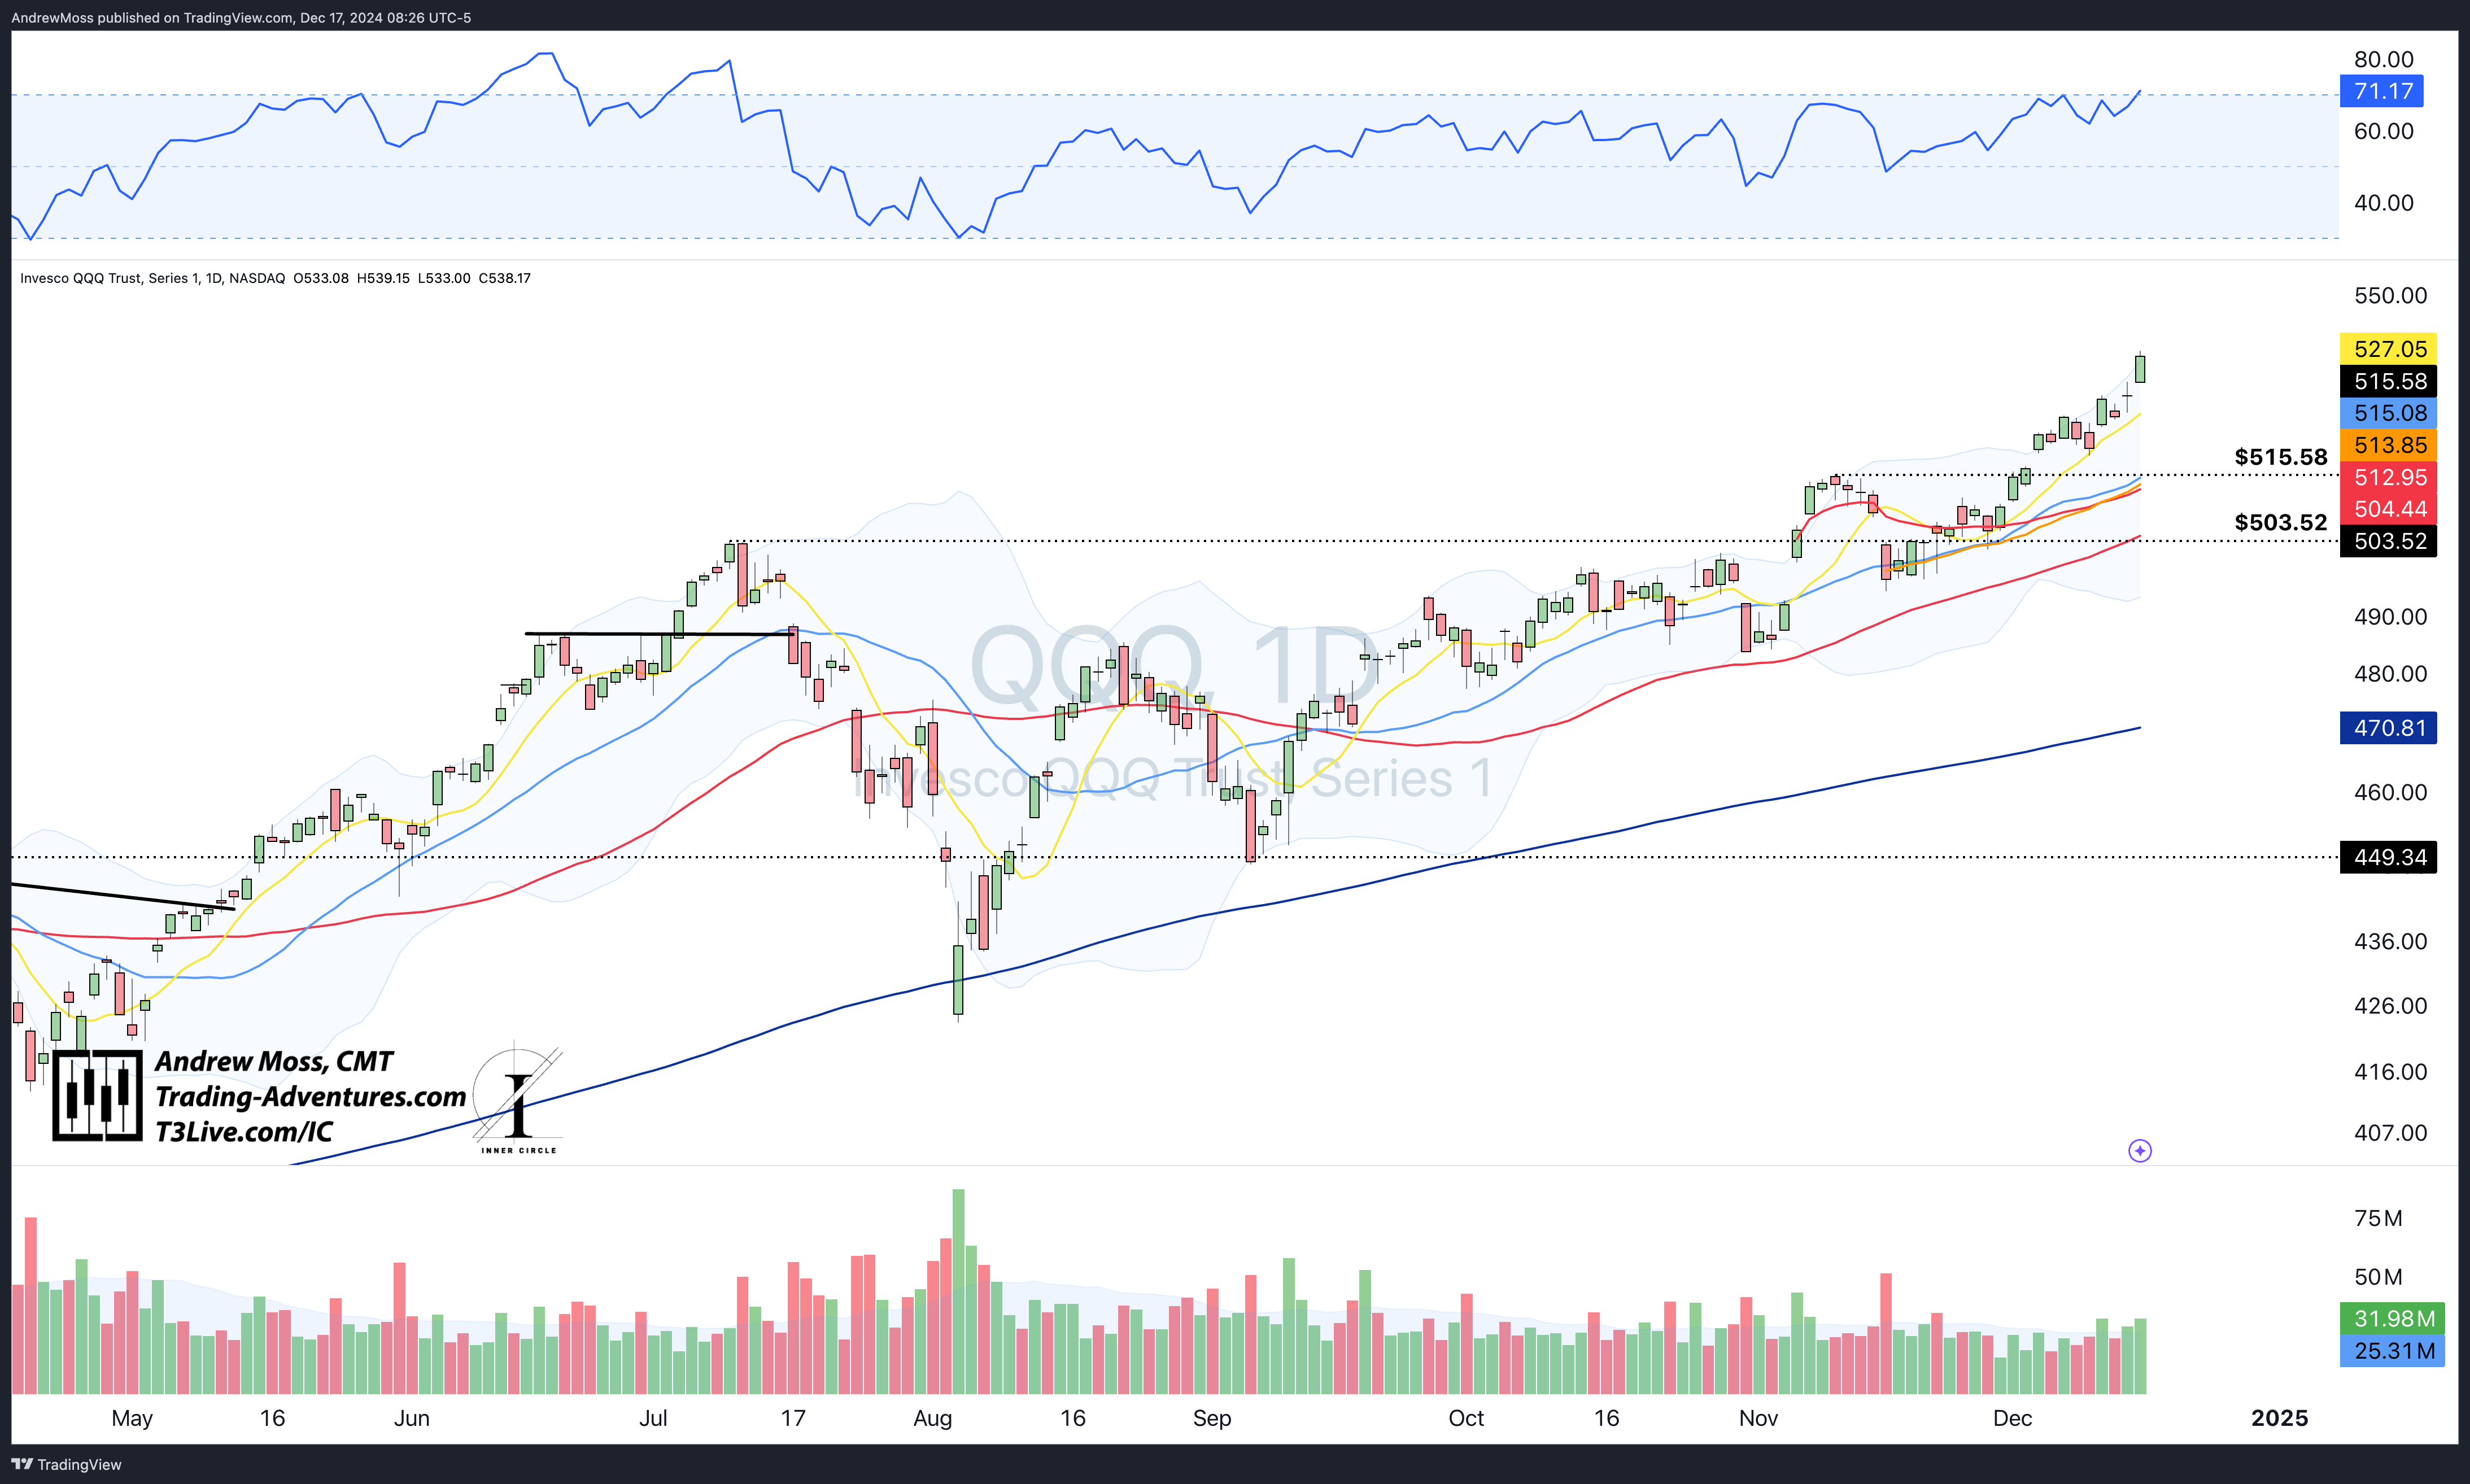
QQQ keeps rising steadily. There is no consolidation pattern here. RSI is reaching overbought status, and the price is extended above the 8-day MA. Some moderation could happen, and the $515 is still the first significant support area.
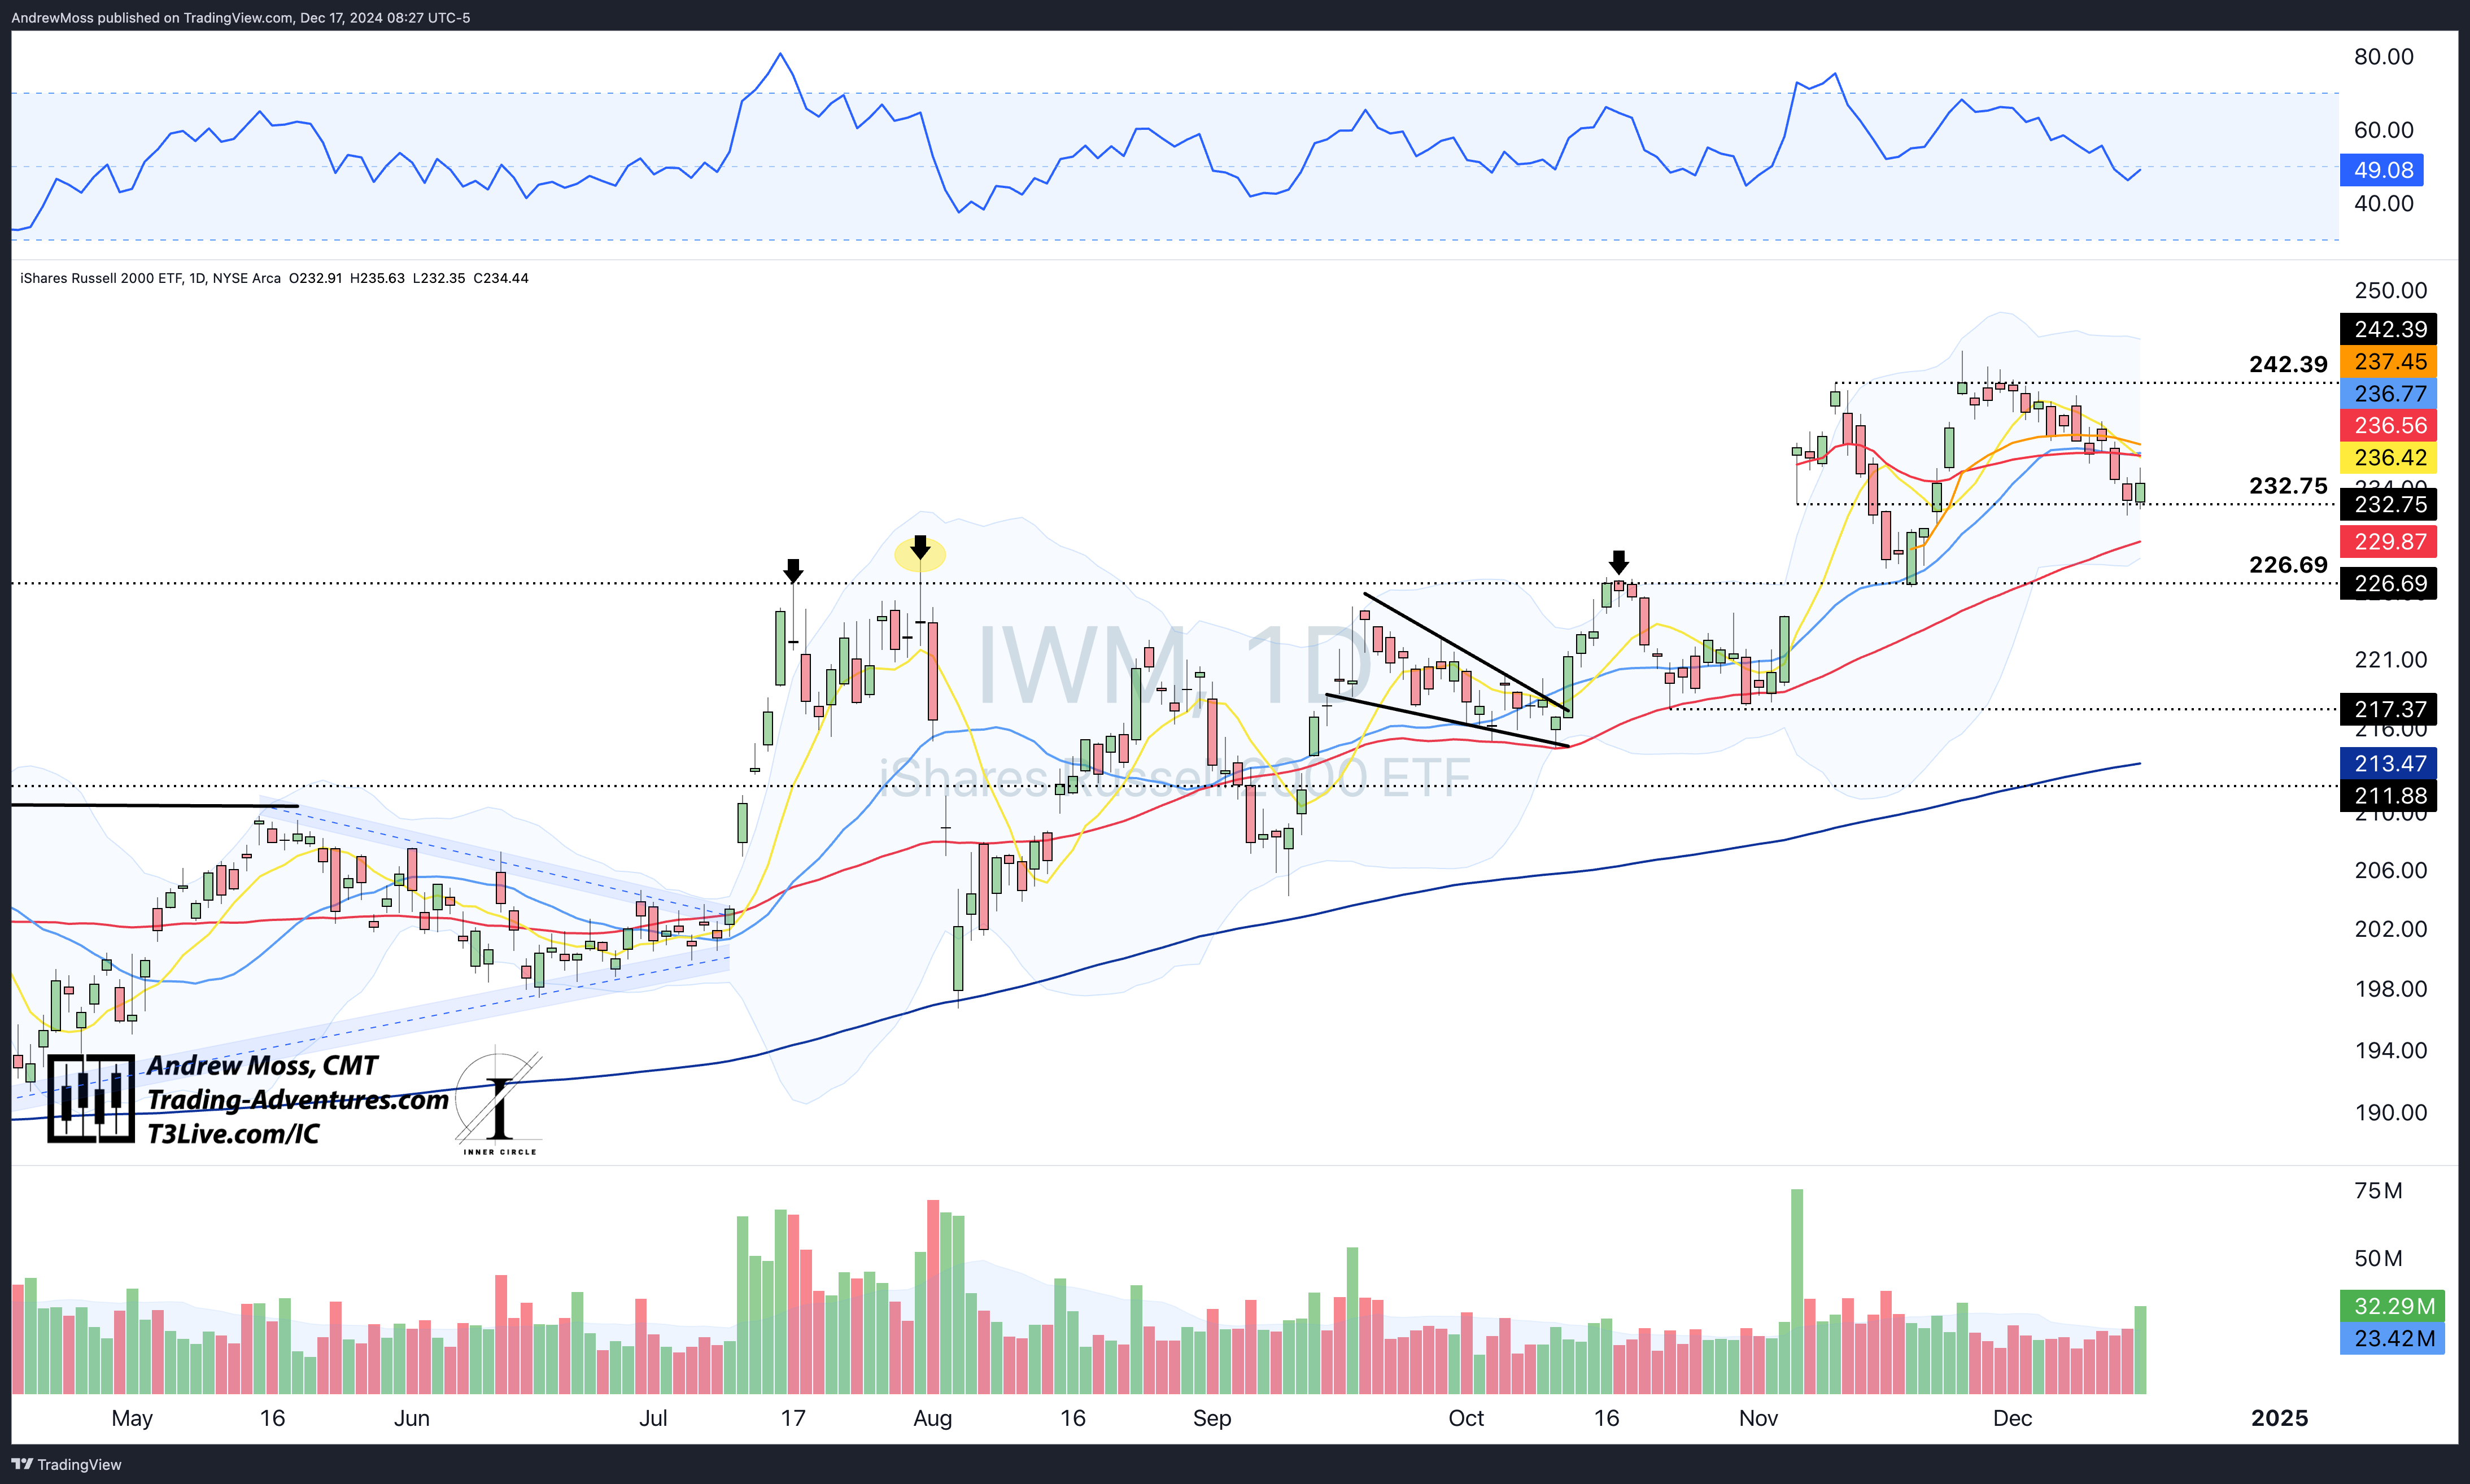
IWM has been suffering as bonds fall and rates rise. This morning, $232.75 is trying to hold again. The 50-day MA is the next spot below, near $230.
Overhead, there are several layers of potential resistance near $236-$237.
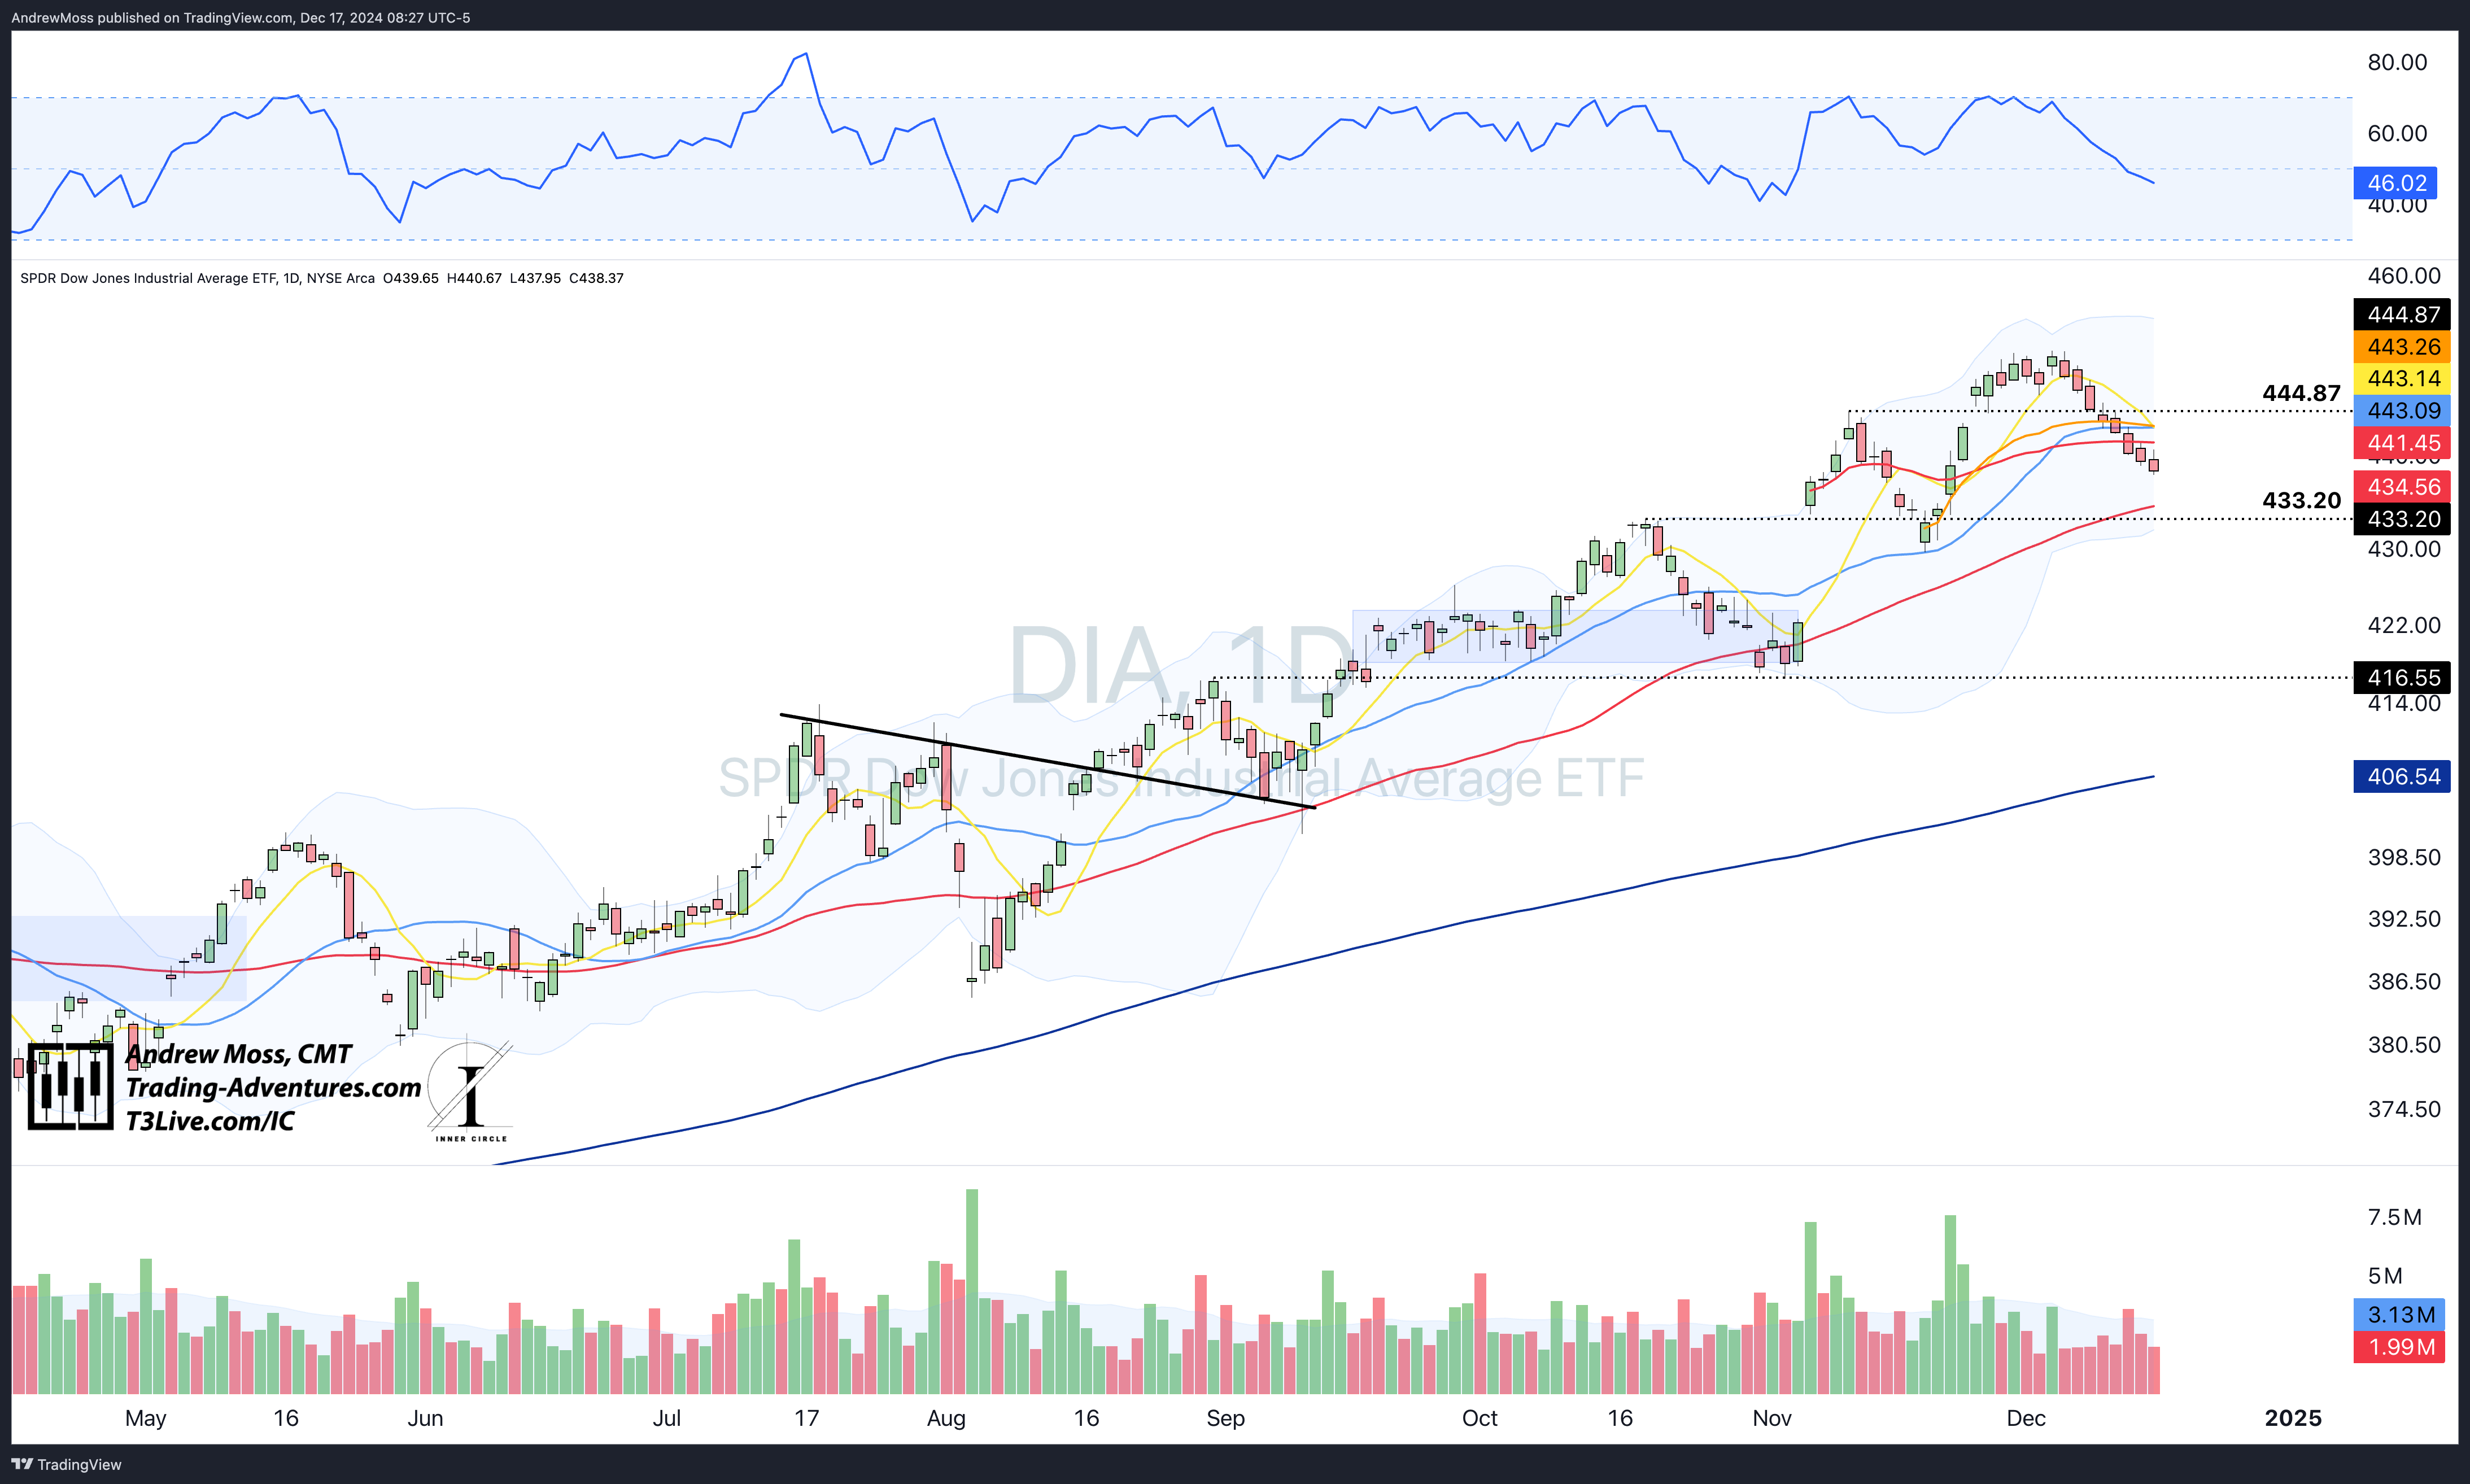
DIA has printed eight consecutive red candles and is lower again this morning. How long before it sees a bounce? There is a pivot level and the 50-day MA near $433-4 and $443-4 could be stiff resistance above.
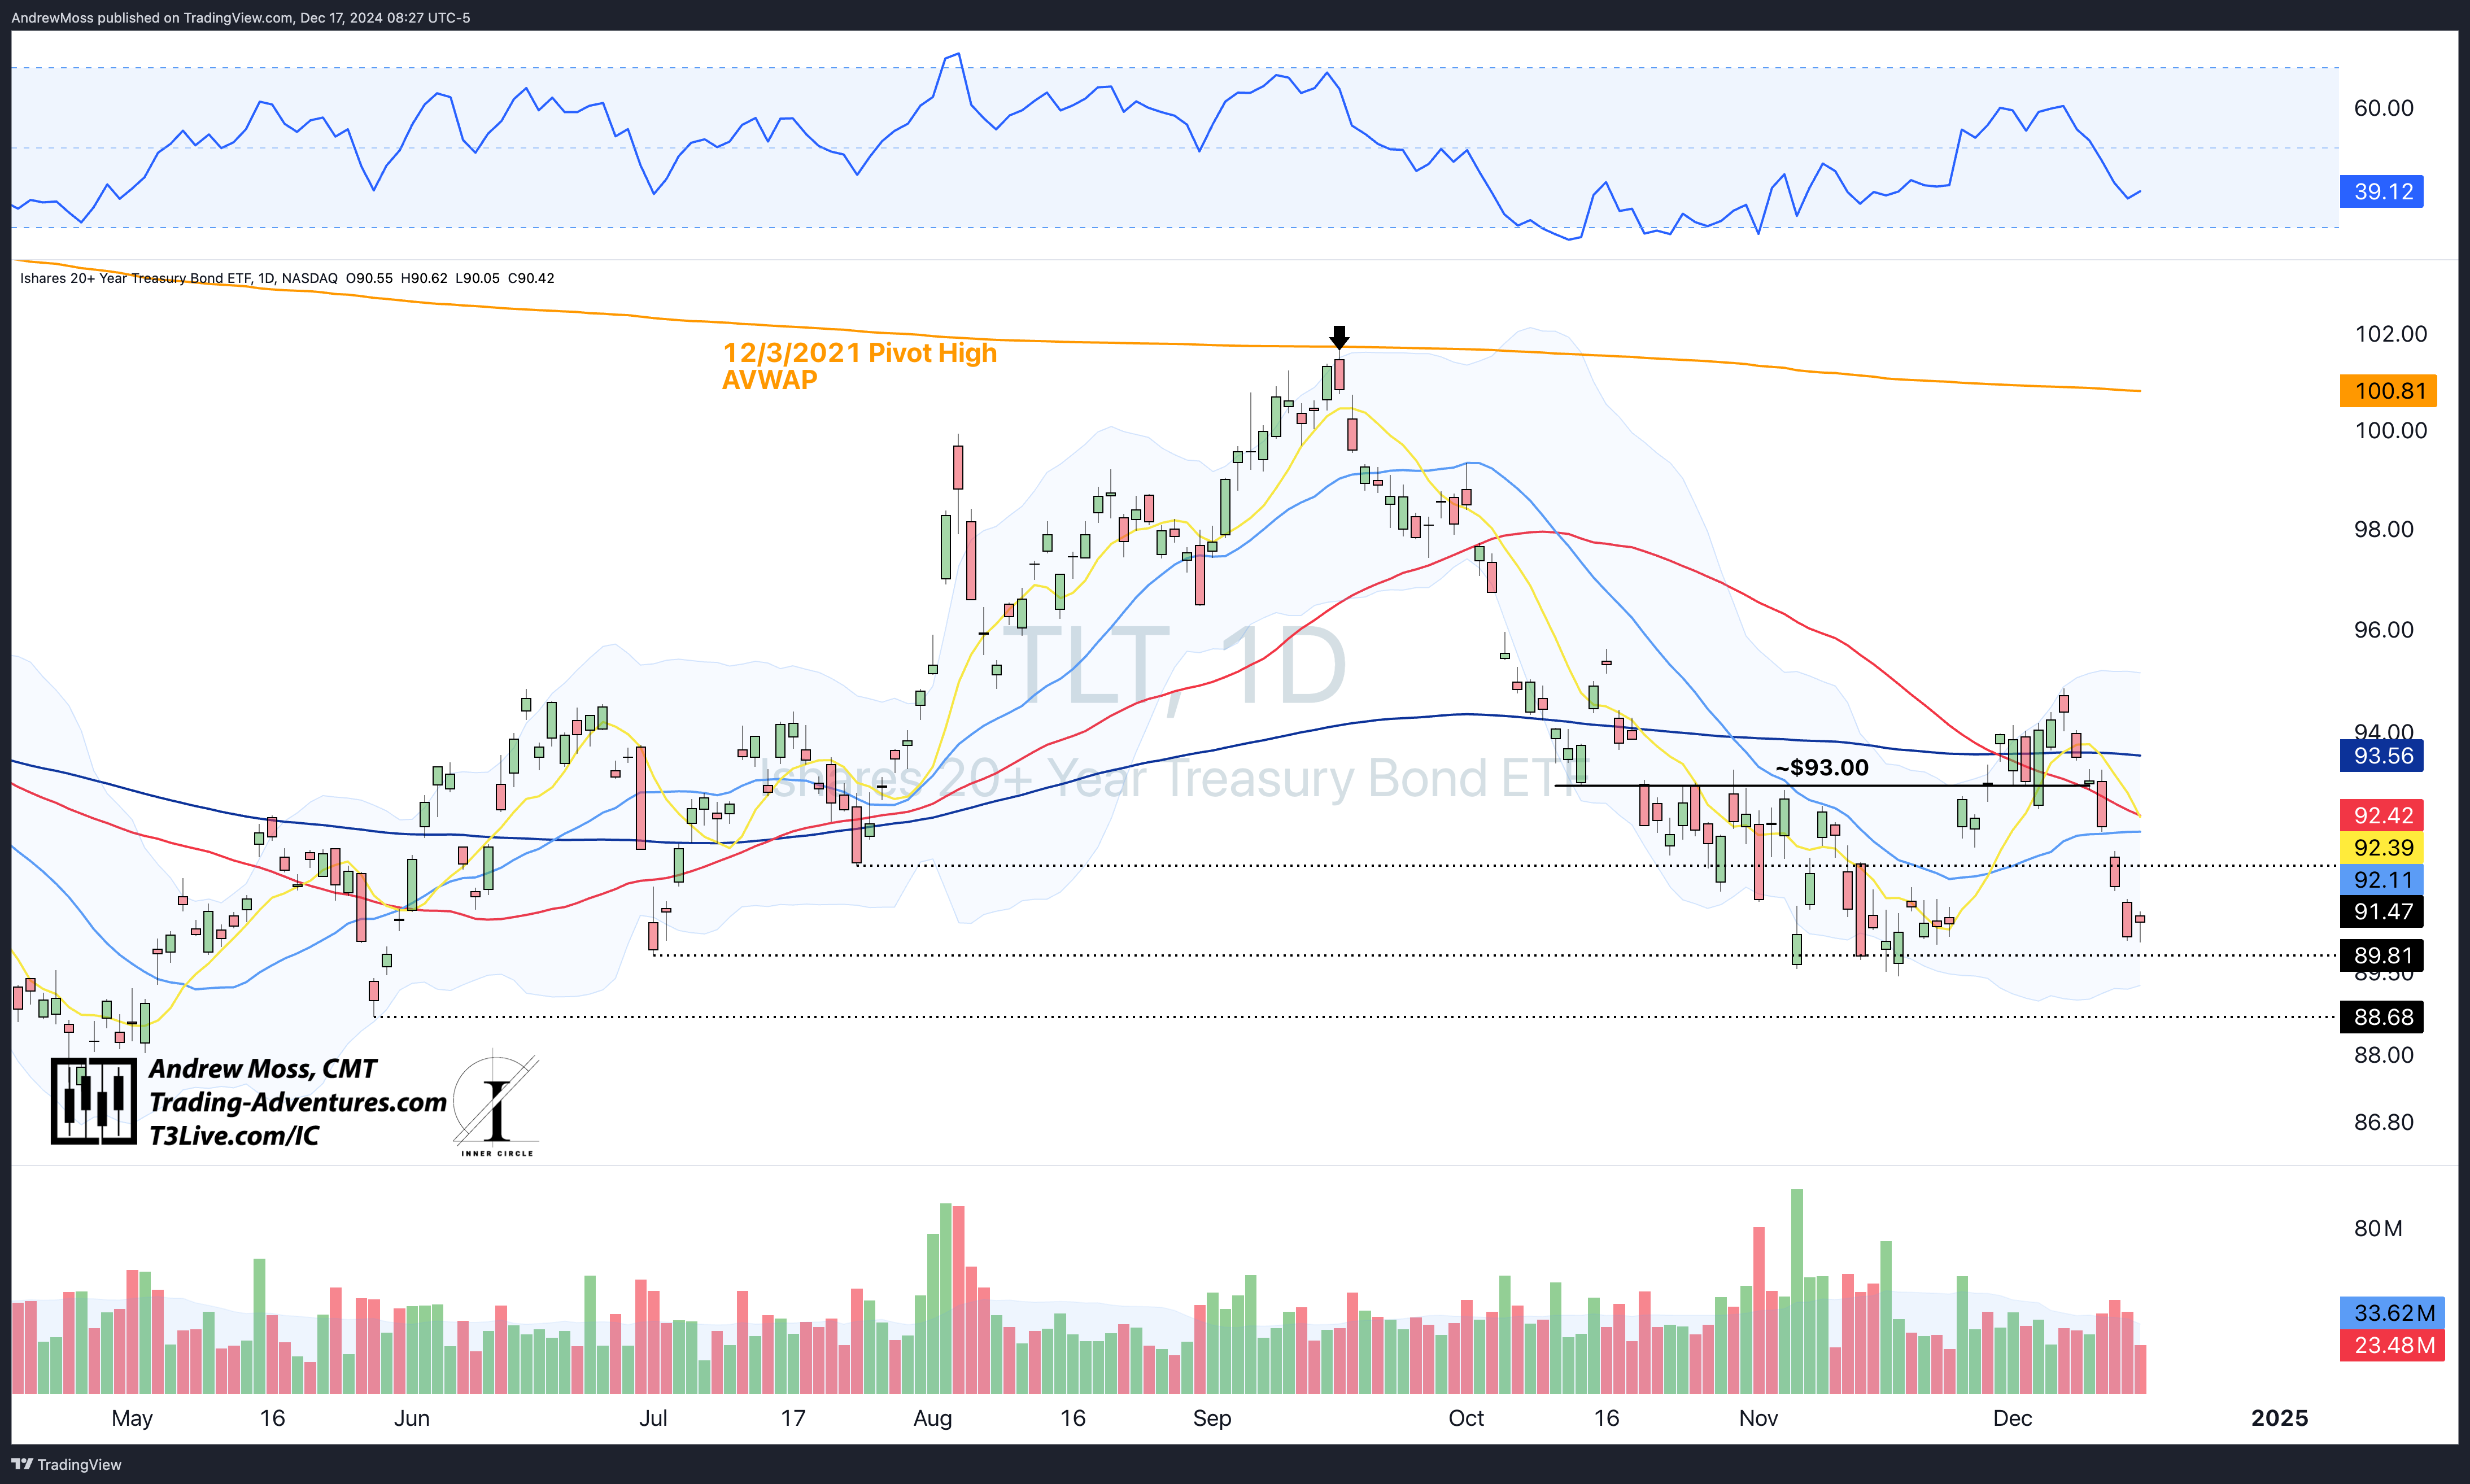
TLT has entirely given back the recent rally and once again we’re left to watch the ~$90 area for potential support.
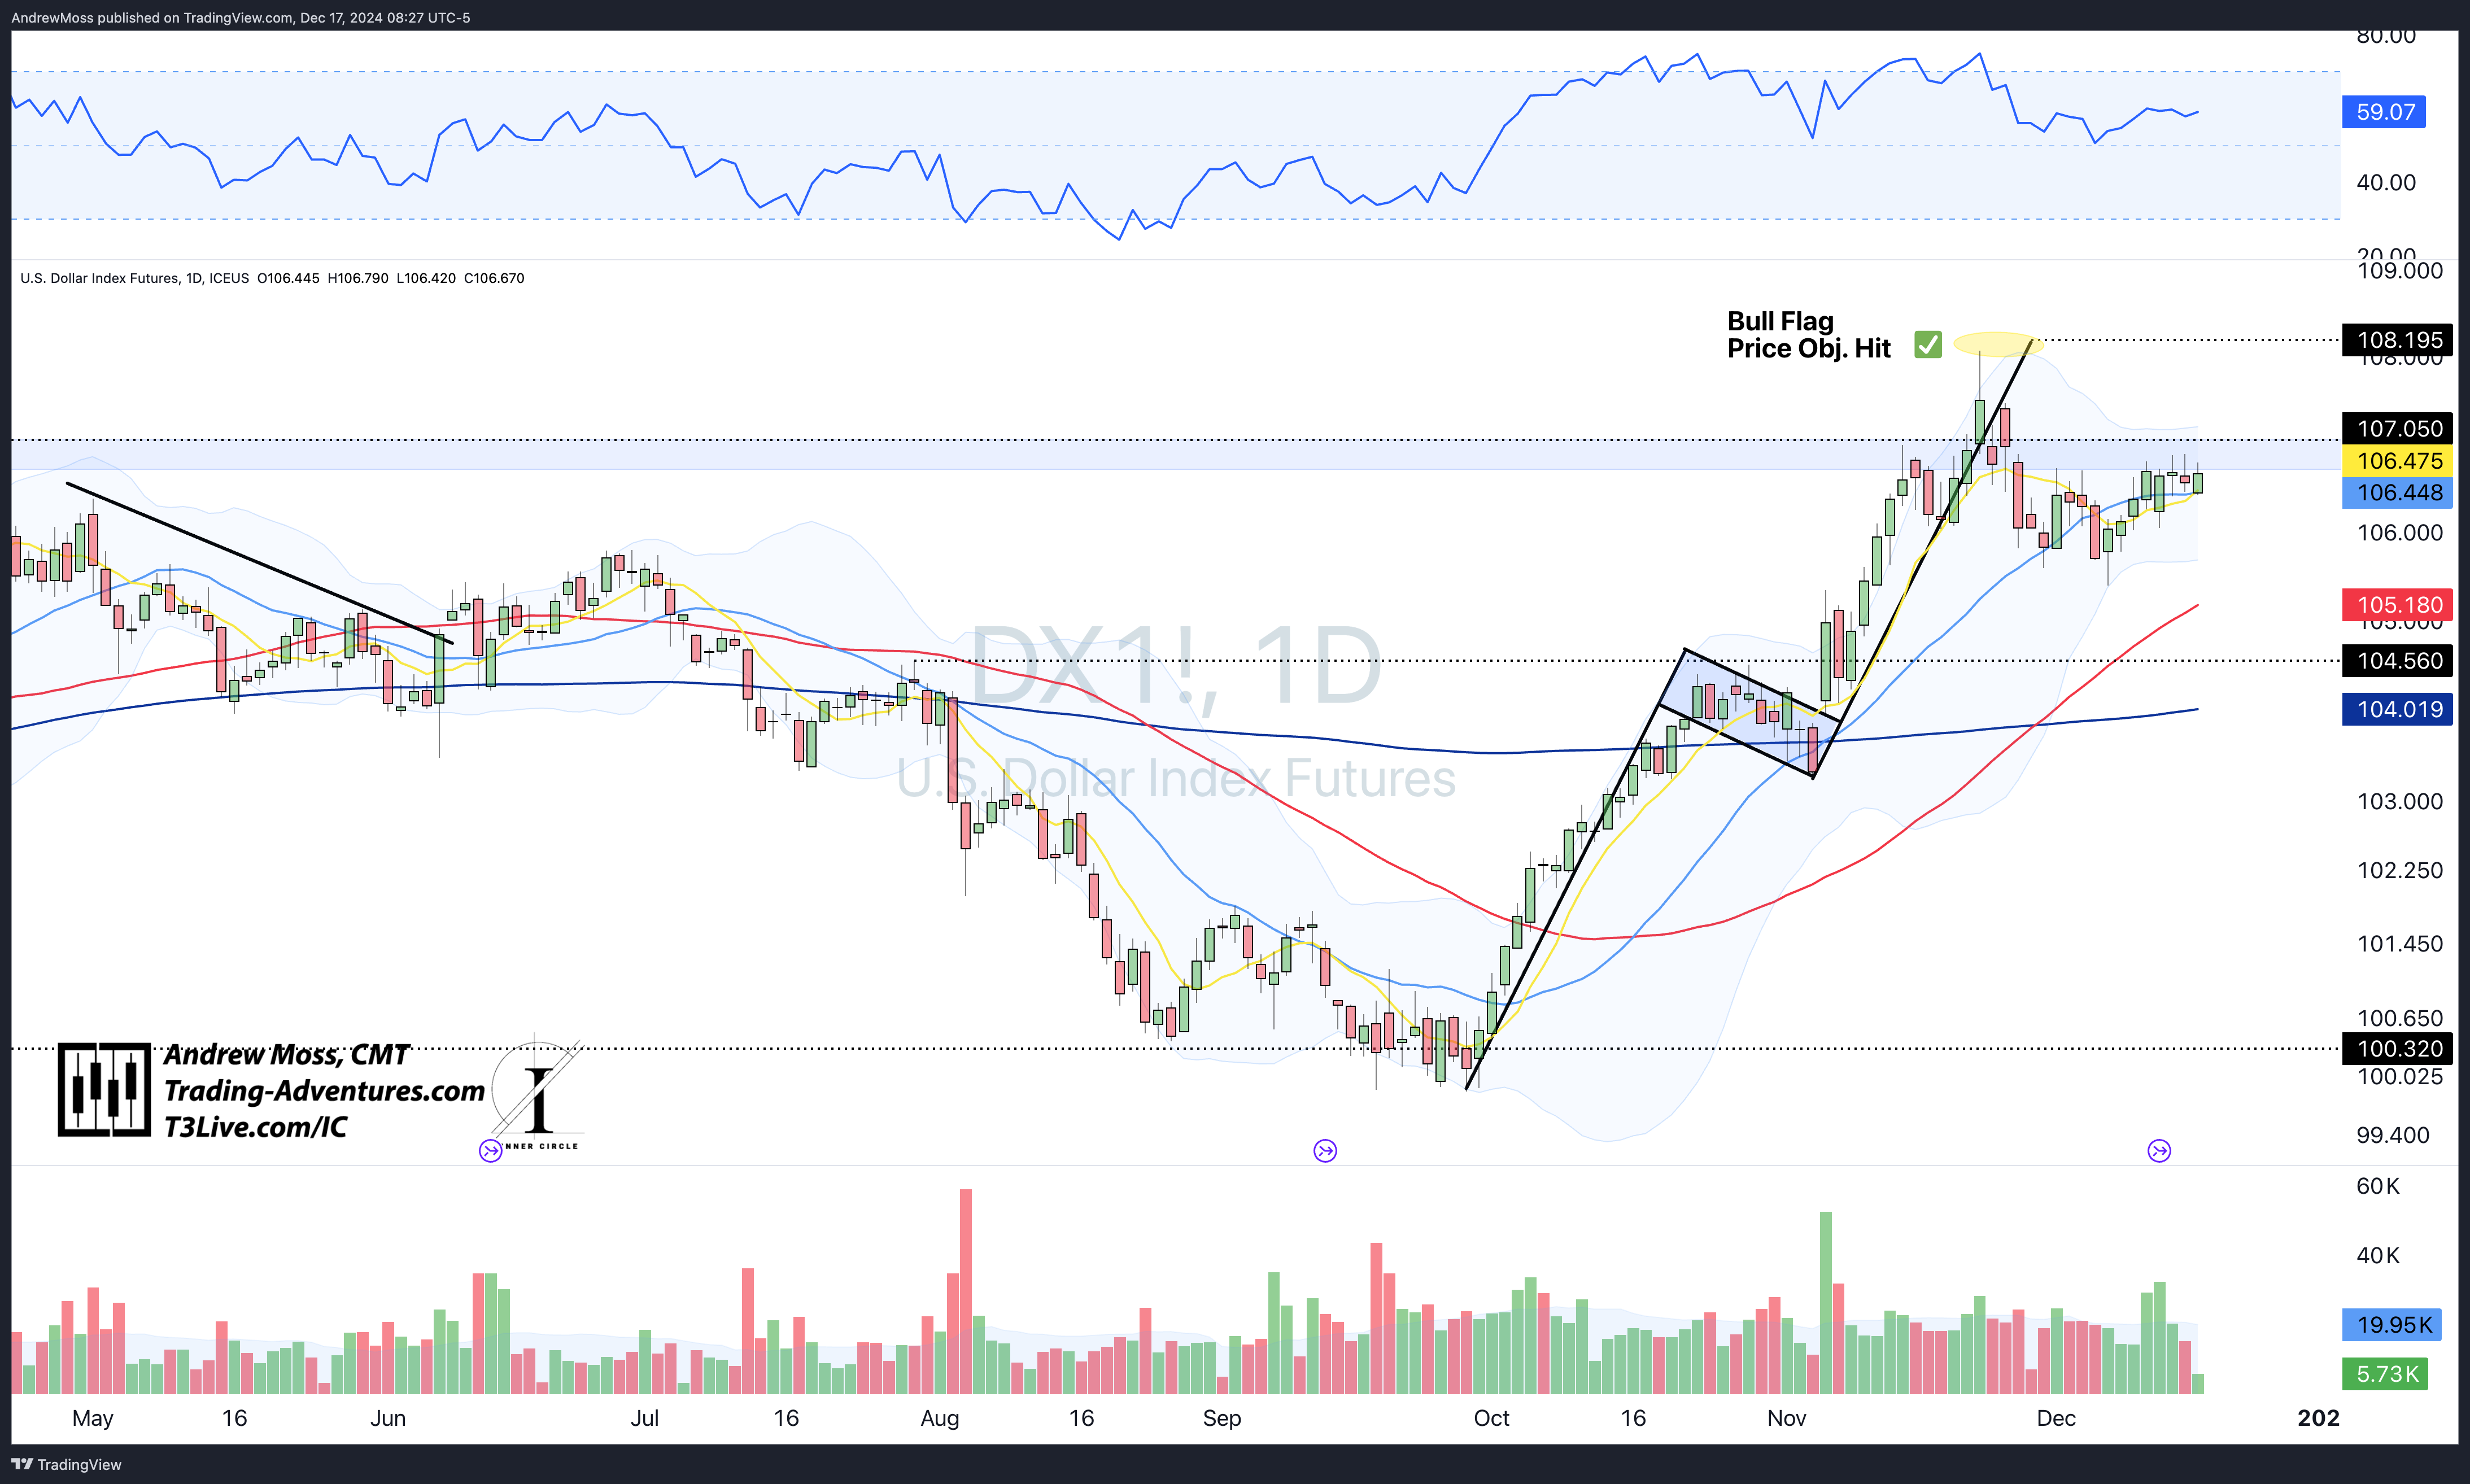
DXY is bumping up against resistance with the 8 and 21-day MAs close by.
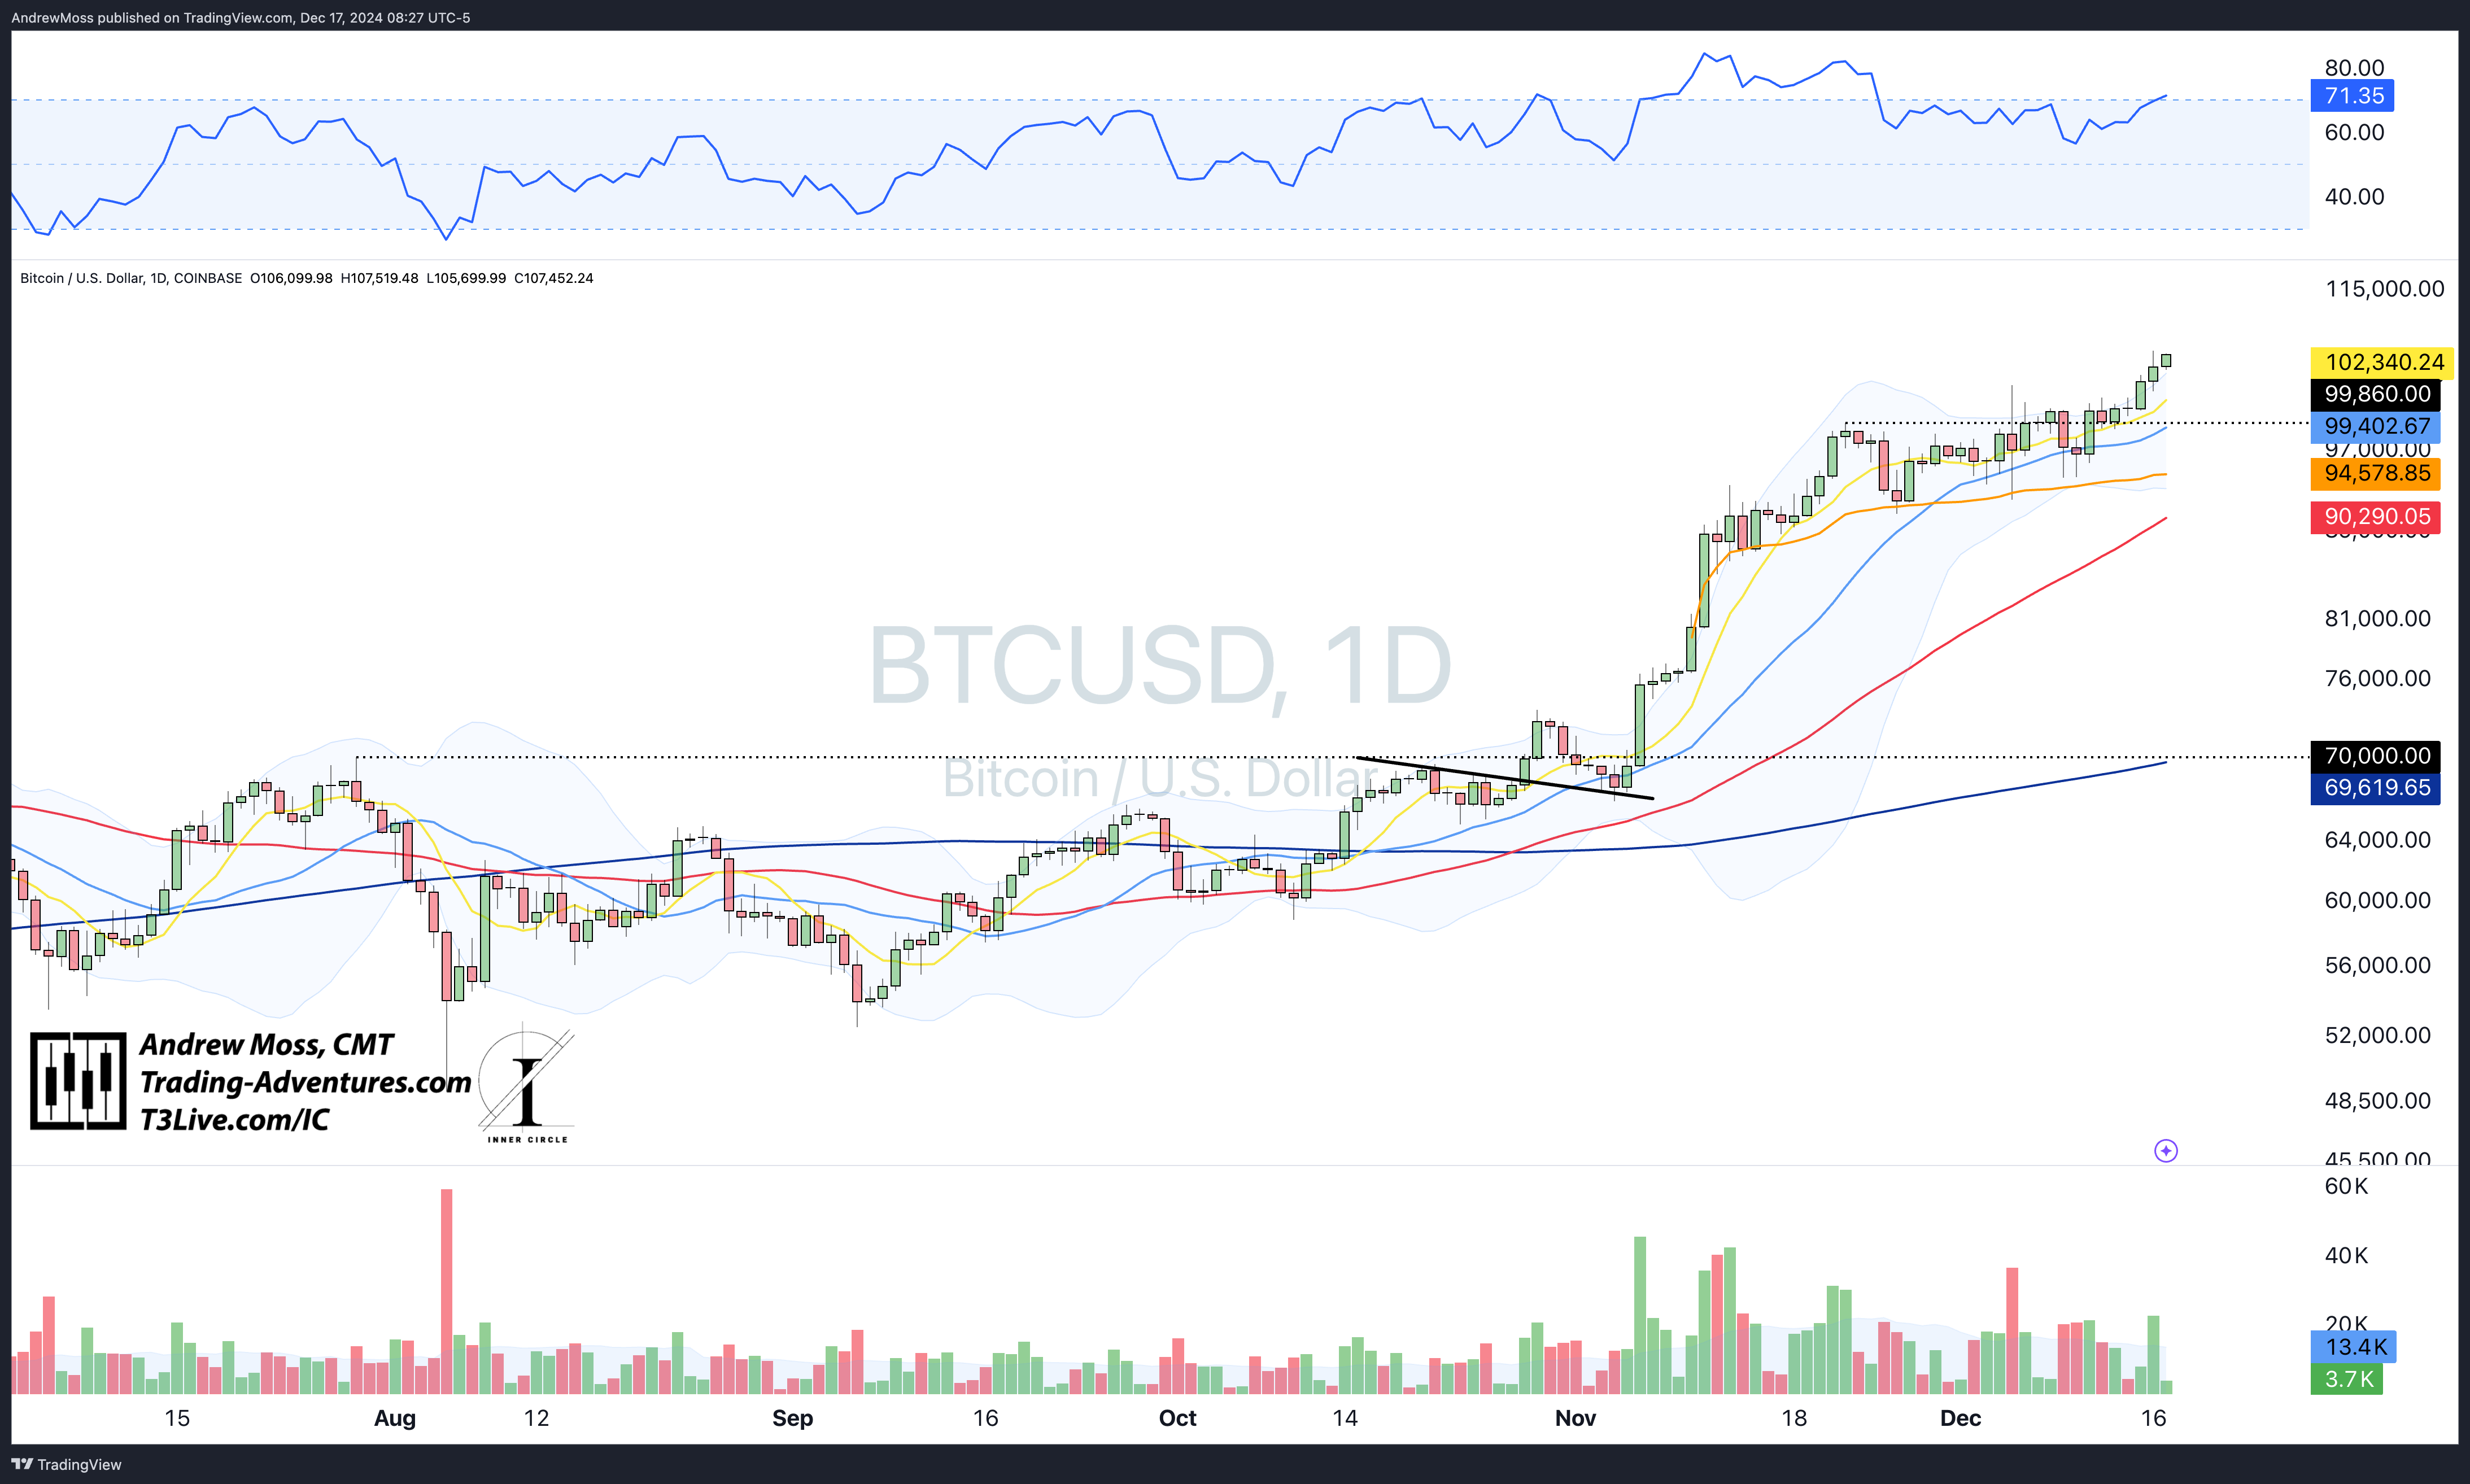
BTCUSD makes new highs again, trading above $107,000 this morning.
The Trade
Mixed markets (see below for one more chart) mean there is less to do. Plus, tomorrow is a binary event (the Fed). All of this is offset by the seasonal tendency toward strength.
The plan? Be picky. Focus on the best setups. We don’t have to take every trade.
More individual names are coming in a mid-day video update.
🗺️ The Roadmap
2/4 indexes are below their falling 5-day MAs. It pays to do less in those areas while staying alert for potential trades. Meanwhile, the tech trade has been strong. Trim and trail positions there, booking some profits along the way.
The Disclosures
***This is NOT financial advice. This is NOT a recommendation to buy, sell, or trade any security. The content presented here is intended for educational purposes only.
Looking For More?
Elevate Your Trading Adventure Even Further With These Offerings.

EpicTrades Options Newsletter
Real-time trade ideas and insights, providing actionable trading insights focusing on options trades with short-term horizons, aiming to capitalize on weekly market movements.
The approach includes detailed reasoning for trades, specific options, and profit targets, focusing on quick gains with less time commitment required from subscribers.

The Inner Circle
The Inner Circle is a Virtual Trading Floor (VTF) at T3 Live. It’s the group I’ve been working and trading with since 2022. You may have noticed the logo in the watermarks on my charts.
Founded by David Prince and led by him, Rick March, and Kira Turner, the Inner Circle is a community of elite traders, including hedge fund managers, family office heads, corporate executives, financial advisors, and even professional poker players.
Fundamental, Macro, and Technical Analysis all combine to find and discuss the best opportunities in current markets.

Good stuff. Thank you for the update Andy!