

Market Update
A Feeble Bounce Attempt

The Markets
Stocks cling to support levels while giving a very feeble bounce attempt after yesterday's Fed-induced decline.
The Dow Jones industrial average was the only index of the four majors to finish on the positive side today. The S&P 500 was just barely on the negative side while the NASDAQ 100 and Russel 2000 each finished down about 0.50%
This all comes after Jerome Powell sent prices plummetting yesterday with remarks that the Federal Reserve bank may slow its pace of interest rate cuts in 2025.
Let’s revisit the charts and support levels to see where things may go from here.
I am pleased to announce the launch of reader-supported subscriptions to Trading-Adventures.com. For just $15 a month, you can further support this work and enhance your Trading Adventure.
Go deeper than the indexes to analyze market moves beneath the surface.
More charts, more analysis, and more education to improve your trading and enhance your success.
Subscribe now to support this Trading Adventure and take a significant step forward on your own. It's all available for less than a cup of coffee each week.
Been here a while and enjoy the freebies? No worries. Free subscribers will continue to receive the Market Update articles twice a week.
And you can help in other ways.
Share Trading Adventures
Forward this email to friends, family, coworkers, and fellow traders
Thank you for considering a paid subscription to Trading Adventures. I look forward to supporting you on your trading journey!
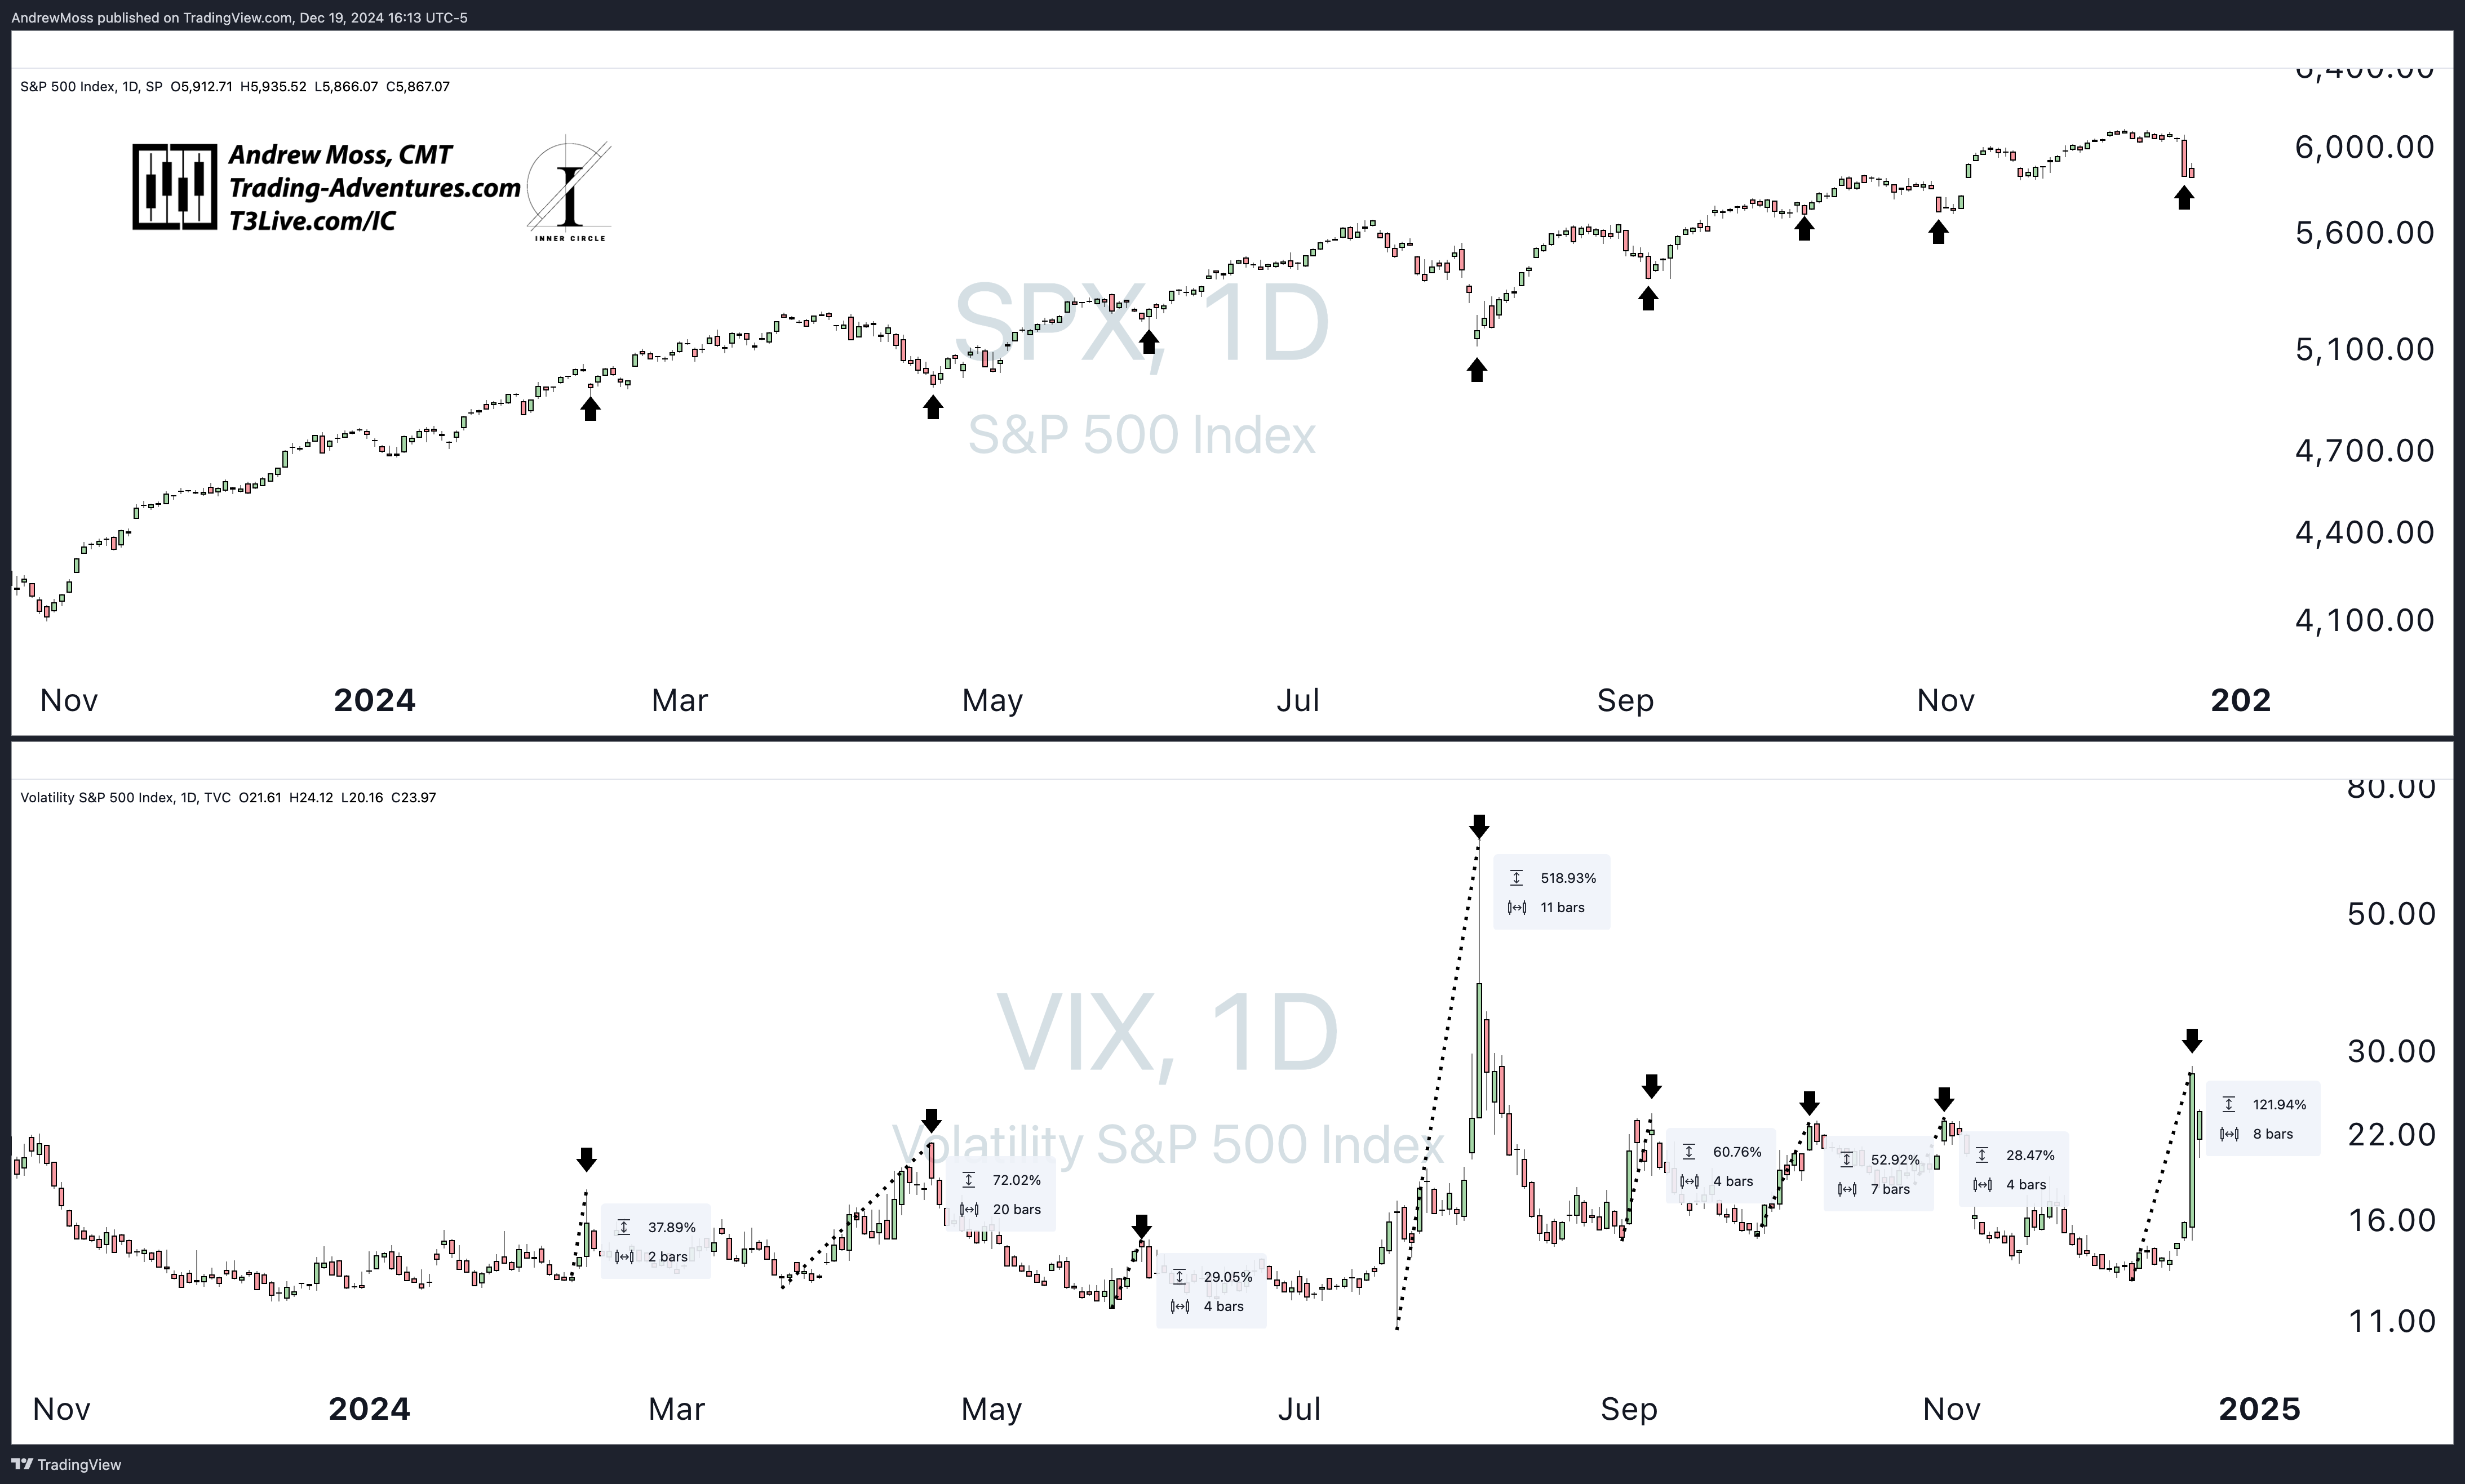
SPX & VIX
This chart from earlier this morning shows the S&P 500 index next to the VIX volatility index. The VIX uses SP 500 options pricing data to measure volatility expectations and is commonly called the fear index. Higher volatility expectations equal elevated levels of fear and uncertainty in the markets.
This chart clearly shows the close relationship between a sudden rise in fear and a short-term bottom in stock prices.
While there can be a ‘chicken/egg’ argument about this relationship one thing remains as fact. Volatility does not tend to hang around at elevated levels after drastic spikes higher. And less fear usually brings more comfort to buyers.
The Charts
SPY rests squarely on the ~$586 pivot area for a second day. It did manage a rally to the 50-day MA today but could not hold on to the gains. Volume is nearly twice the average while the RSI dips into the 30s.
More about RSI: In bull markets like we’ve been experiencing, RSI doesn’t always hit a sub-30 level. In fact, it hasn’t done that once this year, though it has gotten close a time or two (yellow highlights).

QQQ closed the day slightly under the Nov. pivot high of $515.58 and near the post-election AVWAP. RSI is barely under the halfway mark. Volume is high.

IWM closed lower again, and it may test the $217 area. ~$213, the 200-day MA, and ~$212, a level with extensive price history dating back to 2020, levels of interest below.
RSI is < 30, and we’ve seen two days of volume nearly double the average.

DIA is back near its price range from mid-September (blue shaded area) and the VWAP anchored at the August low. Both of these may combine to provide support near $423. If not, $416 (a pivot high) and $407 (the 200-day MA) may be next.

TLT is the ‘rug pull’ of the month. After getting back over all of its key moving averages earlier in the month, it is now back below each of those and every potential pivot support level from recent months.

DXY Dollar futures are back to recent highs and don’t look to be slowing down.

BTCUSD is back for another test of the Nov. 10 breakout AVWAP - a level that has provided support many times.

The Trade
Watch support levels.
For individual issues, sectors, and indexes, we want to see evidence that prices have stopped going down. They must do that before they can bounce. Know your support levels and be ready for confirming action.
If you’re unsure where to look, ask me here, and I’ll check the chart.
And to take a playbook straight from Alphatrends (Brian Shannon, CMT), remember that you don’t have to buy the dip. You can buy strength after the dip.
If you don’t know what that means, have a look here —> Don't Buy The Dip
(You may need to be logged in to X)
The Disclosures
***This is NOT financial advice. This is NOT a recommendation to buy, sell, or trade any security. The content presented here is intended for educational purposes only.
Looking For More?
Elevate Your Trading Adventure Even Further With These Offerings.

EpicTrades Options Newsletter
Real-time trade ideas and insights, providing actionable trading insights focusing on options trades with short-term horizons, aiming to capitalize on weekly market movements.
The approach includes detailed reasoning for trades, specific options, and profit targets, focusing on quick gains with less time commitment required from subscribers.

The Inner Circle
The Inner Circle is a Virtual Trading Floor (VTF) at T3 Live. It’s the group I’ve been working and trading with since 2022. You may have noticed the logo in the watermarks on my charts.
Founded by David Prince and led by him, Rick March, and Kira Turner, the Inner Circle is a community of elite traders, including hedge fund managers, family office heads, corporate executives, financial advisors, and even professional poker players.
Fundamental, Macro, and Technical Analysis all combine to find and discuss the best opportunities in current markets.
