Markets Stumble, Bitcoin Wavers: Caution Lights Flash Red
Monday Market Update - March 10, 2025


The Markets
Back on February 22, my Weekly Chart Analysis outlined three conditions that would signal increased caution or outright bearishness in the markets:
Resolutions lower in relative strength (RS) charts.
A selloff exceeding seasonal norms.
Deeper disruptions to buying rotation.
As of March 1, only one of these boxes was checked (see my post here). Fast forward to today, March 10, and all three have now been triggered. The relative charts closed last week at critical junctures, and today’s action didn’t inspire confidence. Let’s break it down.
The Charts
SPY craters below the 200-day moving average (MA) on heavy volume, slicing through the Fibonacci retracement level at $565.06. The next support sits at $551.47. RSI is oversold at 30.07, hinting at potential exhaustion—but no reversal yet.

QQQ Relinquished over half its gains from the April-to-December 2024 bull run. It’s found no footing at recent pivot levels, with the next retracement target at $461.23. Volume nearly reached August selloff levels, and the RSI is lower than it was then.

IWM Lower prices, lower RSI, and above-average volume paint a bearish picture. Potential support looms at $196.70, but momentum isn’t promising.

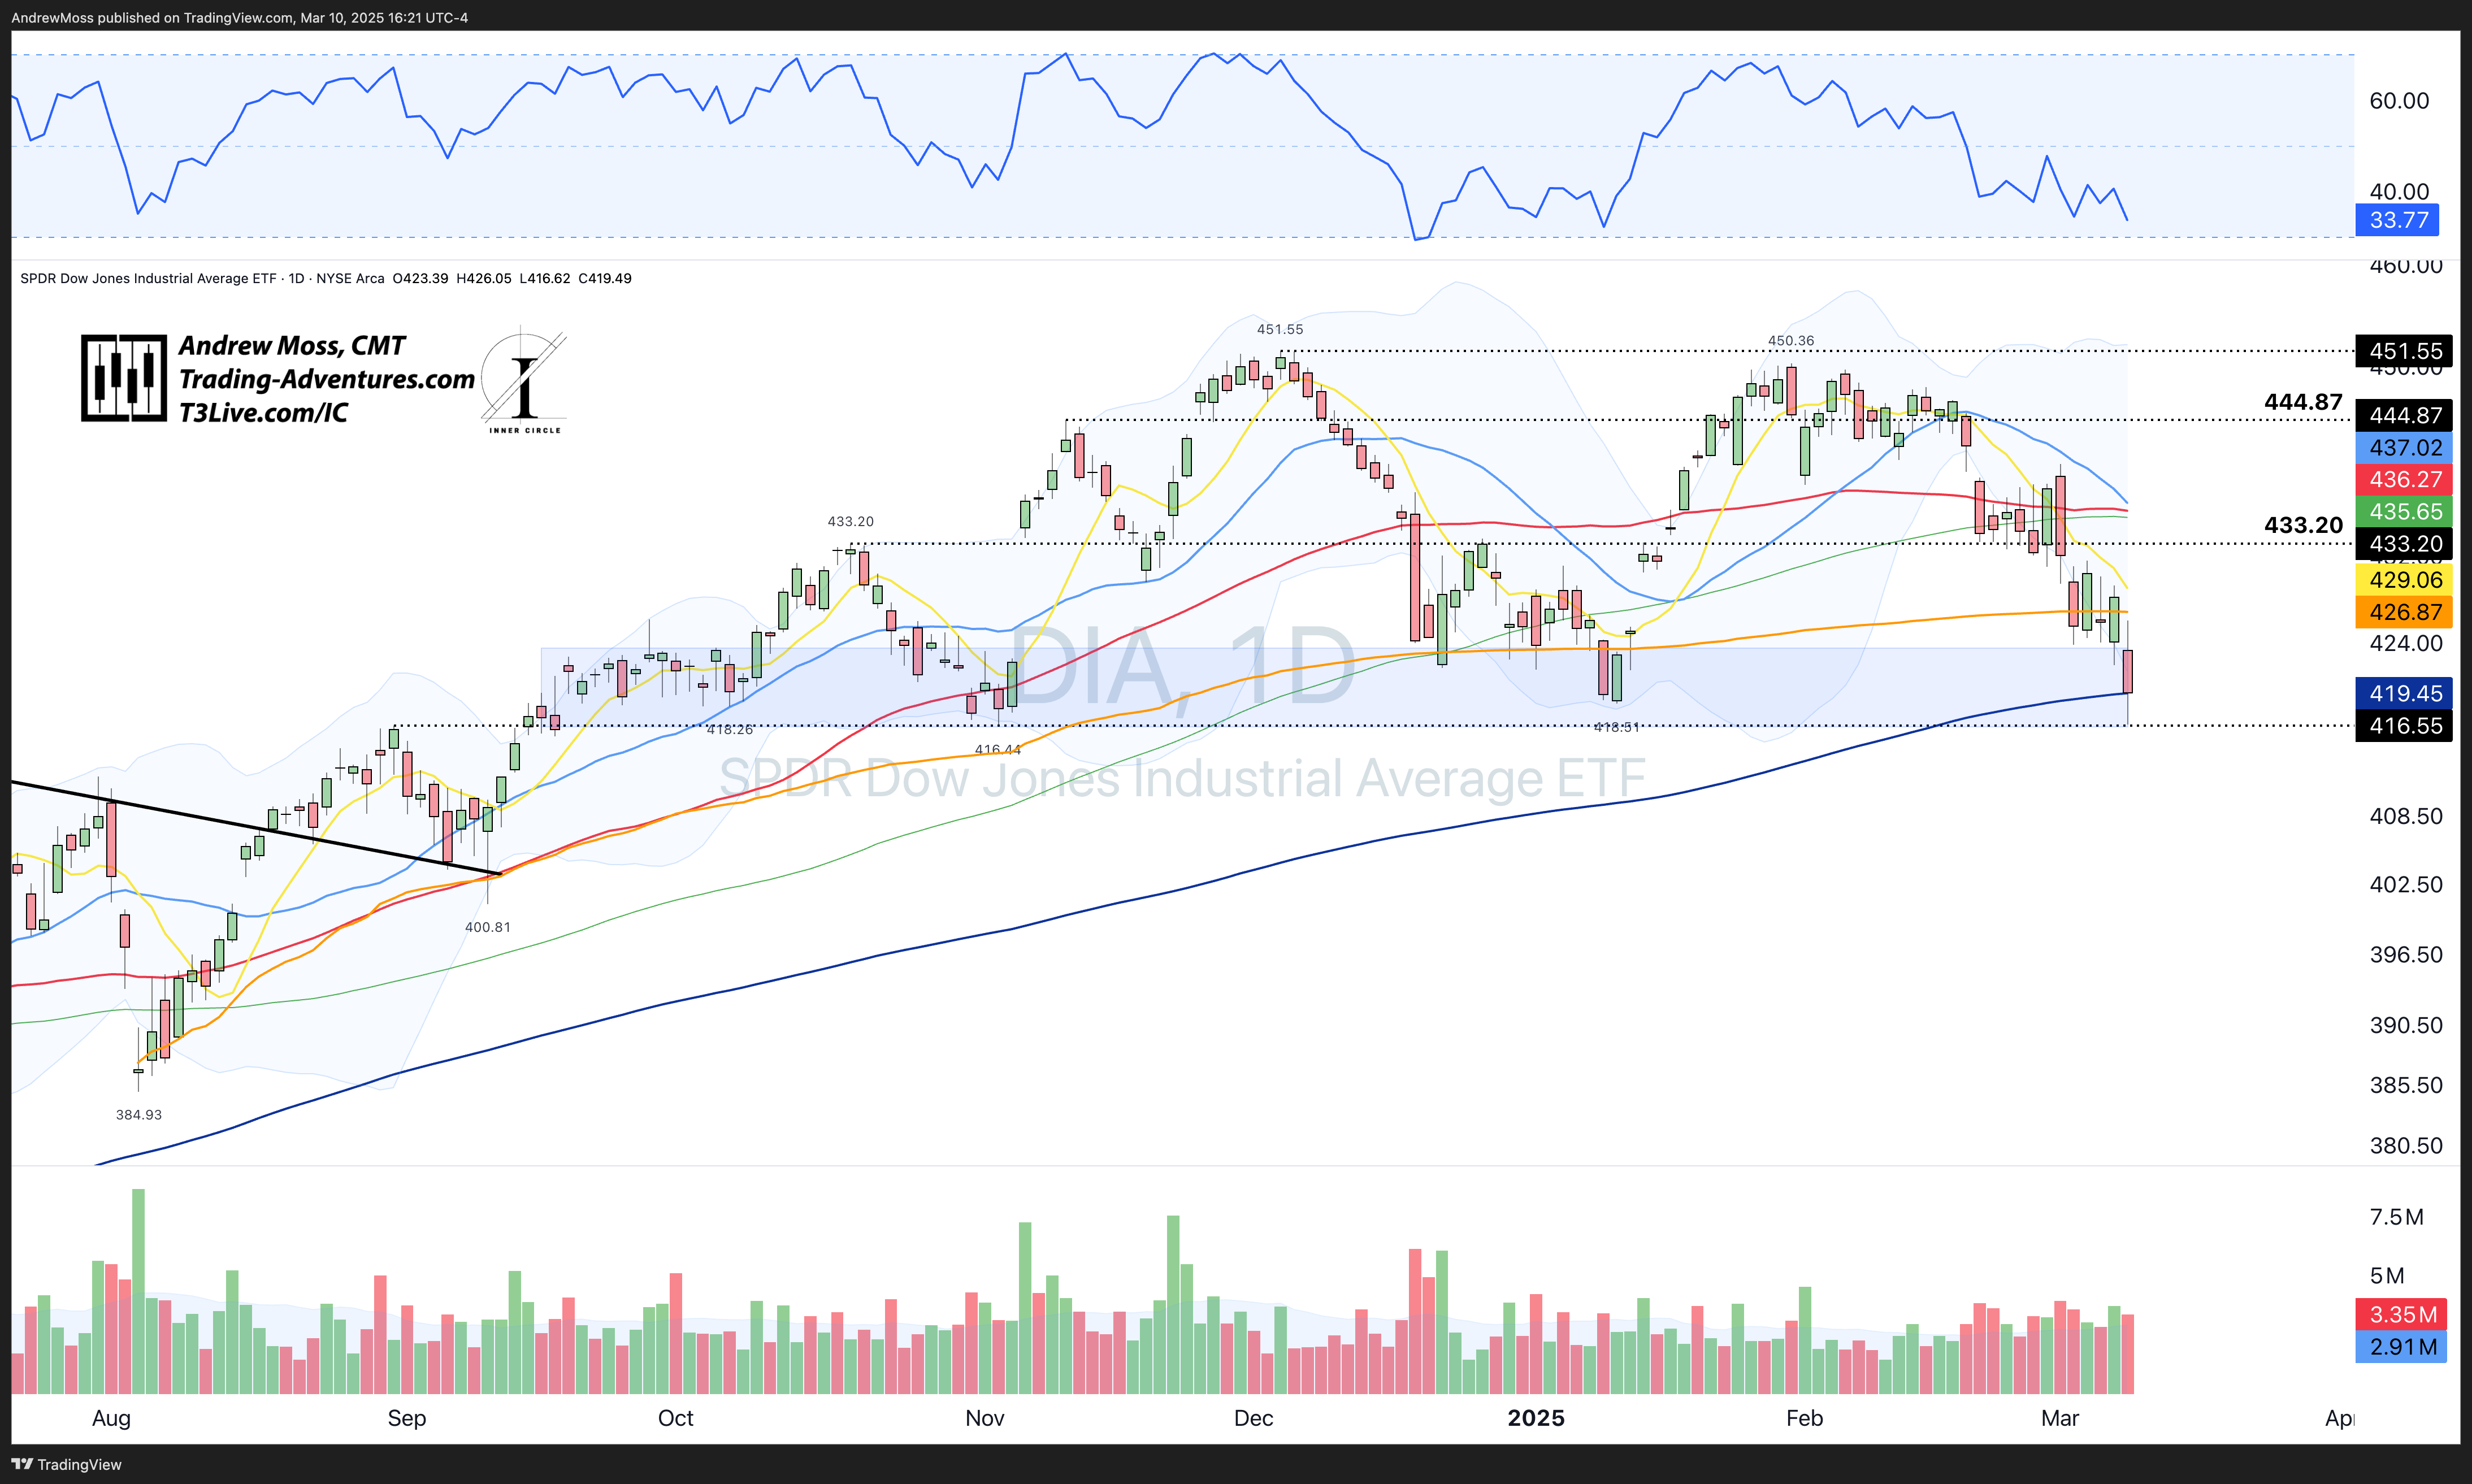
DIA hit the $416.55 pivot and closed just barely above the 200-day MA. RSI is 33.77 and volume is just a touch above average.
TLT Bonds stayed steady, hugging the 8-day MA and holding recent gains—a rare bright spot.

DXY The Dollar hinted at stabilizing, closing in positive territory and within Friday’s range after weeks of selling pressure.

BTCUSD Pierced the February 28 reactionary low after dropping below the 200-day MA and AVWAP. A slight bullish RSI divergence offers a glimmer of hope, but volume confirms selling pressure.

The Trade
Key questions —
Last week (March 8 post), I flagged several potential “make or break” moments:
Can growth reclaim leadership over value?
Will tech buying (e.g., QQQ, MAGS, NVDA) sustain its recent flickers of life?
Are we still tracking the seasonal roadmap with an early March bottom?
Today’s selloff leans toward “no” on all fronts. Relative charts are breaking down, rotation has stalled (note weakness in DIA, XLF, etc.), and selling has blown past seasonal expectations.
Caution flags are piling up.
The breakdown in relative strength, absent rotation, and outsized selling could spell trouble for the bull market’s longevity in 2025. That said, short-term oversold conditions (e.g., RSI readings) suggest a bounce or relief rally might be brewing. We’re missing a catalyst, though—watch for one this week.
Maybe CPI/PPI?
Looking For More?
Elevate Your Trading Adventure Even Further With These Offerings.

EpicTrades Options Newsletter
Real-time trade ideas and insights, providing actionable trading insights focusing on options trades with short-term horizons, aiming to capitalize on weekly market movements.
The approach includes detailed reasoning for trades, specific options, and profit targets. It focuses on quick gains with a minimal time commitment from subscribers.

The Inner Circle
The Inner Circle is a Virtual Trading Floor (VTF) at T3 Live. I’ve been working and trading with this group since 2022. You may have noticed the logo in the watermarks on my charts.
Founded by David Prince and led by him, Rick March, and Kira Turner, the Inner Circle is a community of elite traders, including hedge fund managers, family office heads, corporate executives, financial advisors, and even professional poker players.
Fundamental, Macro, and Technical Analysis all combine to find and discuss the best opportunities in current markets.

The Disclosures
***This is NOT financial advice. This is NOT a recommendation to buy, sell, or trade any security. The content presented here is intended for educational purposes only.