Melting Up
Monday Market Update December 18, 2023
Special Announcement!
Christmas comes early this week in the form of a fresh how-to article, WITH VIDEO!
No matter if you are:
Brand new to stock charts?
Just learning about indicators?
Charting for years and looking to improve your process?
You WILL level up!
Subscribers, this will hit your inbox in a day or two.
If you’re new to Trading Adventures or reading online, sign up now to keep these FREE articles coming.
Also, please head over to YouTube and hit the Subscribe button there.
The video will be out later this week.
The Markets
The melt-up continues this week as buyers returned from the weekend well-rested and ready for more.
Some are wondering if the persistent buying has front-run the Santa Claus rally.
Or can the melt-up continue and send more bullish signals as we move into 2024?
That question is especially pertinent as the theme of seasonality continues. The turn of the year provides several observable data points to give clues about the following twelve months.
The Santa Claus Rally
Another creation and observation by the late great Yale Hirsch, founder of the Stock Trader’s Almanac, this period runs from the last five trading days of the year into the first two of the following year.
Stocks are often up for this short time frame, and we want to see that continue. If it doesn’t, that’s a red flag for the coming year.
The January Effect
This theory posits that buying pressure accelerates in the early part of the year as traders and investors look to re-purchase stocks previously sold for tax losses before year-end.
The January Barometer
Another Yale Hirsch observation: the idea here is very straightforward. If the month of January is positive for stocks, there is a higher likelihood that stocks will be higher for the whole year.
We will revisit each of these here as the action and results unfold.
The Charts
SPY continues the high, tight action, and today’s move brings the 21-day MA up to the breakout level.
QQQ has day two closing at new highs.
IWM puts in an inside day to help the consolidation.
DIA looks like it could be in the early stages of building another bull flag.
TLT takes a break and moves back toward the 200-day MA.
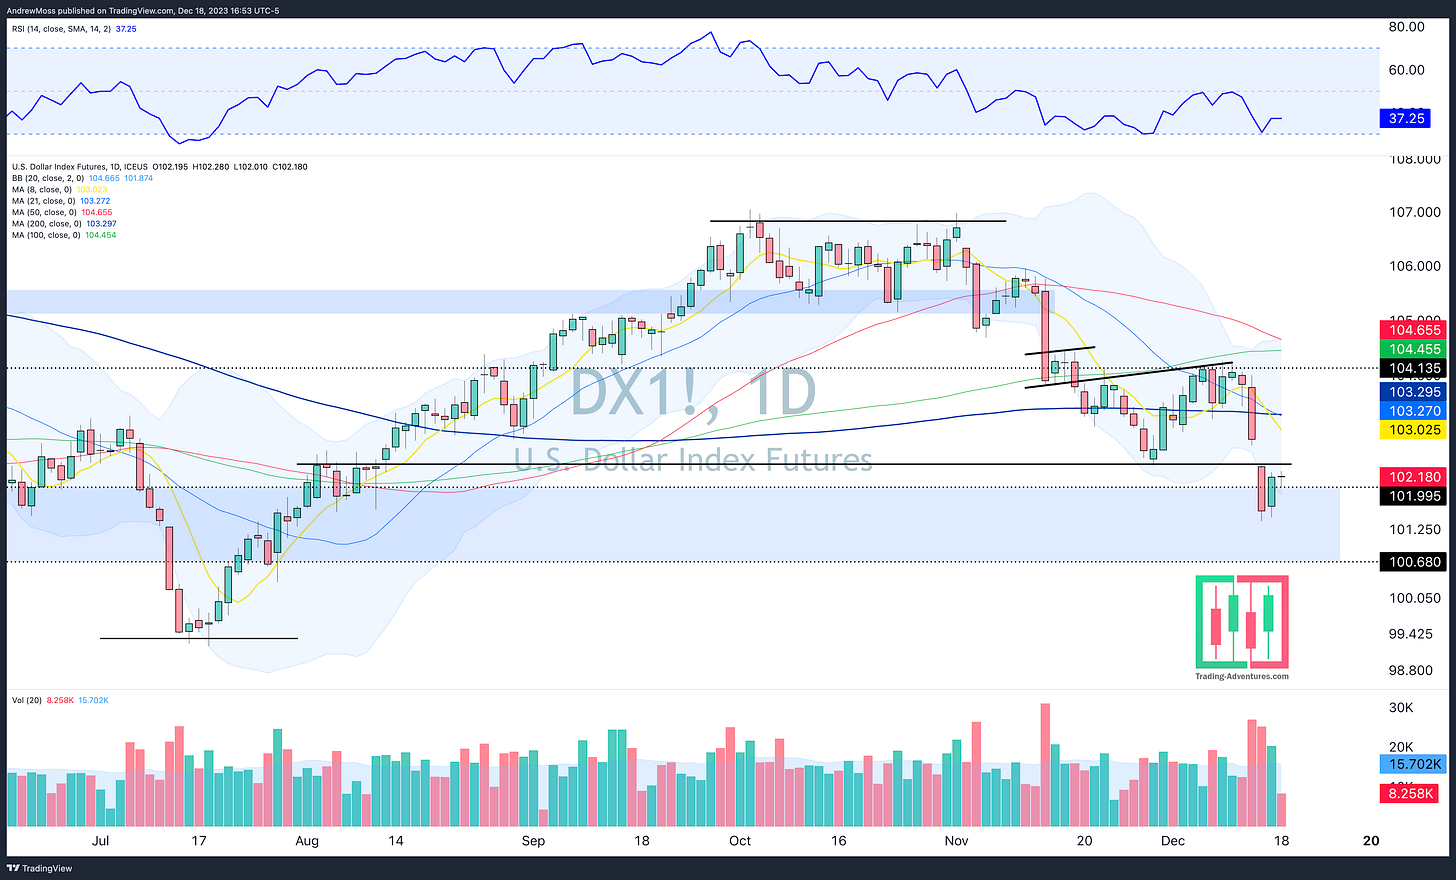
DXY The Dollar remains quiet for the day.
The Closing Bell
Positive, yet mostly quiet and uneventful action. At least for the indexes.
Some individual names were a bit more exciting as AMZN finally broke out, NVDA traded beyond $500, crypto name HUT jumped more than 15%, and TSLA broke out but quickly gave up the gains.
Now, we settle in for what could be a quieter rest of the week as many traders, investors, and money managers leave their desks for the holidays.
We’ll see what transpires and be back with more on Thursday.
The Disclosures
***This is NOT financial advice. NOT a recommendation to buy, sell, or trade any security. The content presented here is intended for educational purposes only.
Andrew Moss is an associated member of T3 Trading Group, LLC (“T3TG”) a SEC registered broker/dealer and member of FINRA/SIPC. All trades placed by Mr. Moss are done through T3TG.
Statements in this article represent the opinions of that person only and do not necessarily reflect the opinions of T3TG or any other person associated with T3TG.
It is possible that Mr. Moss may hold an investment position (or may be contemplating holding an investment position) that is inconsistent with the information provided or the opinion being expressed. This may reflect the financial or other circumstances of the individual or it may reflect some other consideration. Readers of this article should take this into account when evaluating the information provided or the opinions being expressed.
All investments are subject to the risk of loss, which you should consider in making any investment decisions. Readers of this article should consult with their financial advisors, attorneys, accountants, or other qualified investors prior to making any investment decision.
POSITION DISCLOSURE
December 18, 2023, 4:00 PM
Long: IWM, NVDA, QQQ, TSLA
Short:
Options symbols are denoted as follows:
Ticker, Date, Call/Put, Strike Price
Example: VXX1218C30 = VXX 12/18 Call with a $30 strike


