META's March Higher Reaches A Magnificent Milestone
19-Day Winning Streak Wows Wall Street


The Markets
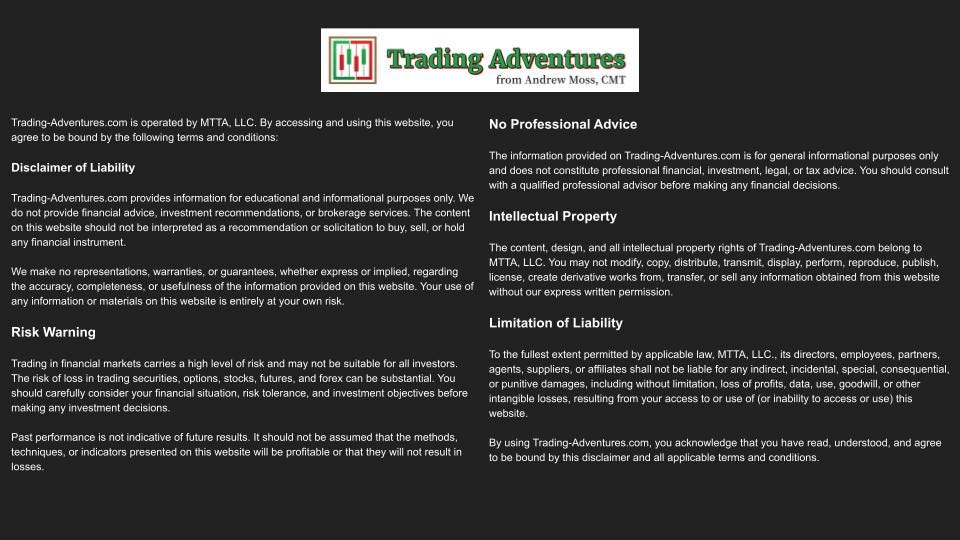
META has embarked on a historic run, achieving a 19-day winning streak, the longest for any Nasdaq 100 company since 1990.
The record-breaking rise, which officially began on January 17, was already underway in anticipation of an impressive earnings report announced on January 29. The report highlighted strong growth in AI-related revenues and effective cost control. Furthermore, recent discussions around a possible TikTok ban boosted the market’s optimism about META, emphasizing its strategic role in social media.
A winning streak such as this is incredibly rare and indicates impressive bullish sentiment. The stock is now navigating through uncharted waters, setting a new all-time closing high each day since January 26.
To state the obvious, the stock is clearly in a very bullish trend, moving above all the key moving averages but not exactly extended or stretched. The RSI has been in overbought territory since the day following the earnings report and has been rising for much longer. The next potential price target is a Fibonacci extension near $750.
Momentum is firmly in control, and it’s probably a good time to remember —
“One of the most bullish things a stock can do is to get overbought and stay there.”
—William O’Neil, author of How To Make Money In Stocks and founder of Investor’s Business Daily.
The Charts
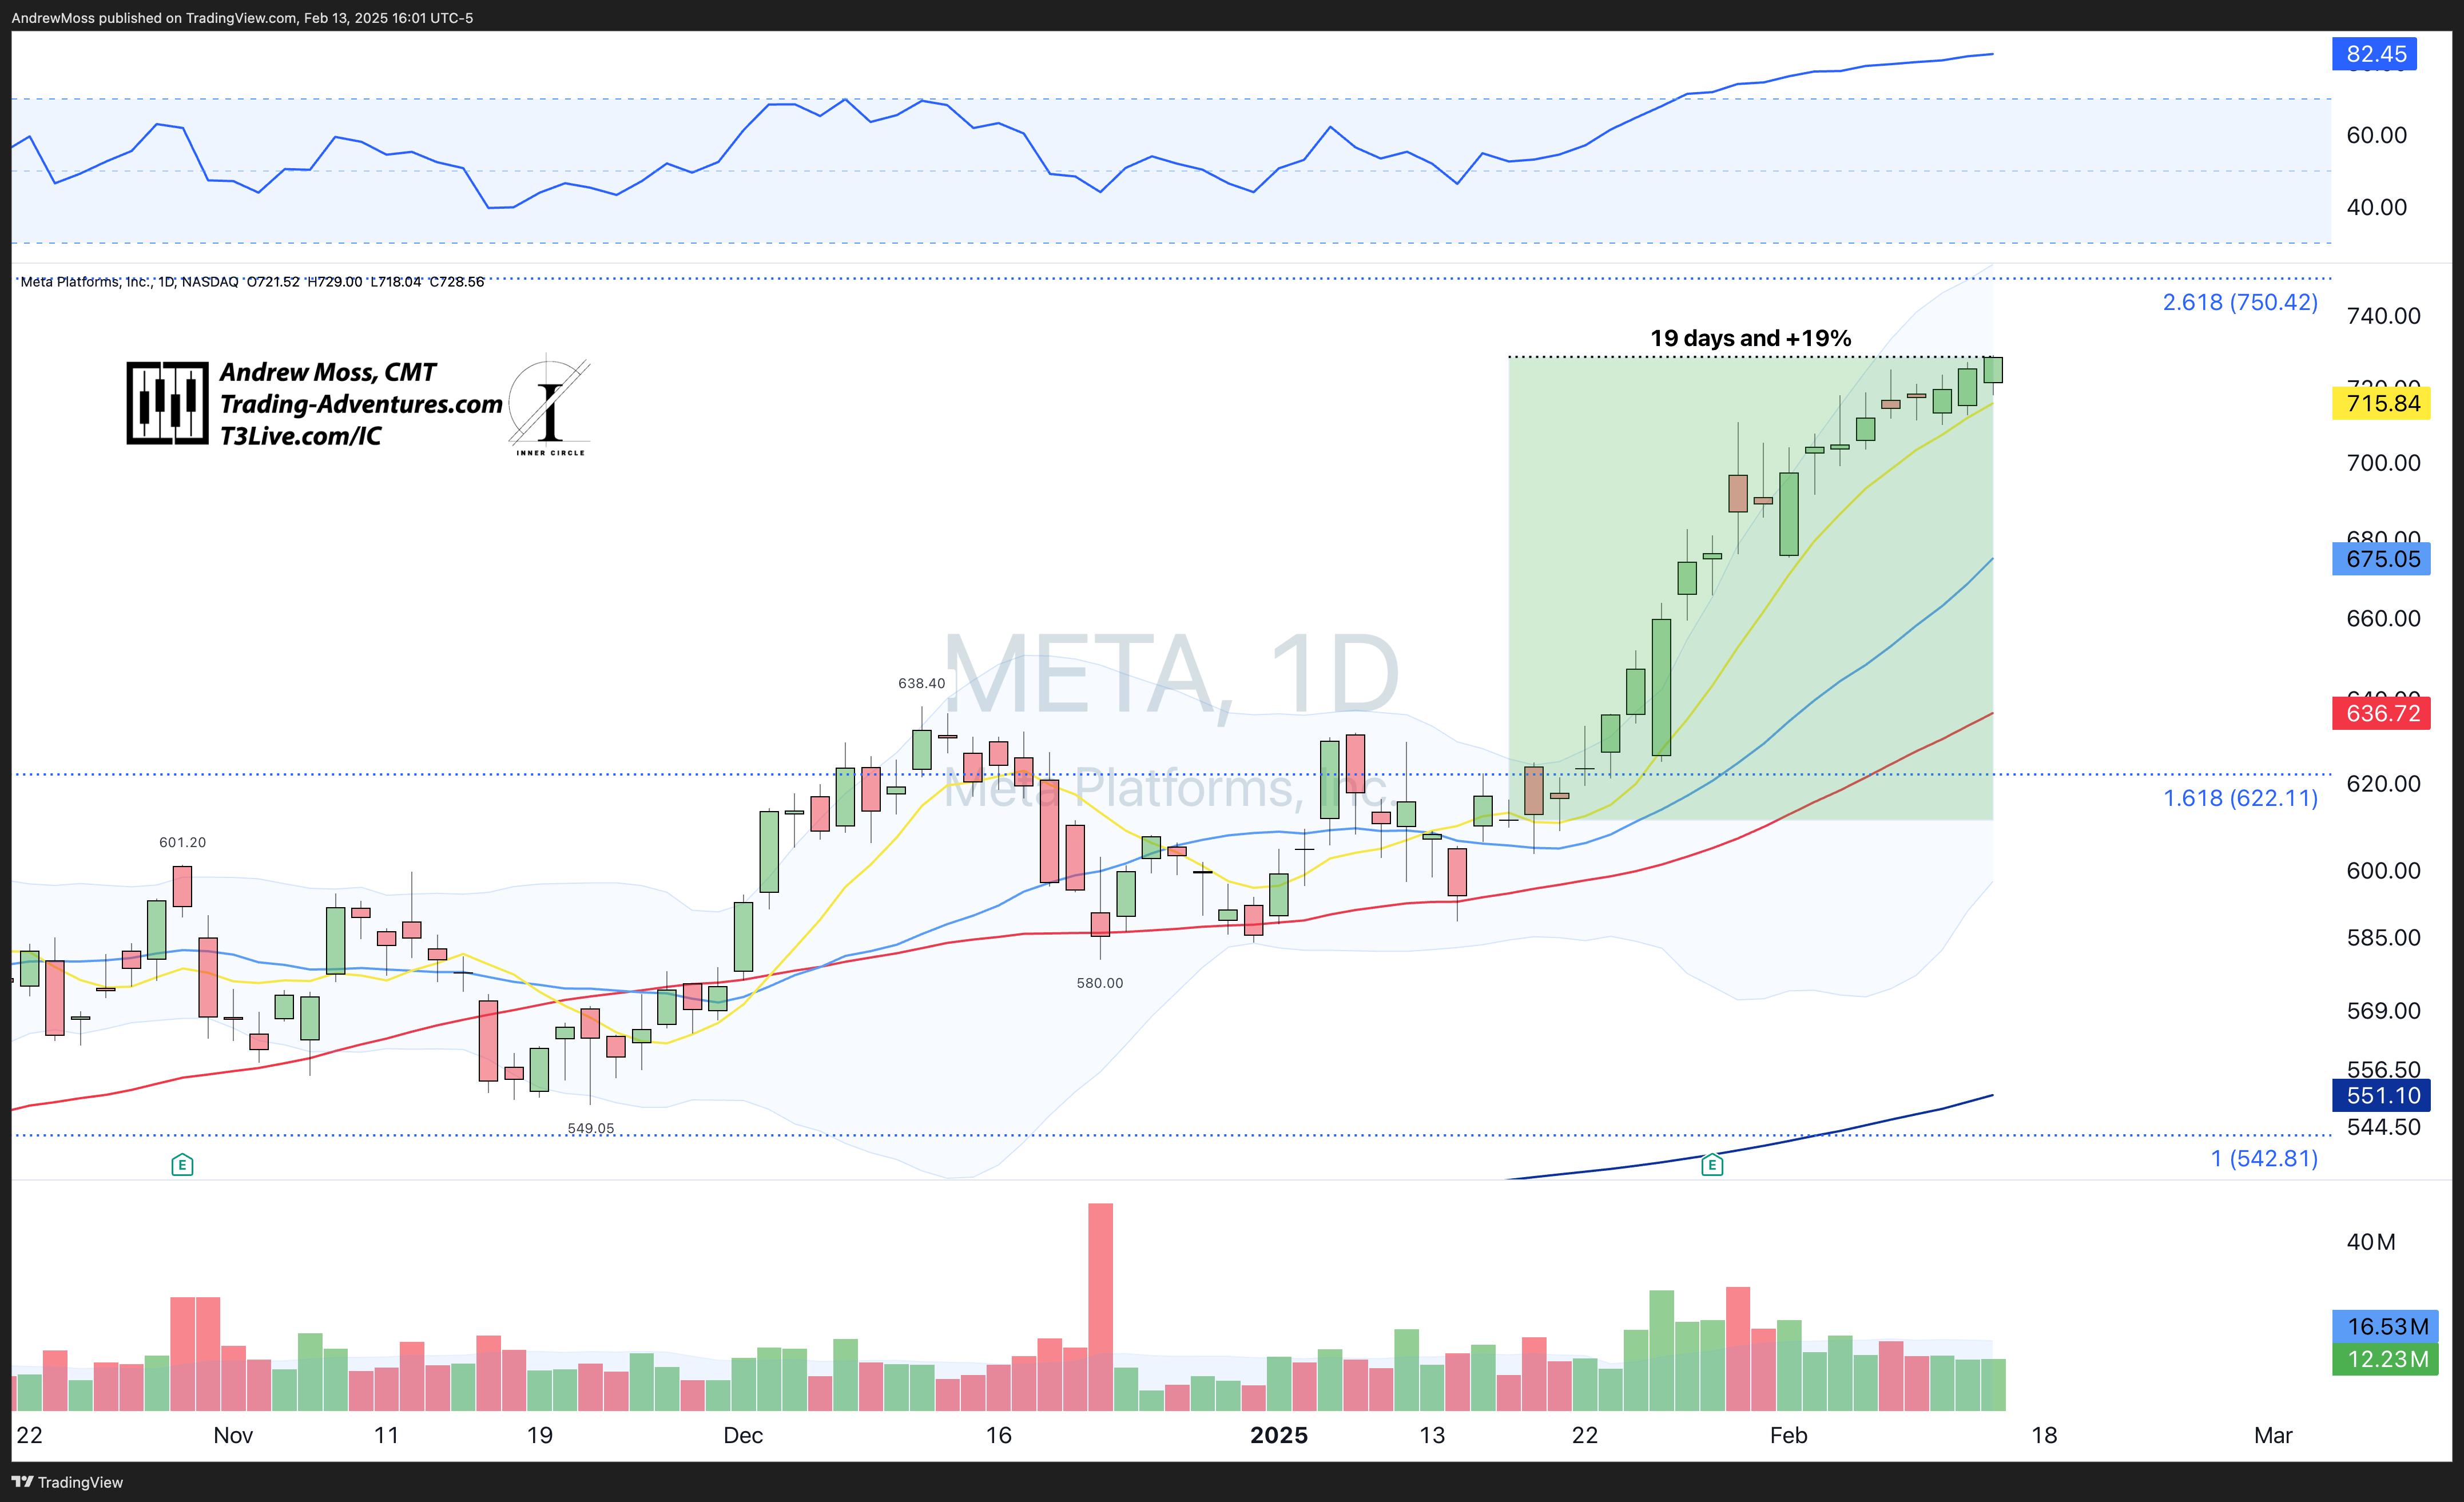
SPY perfectly held the support levels noted in Tuesday’s analysis and then moved above the trendline and into recent pivot highs. The consolidation has resolved itself higher. $610.78 is the high score to beat.
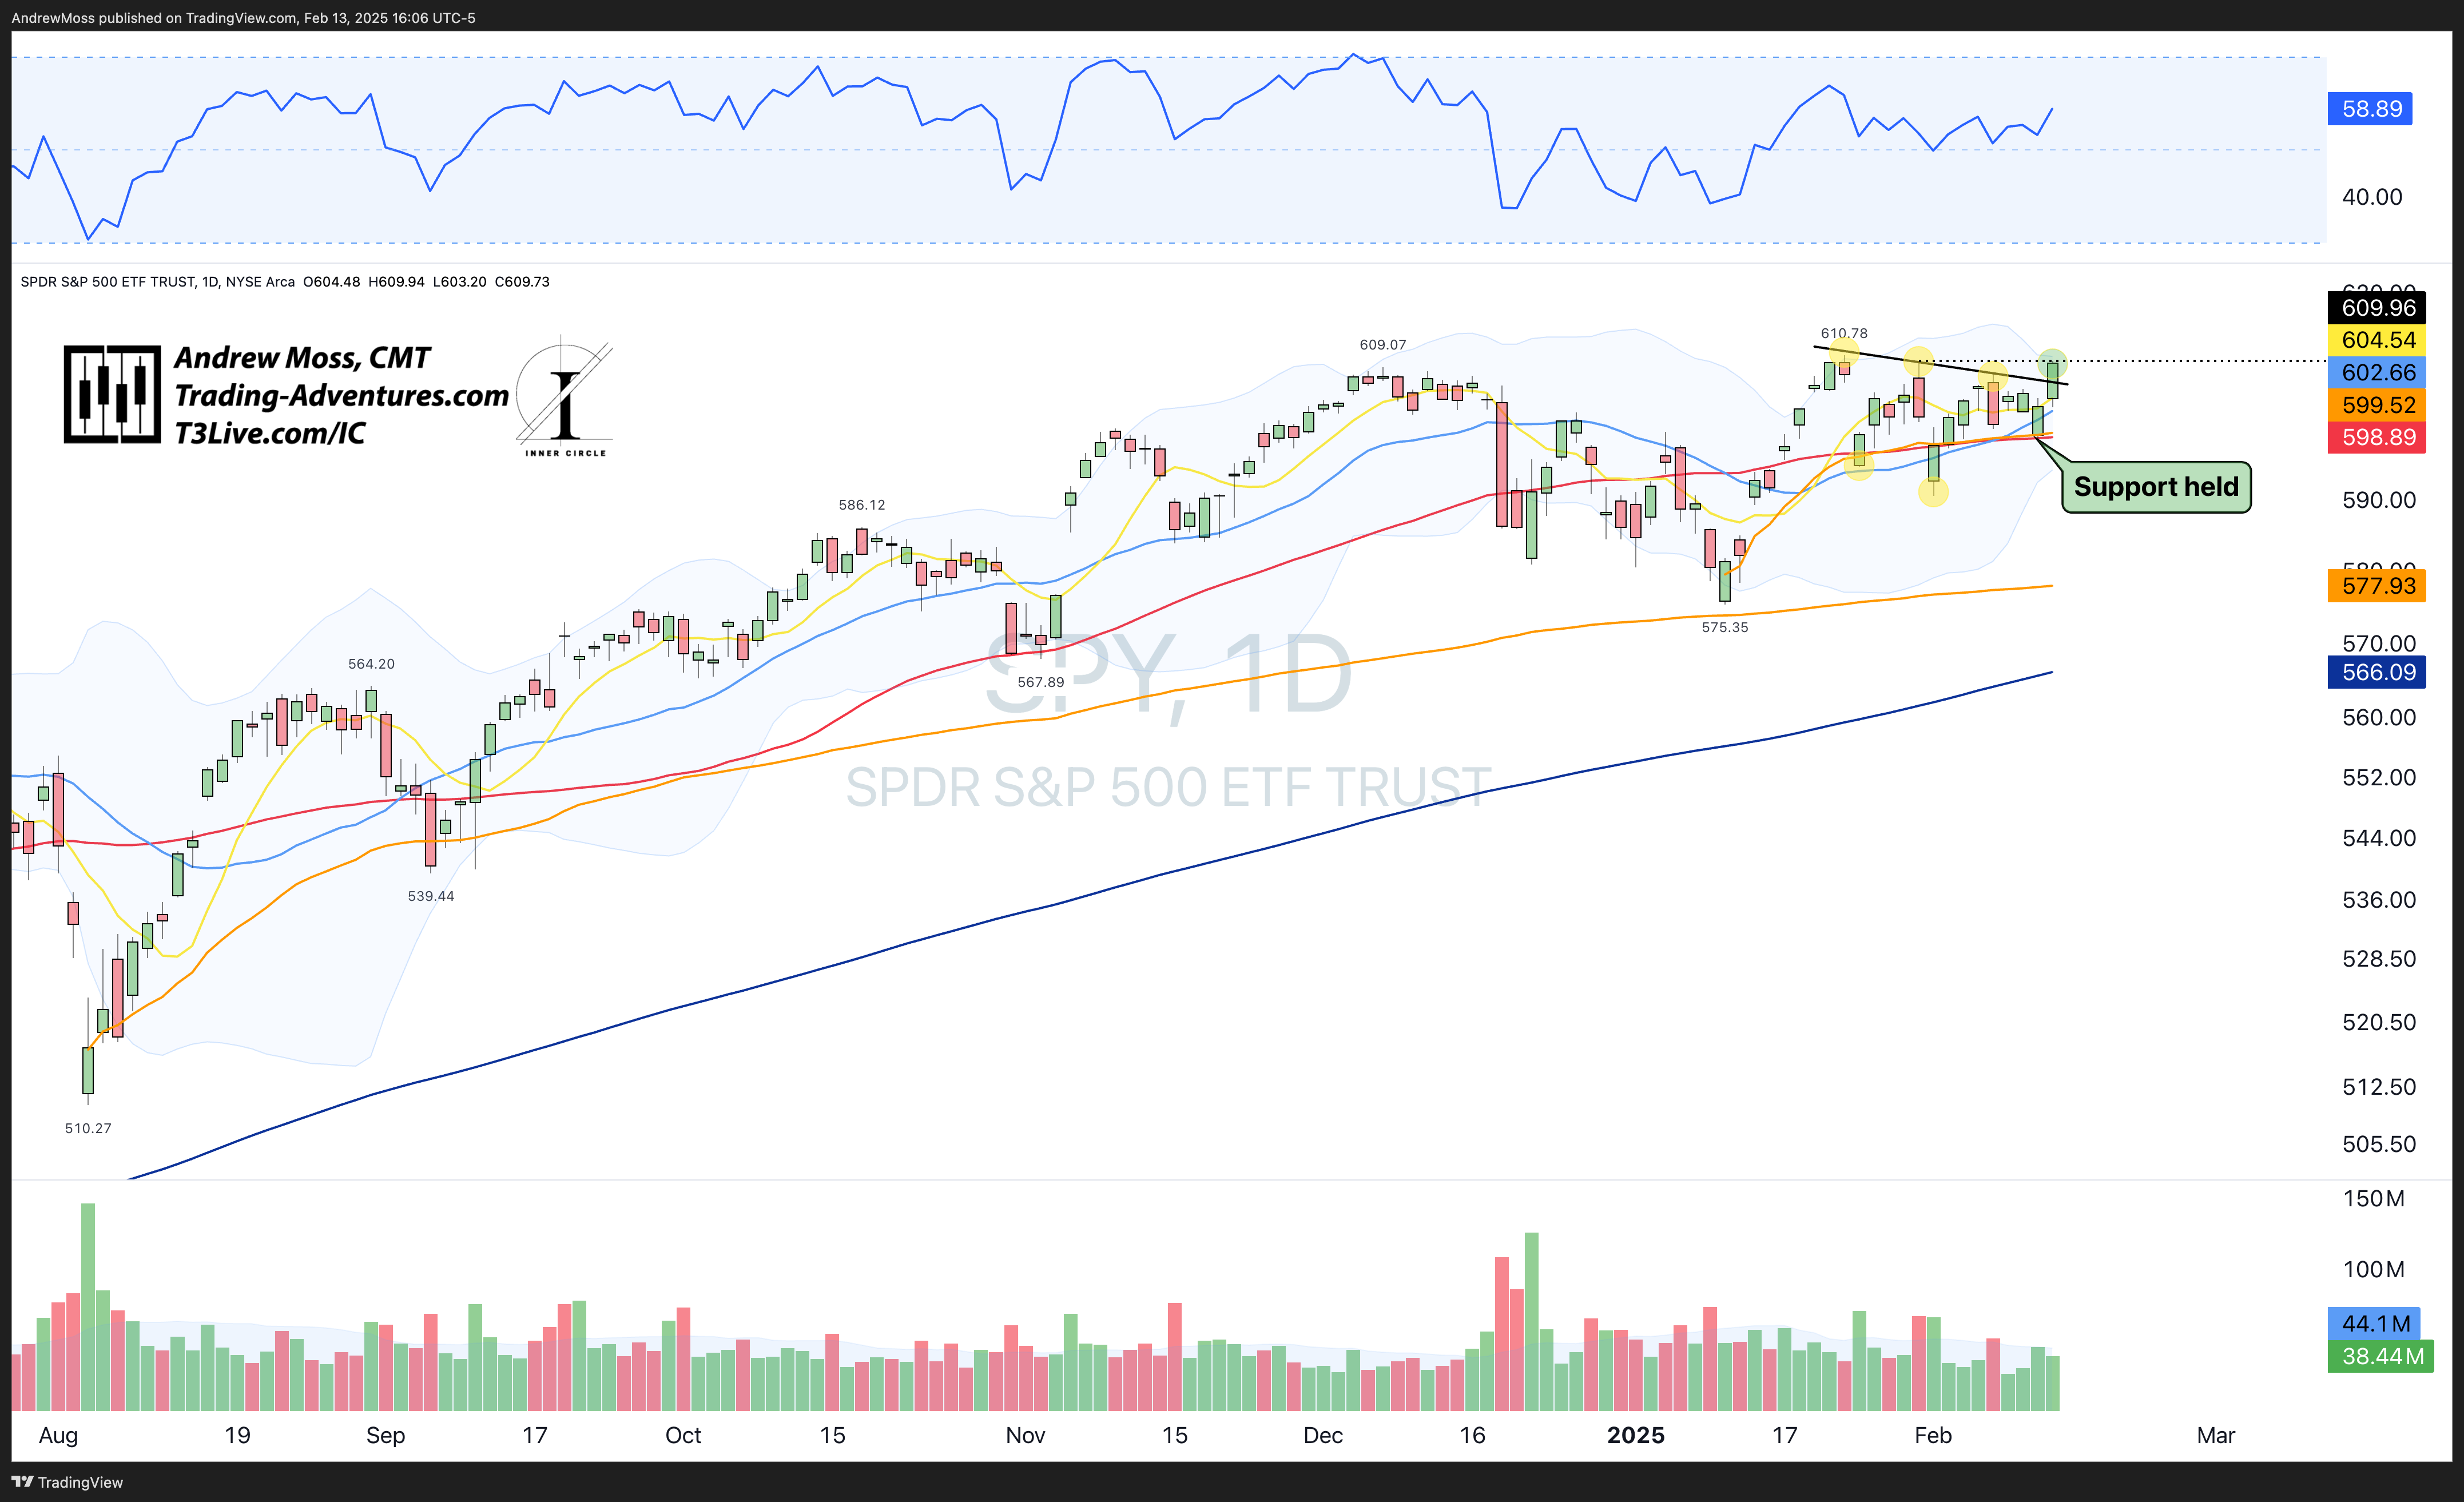
QQQ followed the script, also holding the noted support levels and rising above the trendline. Then it went further, moving past the $533.82 pivot, closing today’s action within half a percent of all-time highs.
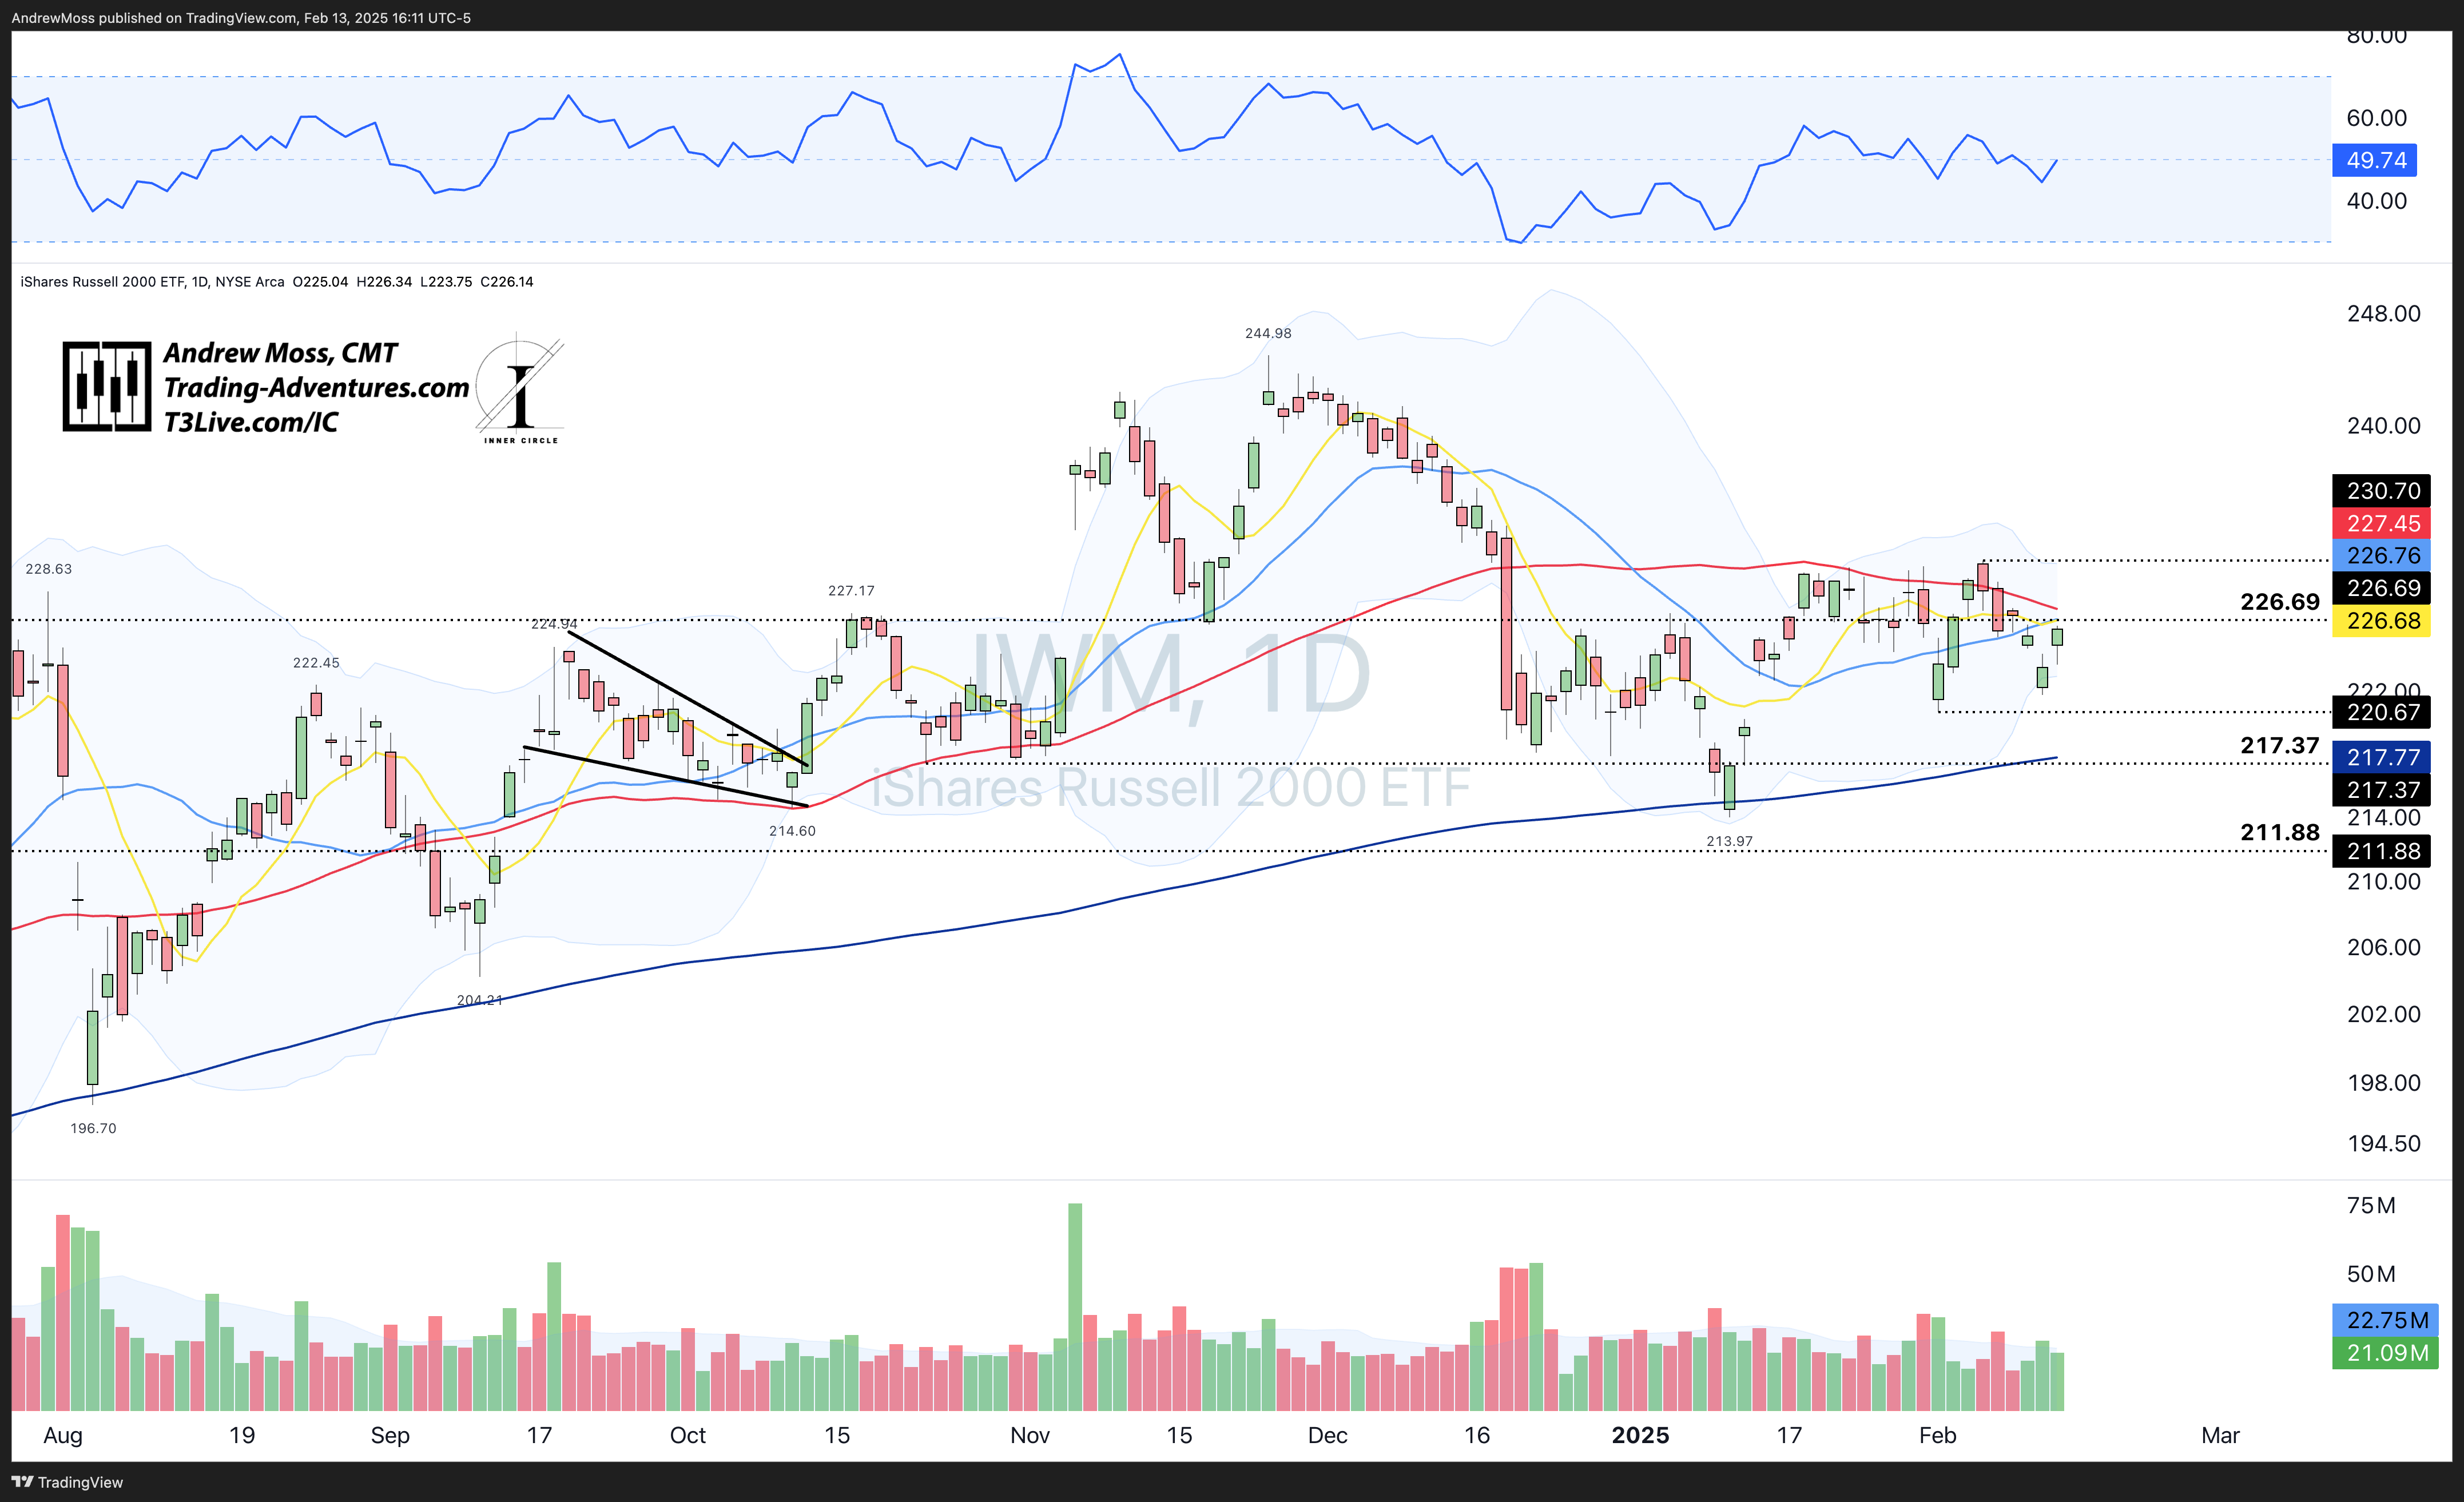
IWM is roughly where we left it after Tuesday’s close. The same resistance levels —the 8/21/50-day MAs and the ~$227 pivot — are just above the price. The same support levels are still below.
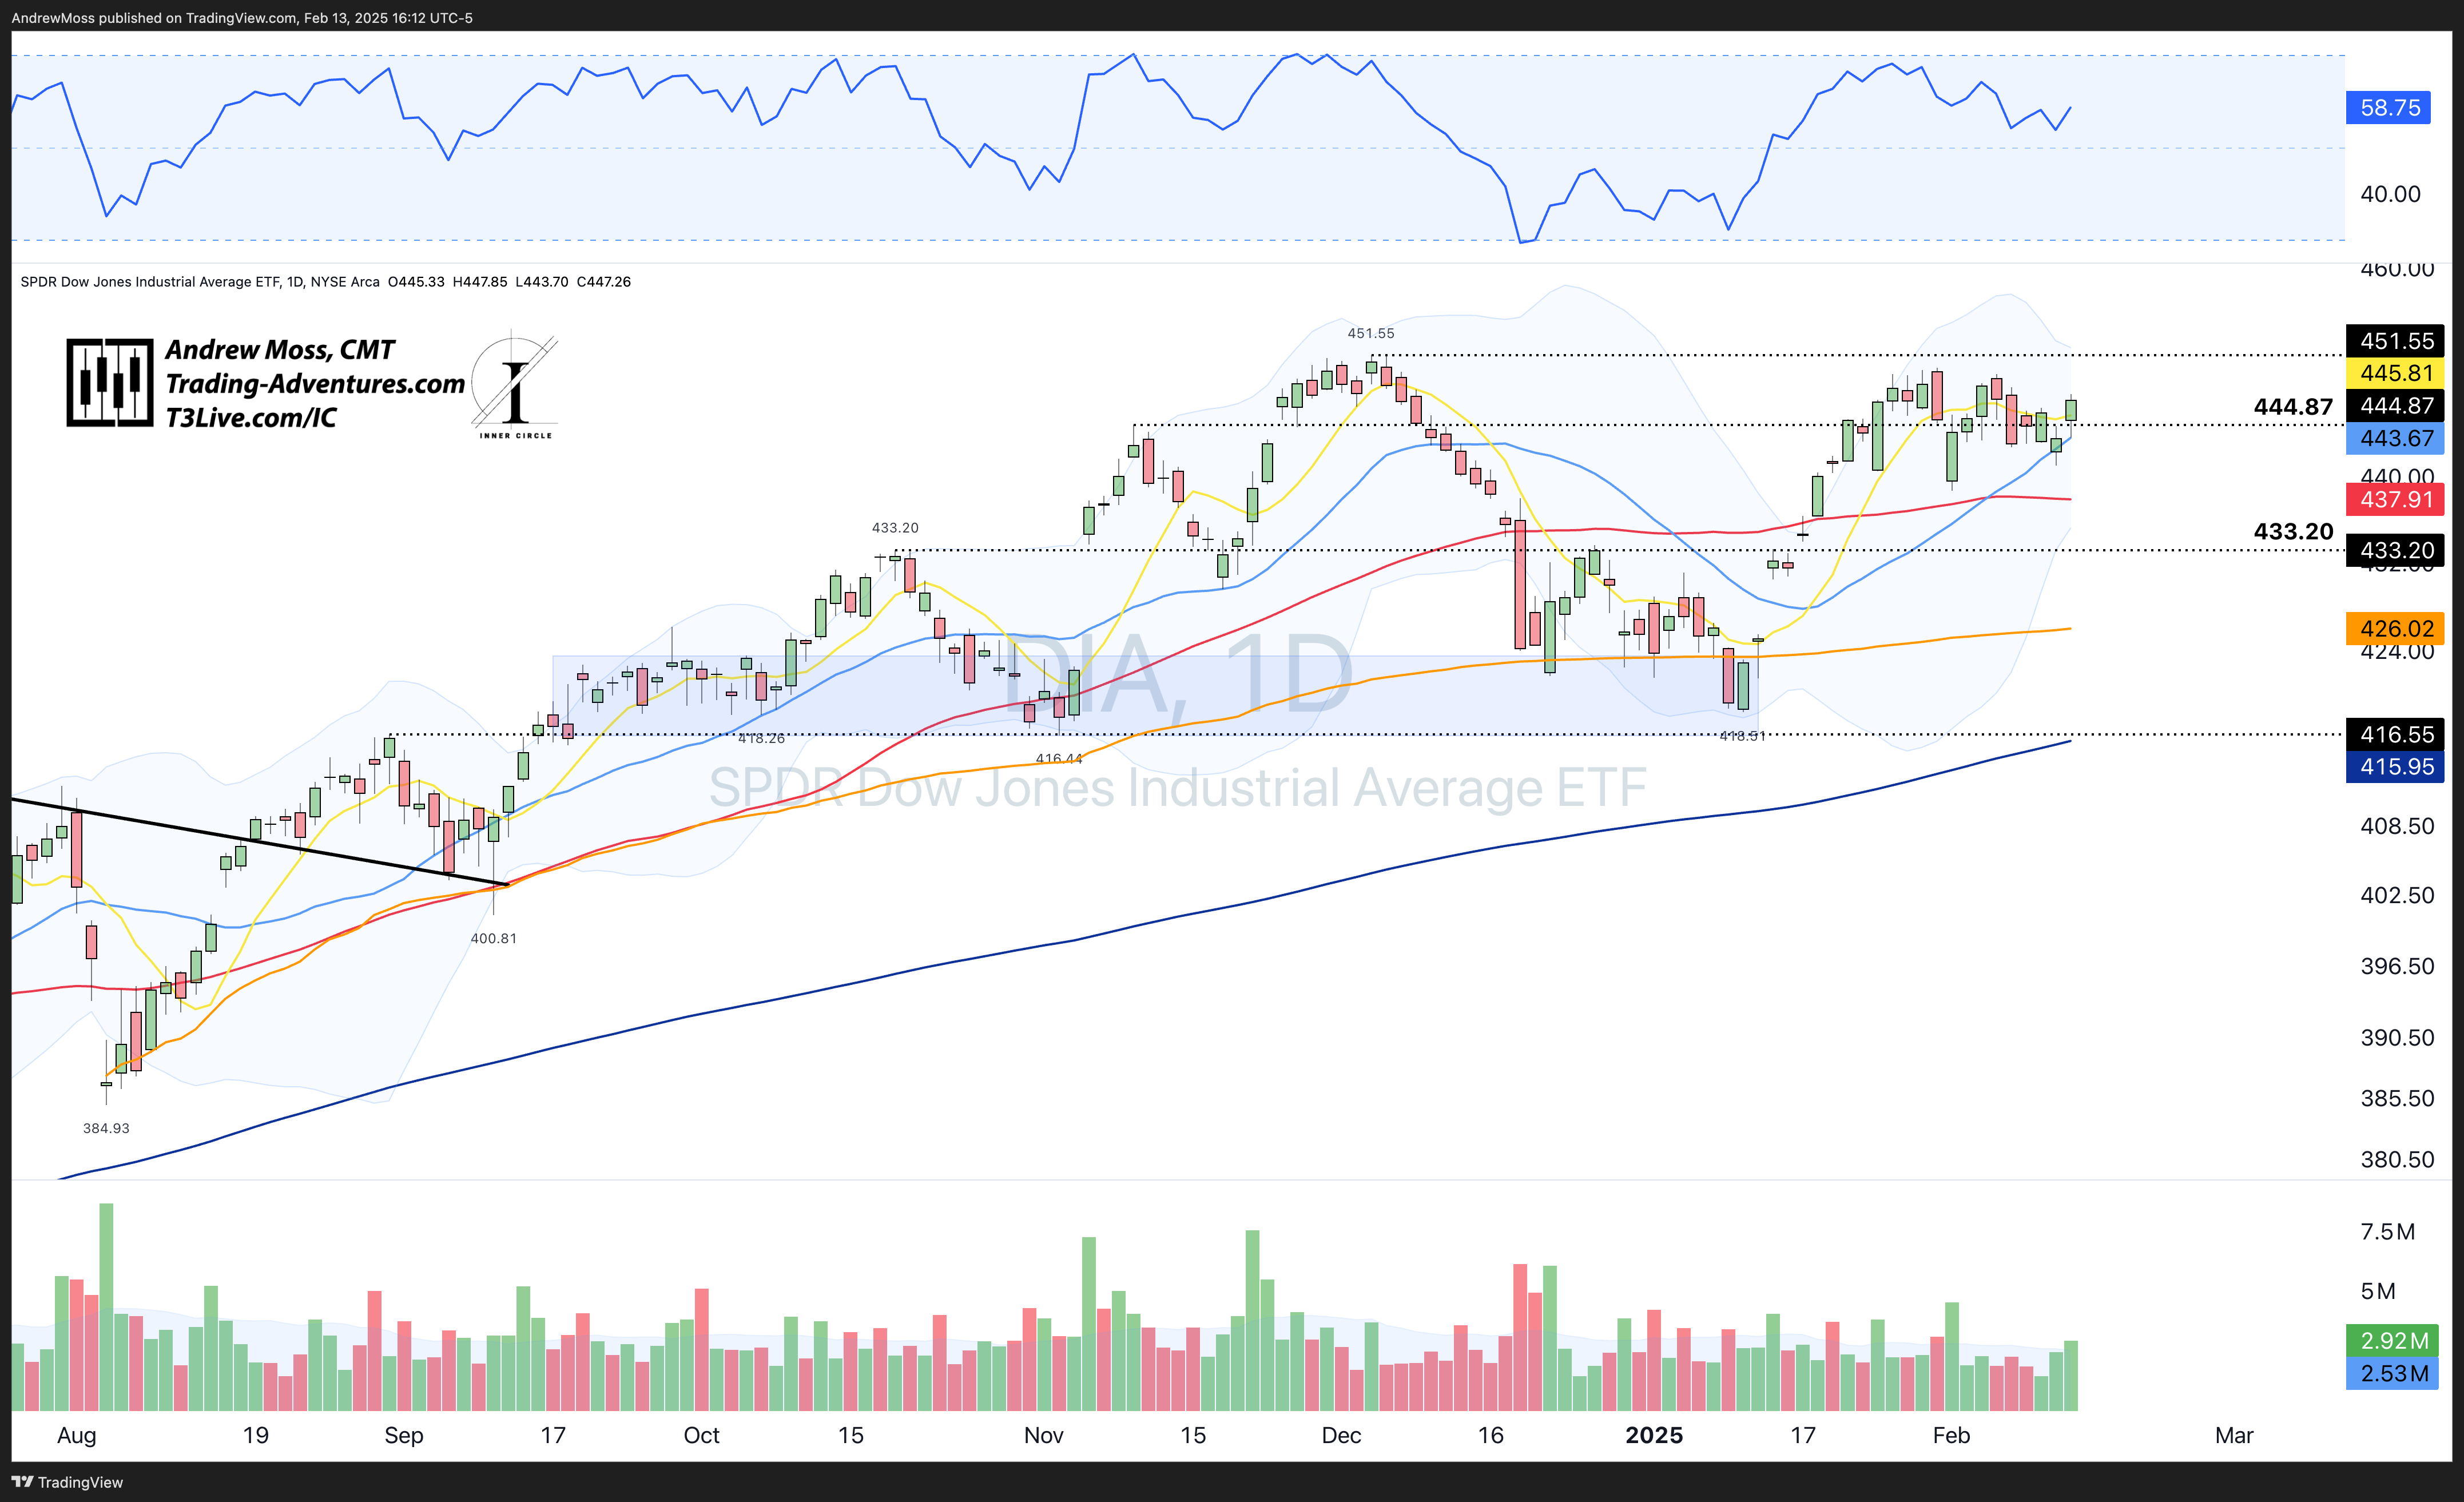
DIA bounced from the 21-day MA and ~$444.87 pivot. New highs are roughly $4 away.
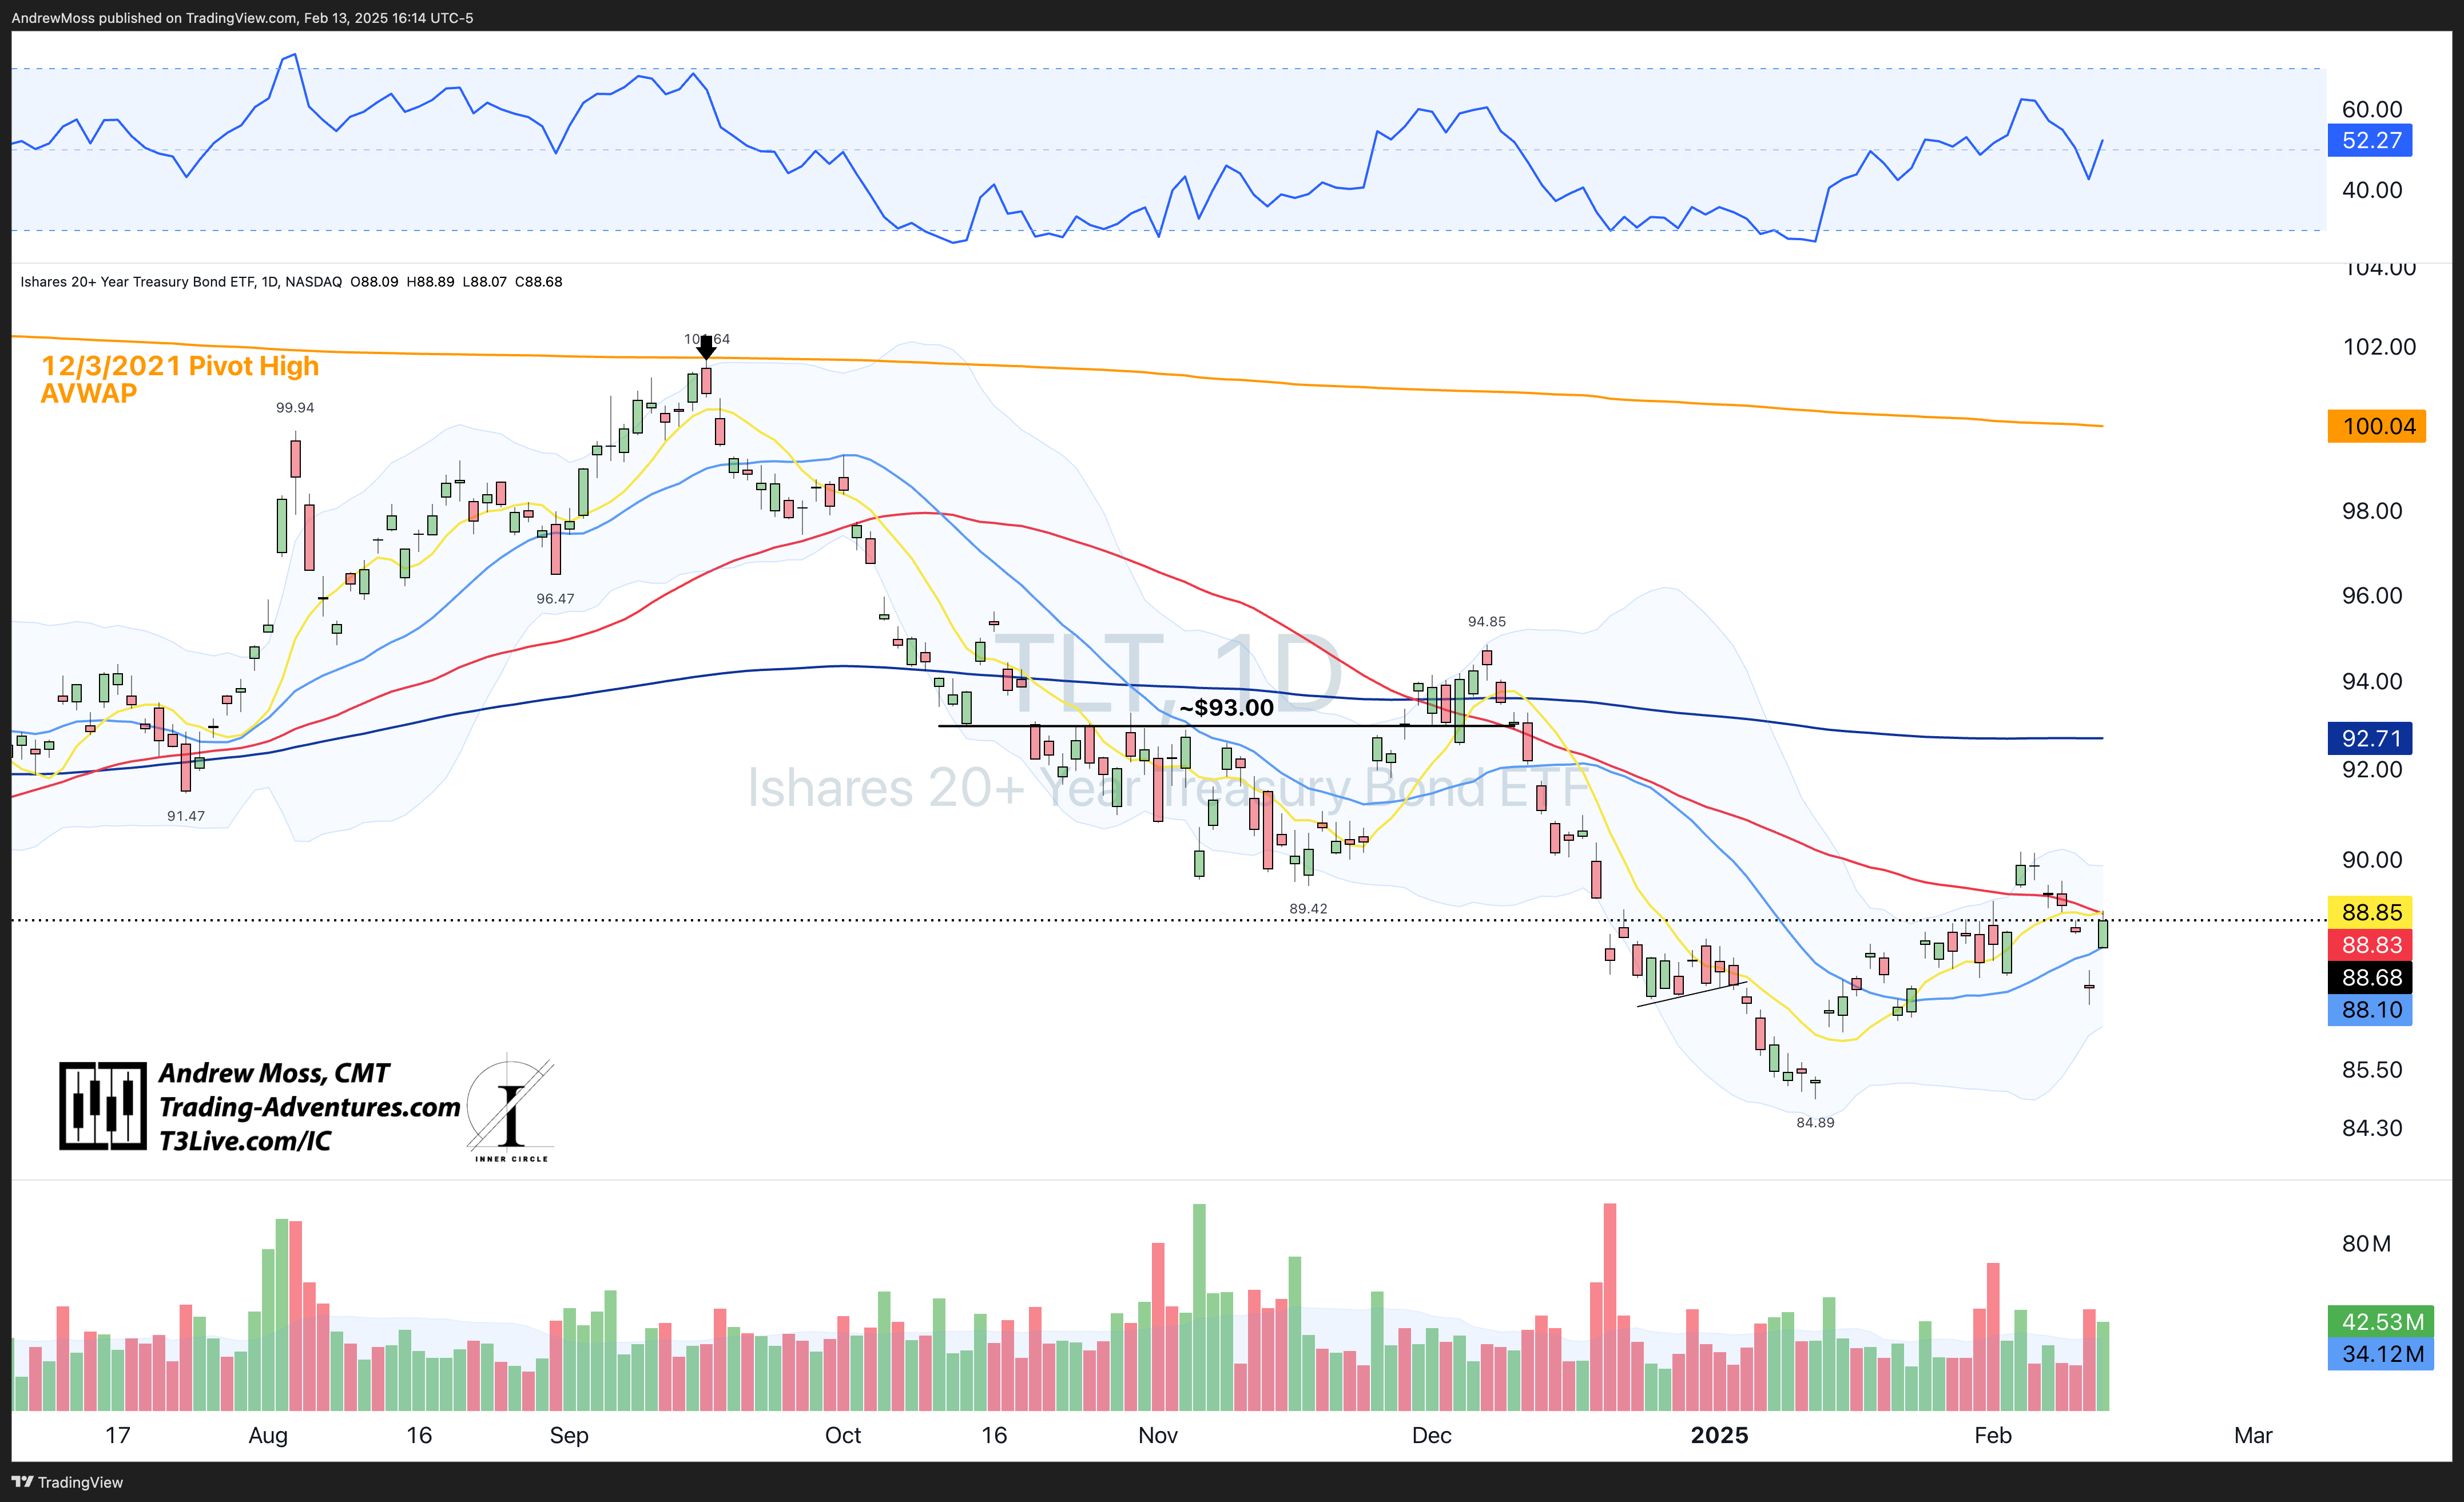
TLT is erratic but trying to maintain recent progress. It held the 21-day MA only to be stopped by the 8- and 50-day MAs and the $88.68 pivot. Getting back above $90 quickly is essential.
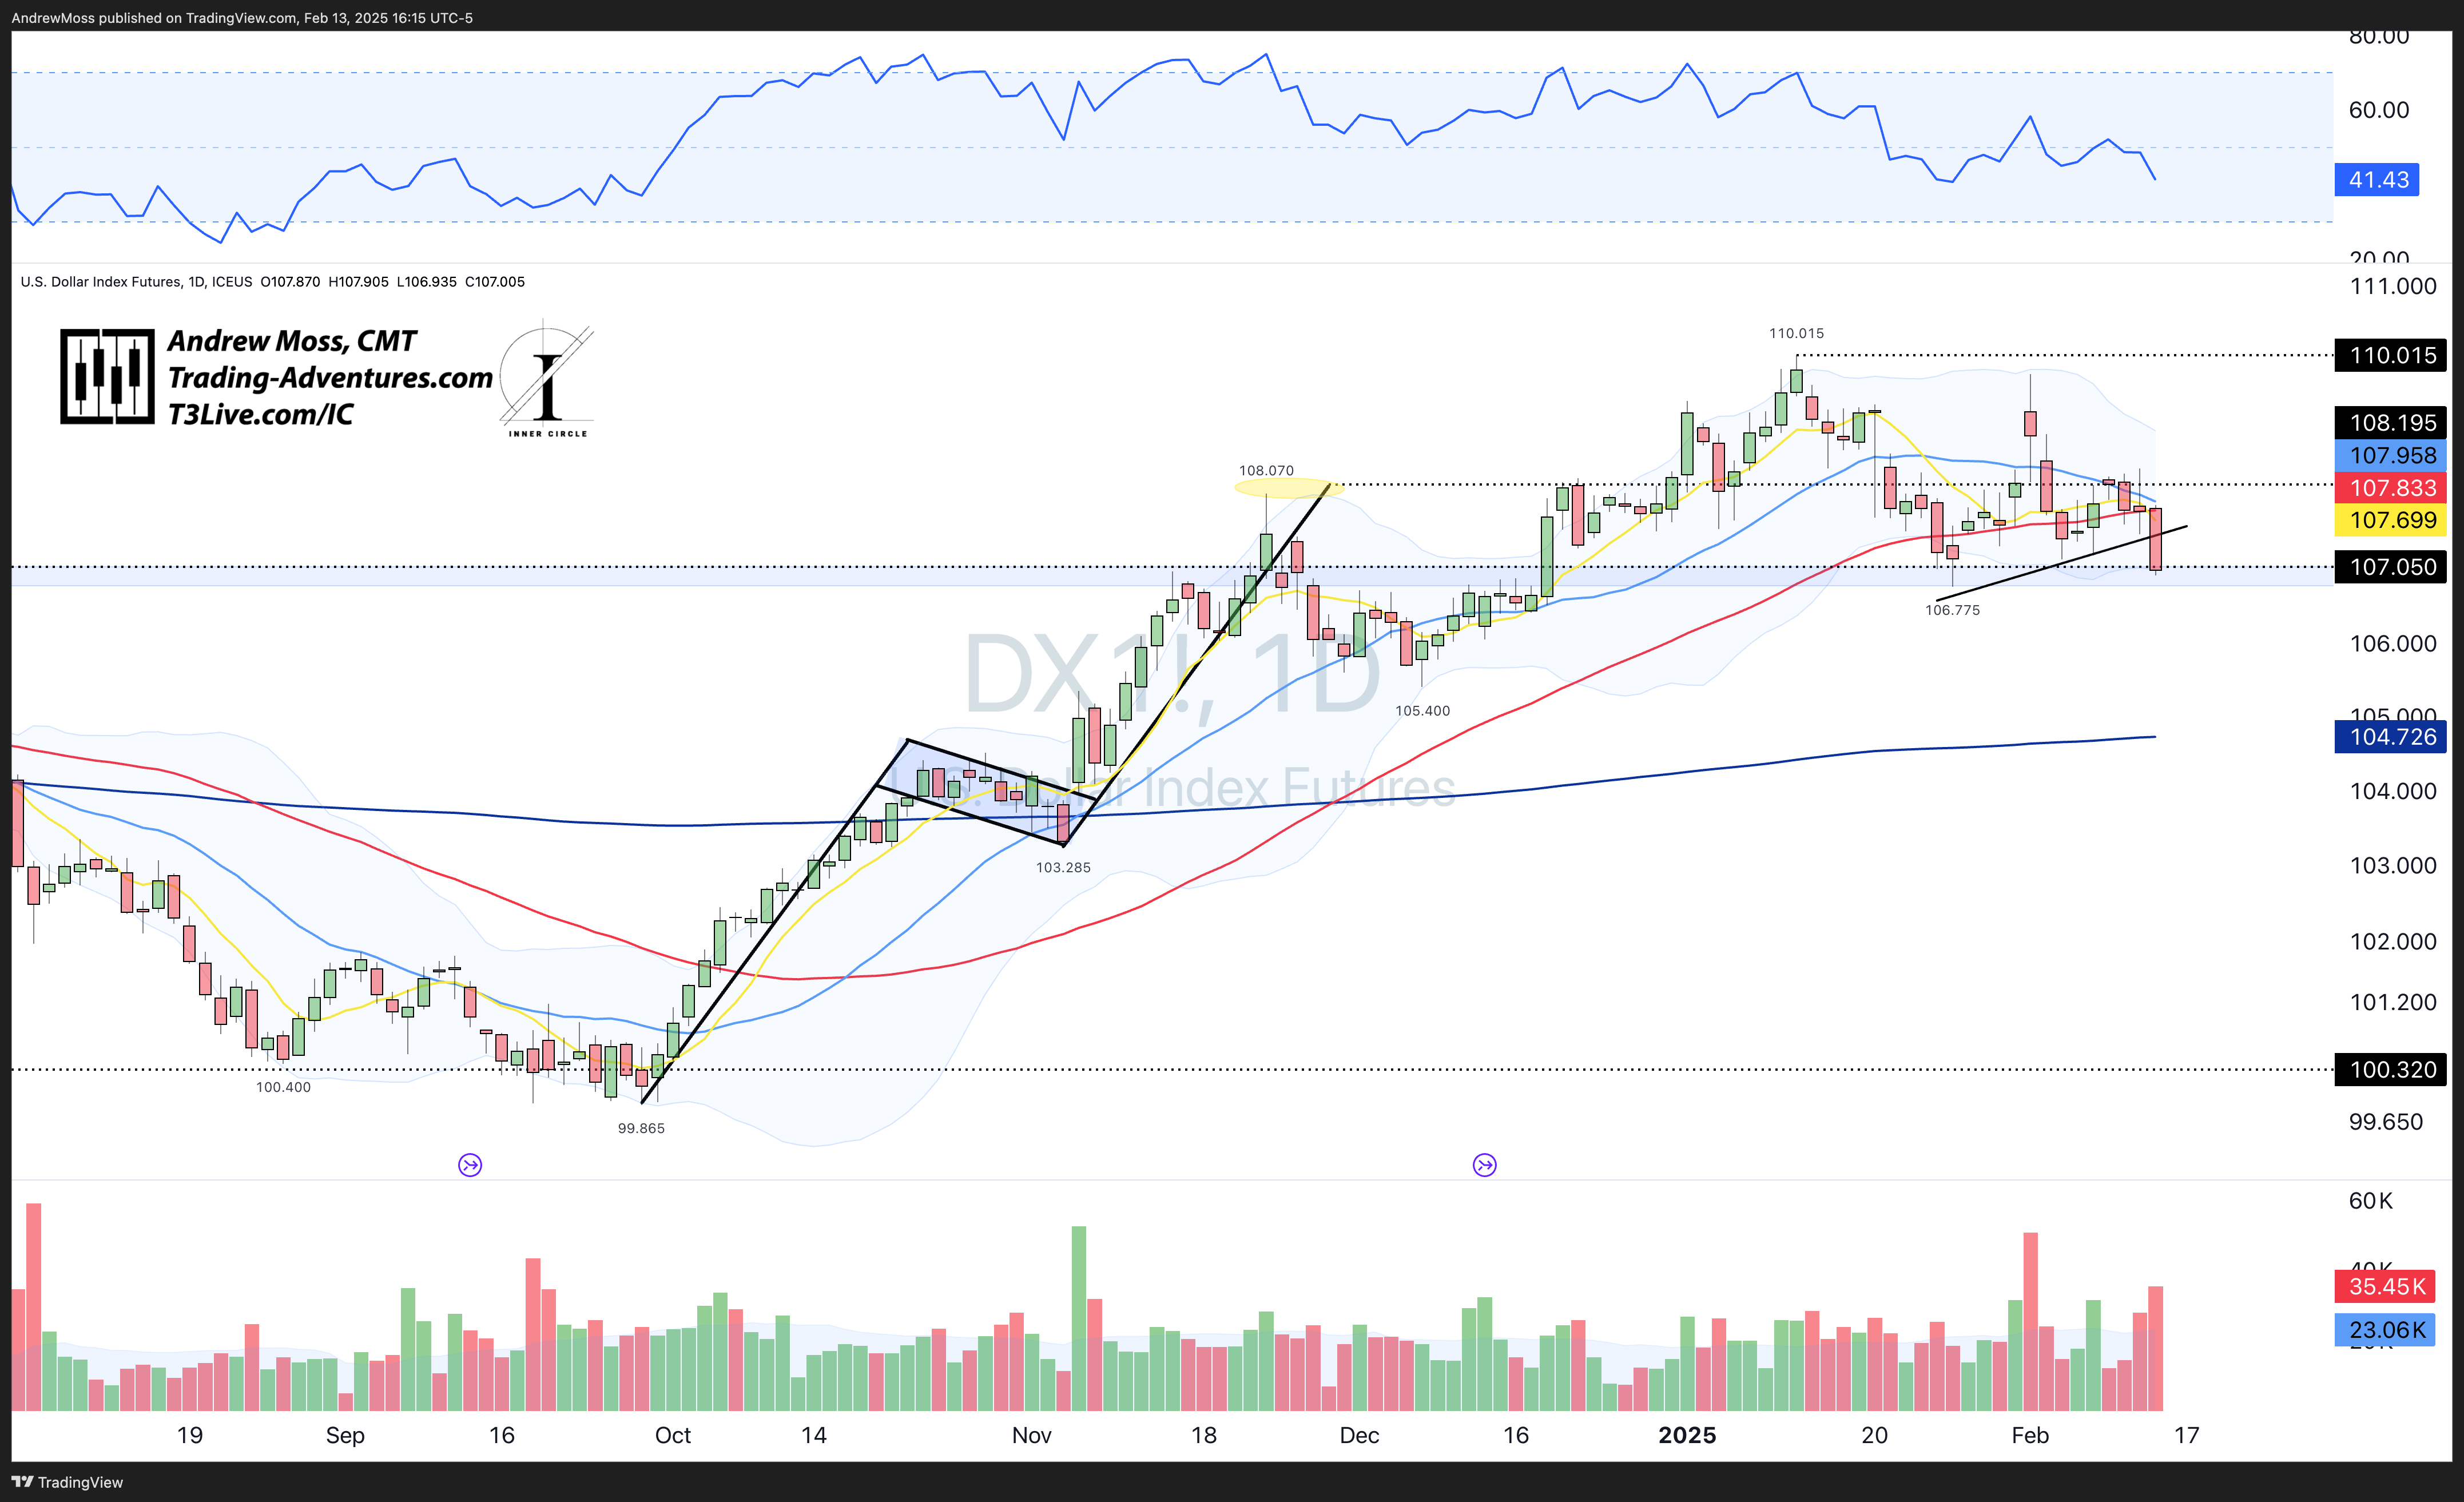
DXY Dollar futures were lower, breaking the trendline and testing the pivot —stocks like the action. $105.40 is a pivot to watch, and the 200-day MA is near $104.73. There is plenty of room to move lower if they want to.
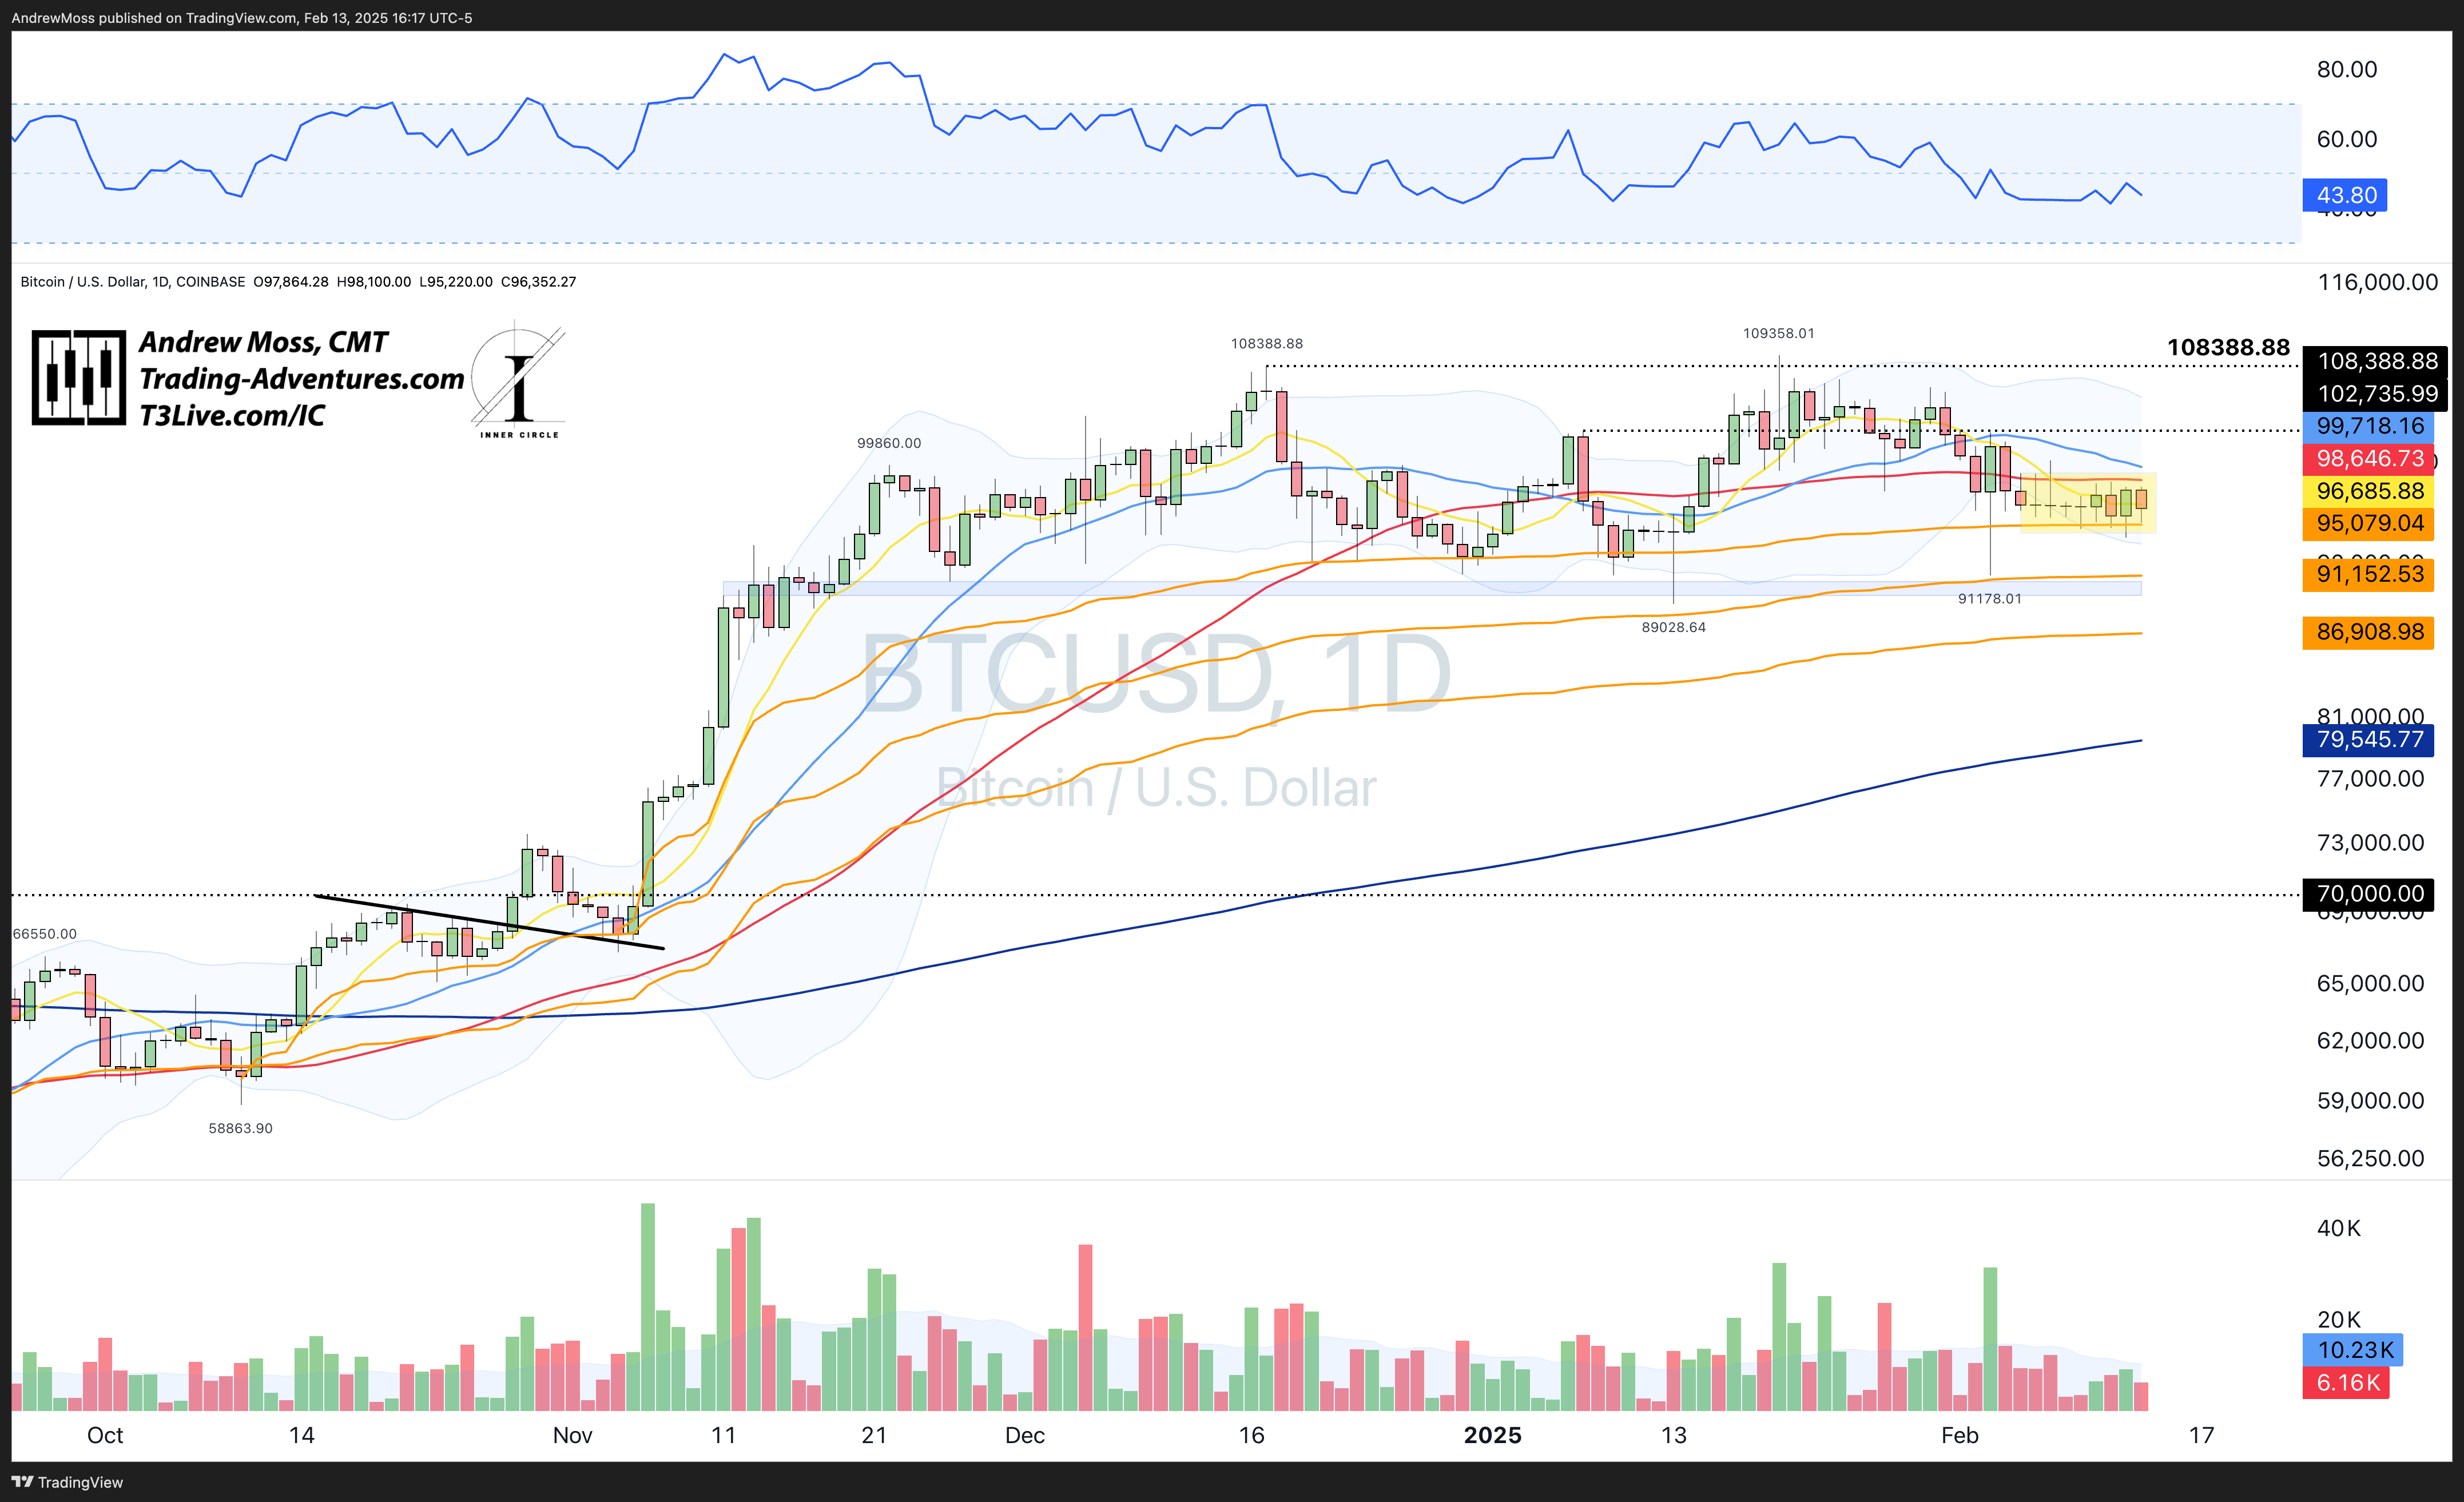
BTCUSD can’t get much tighter. For nine days, the price has mostly been contained in a $3,000 range spanning the early November low AVWAP and the 50-day MA. On four of those days, the opening and closing prices were virtually the same. When this range finally breaks, it could produce a sizeable move.
The Trade

—from Tuesday’s article
The other part of that segment mentioned stories, fundamentals, and other narratives, which can and do drive prices in the short term. Disregarding their effect can bear consequences.
While it can be beneficial to have a sense of what is going on outside of the charts, sometimes, those are the very factors that make trading difficult.
In the end, one fact remains.
Only price pays.
Looking For More?
Elevate Your Trading Adventure Even Further With These Offerings.

EpicTrades Options Newsletter
Real-time trade ideas and insights, providing actionable trading insights focusing on options trades with short-term horizons, aiming to capitalize on weekly market movements.
The approach includes detailed reasoning for trades, specific options, and profit targets. It focuses on quick gains with a minimal time commitment from subscribers.

The Inner Circle
The Inner Circle is a Virtual Trading Floor (VTF) at T3 Live. I’ve been working and trading with this group since 2022. You may have noticed the logo in the watermarks on my charts.
Founded by David Prince and led by him, Rick March, and Kira Turner, the Inner Circle is a community of elite traders, including hedge fund managers, family office heads, corporate executives, financial advisors, and even professional poker players.
Fundamental, Macro, and Technical Analysis all combine to find and discuss the best opportunities in current markets.

The Disclosures
***This is NOT financial advice. This is NOT a recommendation to buy, sell, or trade any security. The content presented here is intended for educational purposes only.