

Mid-Week Market Update
Mid-Week Market Update
and a look at Mid-Term election years

It hasn’t been the cleanest progression, but the bounce pattern we’ve been looking for (Could we see a bounce?) is getting some follow-through today as all three major indexes traded above this past Friday’s high.
We’ll bypass most of the charts (I’ll share two important ones) normally included in the Mid-Week Market Update, and look at the potential bigger-picture implications of this move.
From today:
That’s a pretty meaningful reversal in implied volatility $VIX

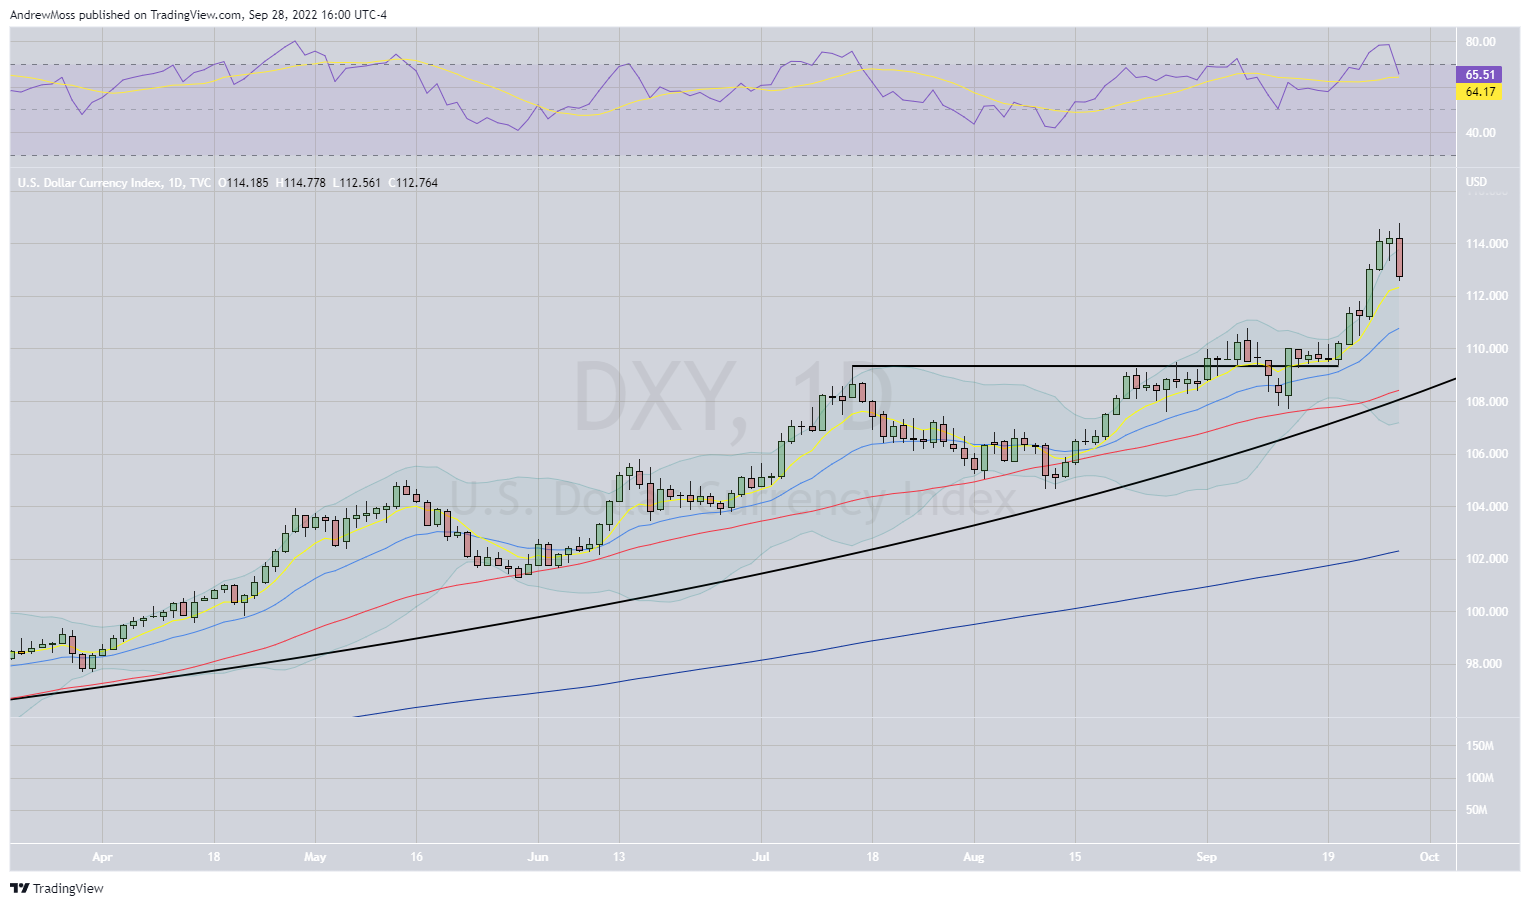
Check out the reversal in the US Dollar $DXY
On to the Election Cycle
Don’t make this political
It doesn’t matter. There have been plenty of bull and bear markets under the leadership of both parties. Frankly, politics are often the worst reason for, or against investing. The market doesn’t care so much who wins the vote, D or R.
The market does seem to pay some attention to the election cycle.
Think about what politicians are doing during this time. They’re campaigning. They’re offering solutions and making promises.
They’re going to fix everything that’s broken. Right?
Inflation
Interest rates
High prices
All of that will be taken care of if you vote for them. Right?
Sure.
It sounds ridiculous. Things aren’t that simple.
But is it possible that we are all subject to the slight changes in mood that can result from these promises?
A little hope can go a long way.
Impossible to prove? Perhaps. Again, it really doesn’t matter.
What does matter is knowing how these cycles have played out before. There is a pattern. We’ll take a look.
But first:
Of course, we need to be mindful of the bear case as well.
Of course, we’ve never seen a bear market environment where Treasuries, the risk-off asset, have declined more than stocks.
Of course, we haven’t seen inflation like this since the 1980s
Of course …..
You get the idea. There’s no shortage of risk and concern out there. There never is.
Things that have never happened before happen almost every day in the stock market.
Always, always, always manage risk.
But don’t forget about the upside potential.
Moving on. Here are some factors that could lead to a sizeable bounce.
Election Cycles
Looking at the average mid-term election year, and specifically what happens over the next two quarters, we can see that it is not uncommon to have a dip followed by a significant bounce.


The fourth quarter of the mid-term cycle and the first quarter of the pre-election year are, on average, the best two performing quarters.
J.C. Parets at All-Star Charts has done some great work on this. He writes-
“This summer’s low is historically THE dip to be buying in the 4-year cycle.”


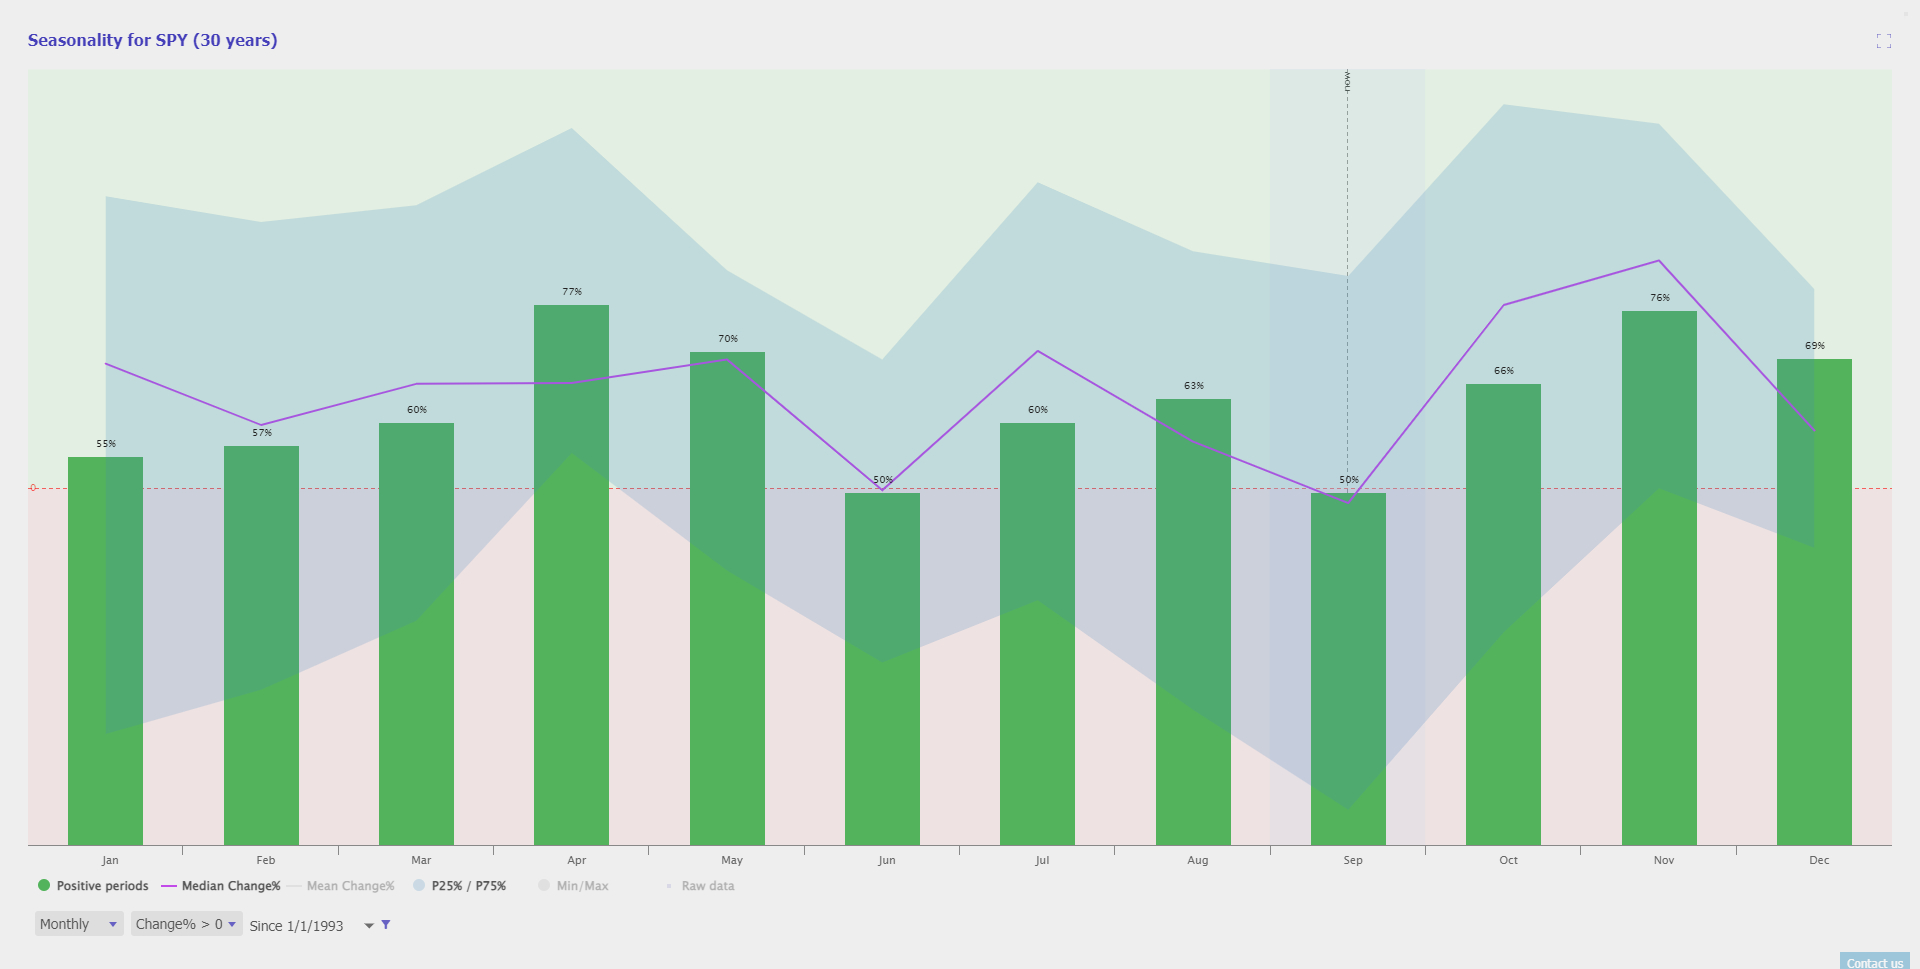
Seasonality
Since 1993 September has been one of the worst months for $SPY. But the fourth quarter, October-December has been the strongest 3-month period.
Sentiment-
It’s hard to find many bulls out there. The mood is sour and I’m not hearing from too many people that are optimistic about the stock market. But what does the real data show?
Some comments on the American Association of Individual Investors (AAII) survey-


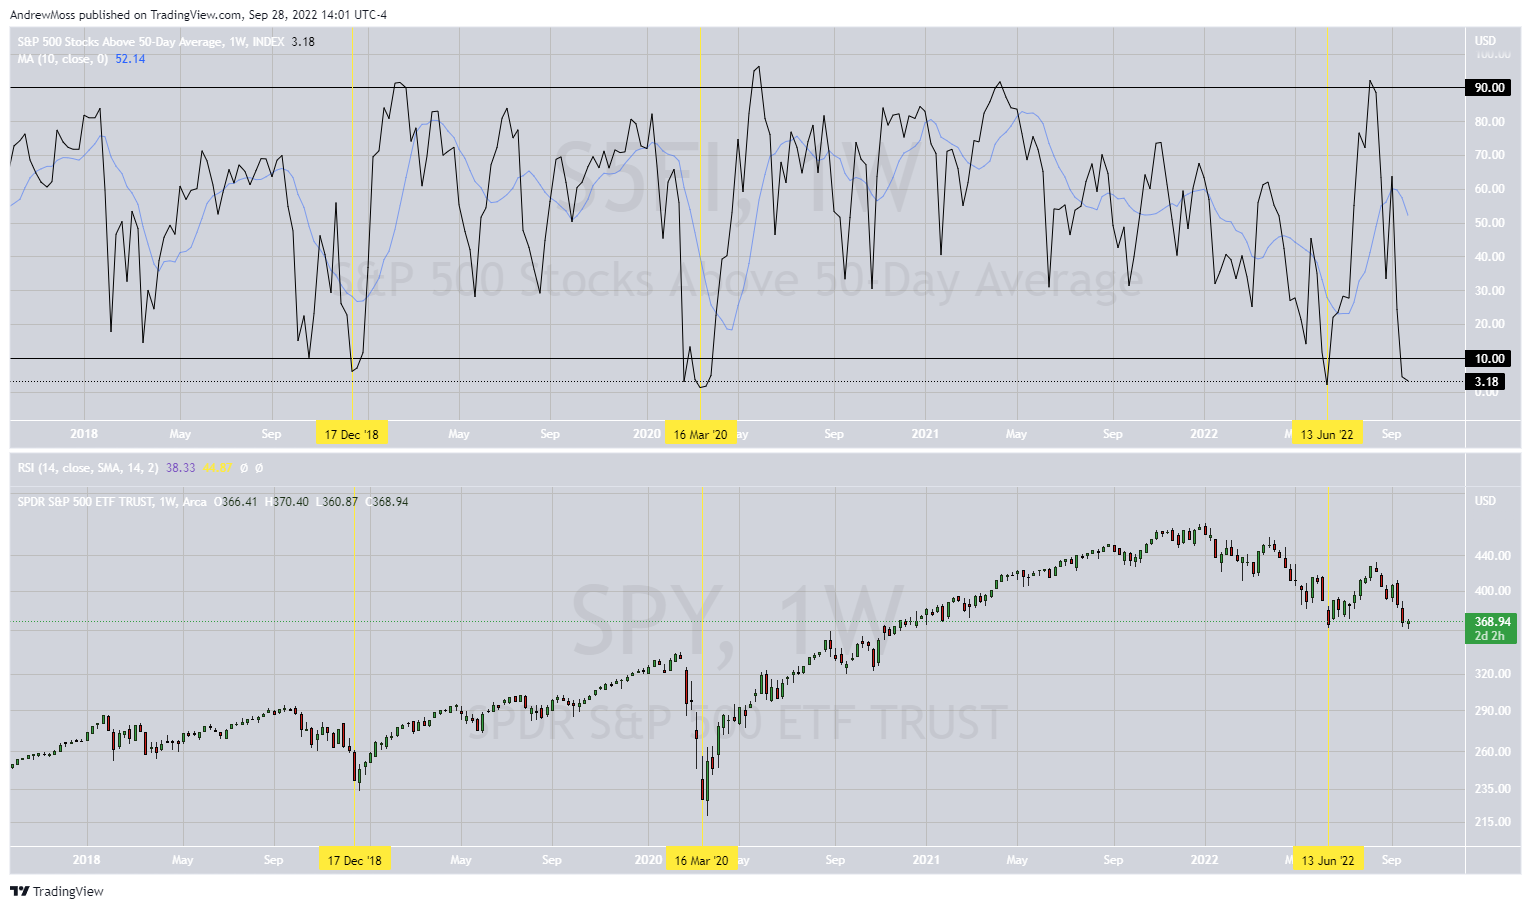
The market is oversold
Only 3% of SP 500 stocks are above their 50-day moving average. That’s not bullish. But it does lend a hand to the case for a bounce.
Positioning -
People aren’t just bearish in the surveys. They’re putting their money where their mouths are too. Put volume is at never before seen levels. Climaxes like this don’t tend to persist and can be contrarian indicators.


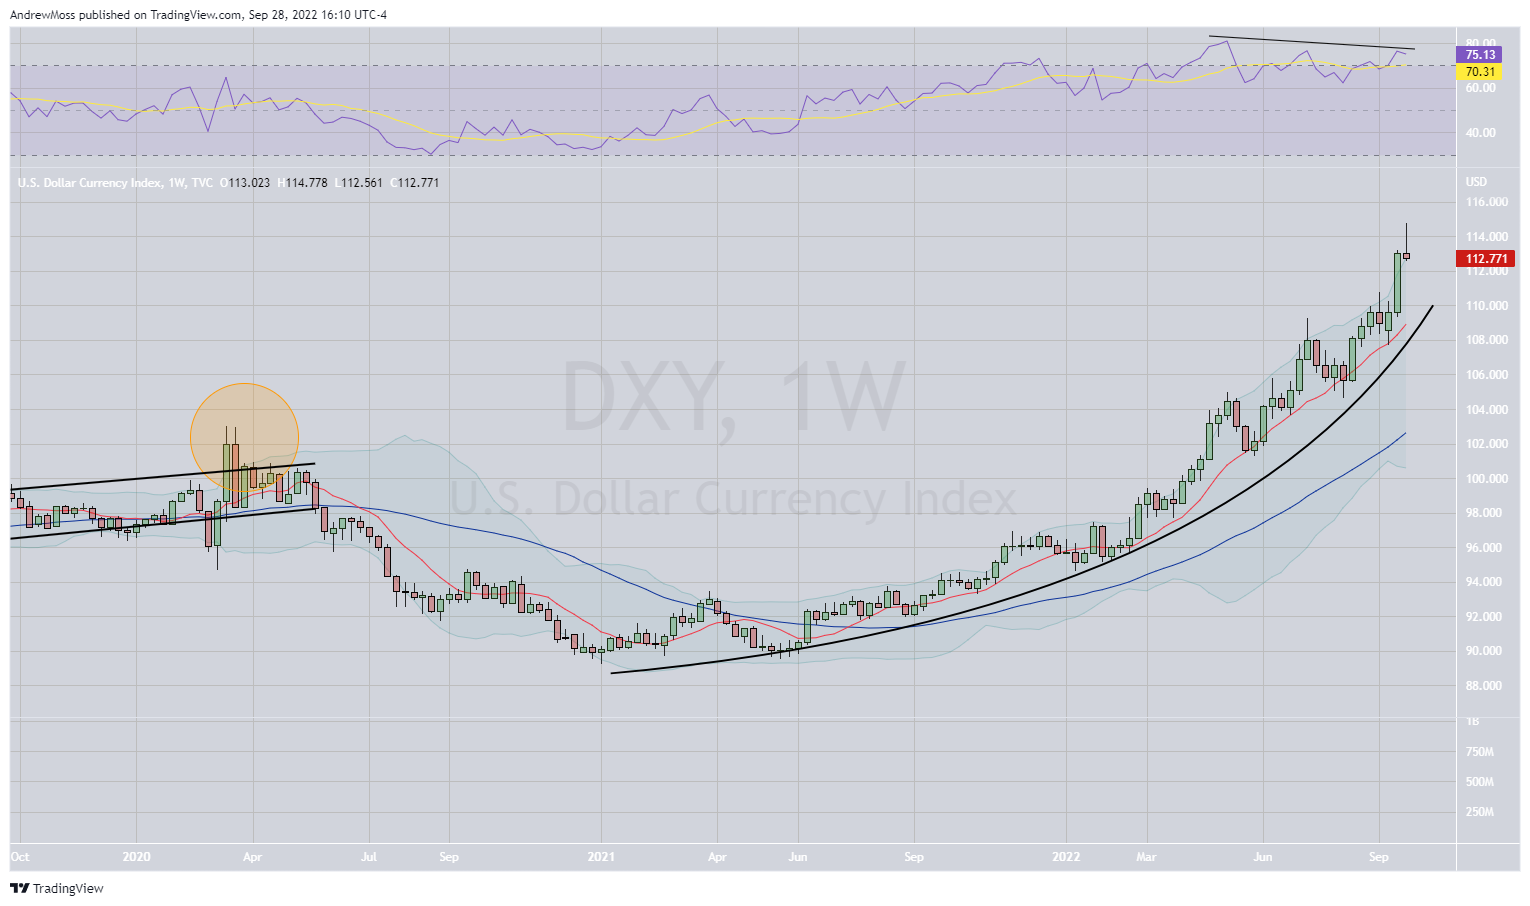
Relief from the rising Dollar
Finally, a chart I’ve shared many times. With this update, there is a potential reversal candle forming and a slight bearish RSI divergence. We’ll need to see how the week finishes. A downward move in the dollar will be required if we’re going to see higher stock prices.
So, will this week mark a bottom? As we’ve just seen, there is data to support that case. While we can never know with any certainty what will happen next. Studying these patterns and tendencies can help us stack the odds in our favor.
As always, follow charts and your rules, trade smart, and manage your risk.
***This is NOT financial advice. NOT a recommendation to buy, sell, or trade any security. The content presented here is intended for educational purposes only.
Andrew Moss is an associated member of T3 Trading Group, LLC (“T3TG”) a SEC registered broker/dealer and member of FINRA/SIPC. All trades placed by Mr. Moss are done through T3TG.
Statements in this article represent the opinions of that person only and do not necessarily reflect the opinions of T3TG or any other person associated with T3TG.
It is possible that Mr. Moss may hold an investment position (or may be contemplating holding an investment position) that is inconsistent with the information provided or the opinion being expressed. This may reflect the financial or other circumstances of the individual or it may reflect some other consideration. Readers of this article should take this into account when evaluating the information provided or the opinions being expressed.
All investments are subject to risk of loss, which you should consider in making any investment decisions. Readers of this article should consult with their financial advisors, attorneys, accountants or other qualified investors prior to making any investment decision.
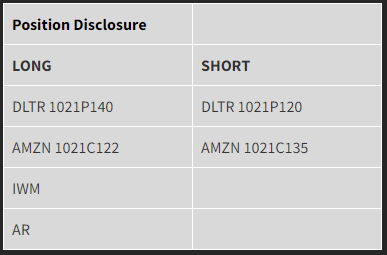
Please Note: short puts are synthetic longs, and short calls are synthetic shorts
Options symbols are denoted as follows:
Ticker, Date, Call/Put, Strike Price
Example: VXX1218C30 = VXX 12/18 Call with a $30 strike