

Mixed Markets And Bad Breadth
Looking beneath the surface as $QQQ makes new highs while $IWM loses momentum

I am pleased to announce the launch of reader-supported subscriptions to Trading-Adventures.com. For just $15 a month, you can further support this work and enhance your Trading Adventure.
Go deeper than the indexes to analyze market moves beneath the surface.
More charts, more analysis, and more education to improve your trading and enhance your success.
Subscribe now to support this Trading Adventure and take a significant step forward on your own. It's all available for less than a cup of coffee each week.
Been here a while and enjoy the freebies? No worries. Free subscribers will continue to receive the Market Update articles twice a week.
And you can help in other ways.
Share Trading Adventures
Forward this email to friends, family, coworkers, and fellow traders
Thank you for considering a paid subscription to Trading Adventures. I look forward to supporting you on your trading journey!
The Markets
Declining breadth is all the talk in markets this week as the number of falling stocks continues to rise. Jason Goepfert shares that today is the ninth consecutive day of negative market breadth (the number of stocks declining is higher than the number of stocks advancing — a rare occurrence.
He says, “That's happened fewer than 20 times in ~70 years. On average, the S&P has been -12% from its high during these streaks.”
Grant Hawkridge illustrates the data differently by showing the percentage of SP 500 stocks making new one-month lows and pointing out (this morning before the open) that “We have now experienced eight consecutive days with more S&P 500 stocks declining than advancing.”

So, while some indexes continue to hold up—or, in the case of the NASDAQ 100, made news highs yesterday—beneath the surface, we can see a divergence. Does that mean we should sell, raise cash, and run for cover?
That answer depends on individual time frames, trading styles, and risk tolerances. Many active traders have done much less and have fewer positions. For long-term investors, this information is probably best used as context and preparation.
Could this develop into something more? Sure. But history suggests this isn’t a major cautionary event.
Readers can find more stats and info from Goepfert here and from Hawkridge here.
(Both are great follows on X. You can find them, and a few other related accounts on my Stats and Data list, here)
We go through all of that to then look at this.
Seasonality
December is typically a very strong month, particularly in years that have been very strong up to that point. However, the first two weeks of December are generally flat to down.
So why aren’t the markets pulling back?
Well, they are. You just wouldn’t know it by looking at the SP 500 or NASDAQ.
The SP 500 has so far come pretty close to the average return for this two-week time frame, as shown in the chart below from Ryan Detrick. The index is currently up 0.30% since the close on Nov. 30.

The Dow Jones Industrial Average and Russell 2000 are down, as the following charts show.
Looking further, AMZN, GOOGL, META, and TSLA all made new highs this week, concurrent with the QQQ. Meanwhile, only one Dow 30 stock has done so, AAPL.
So, it’s been a bit of a mixed bag. Stock plays have been specific and limited - consistent with Monday’s comments —
The Charts
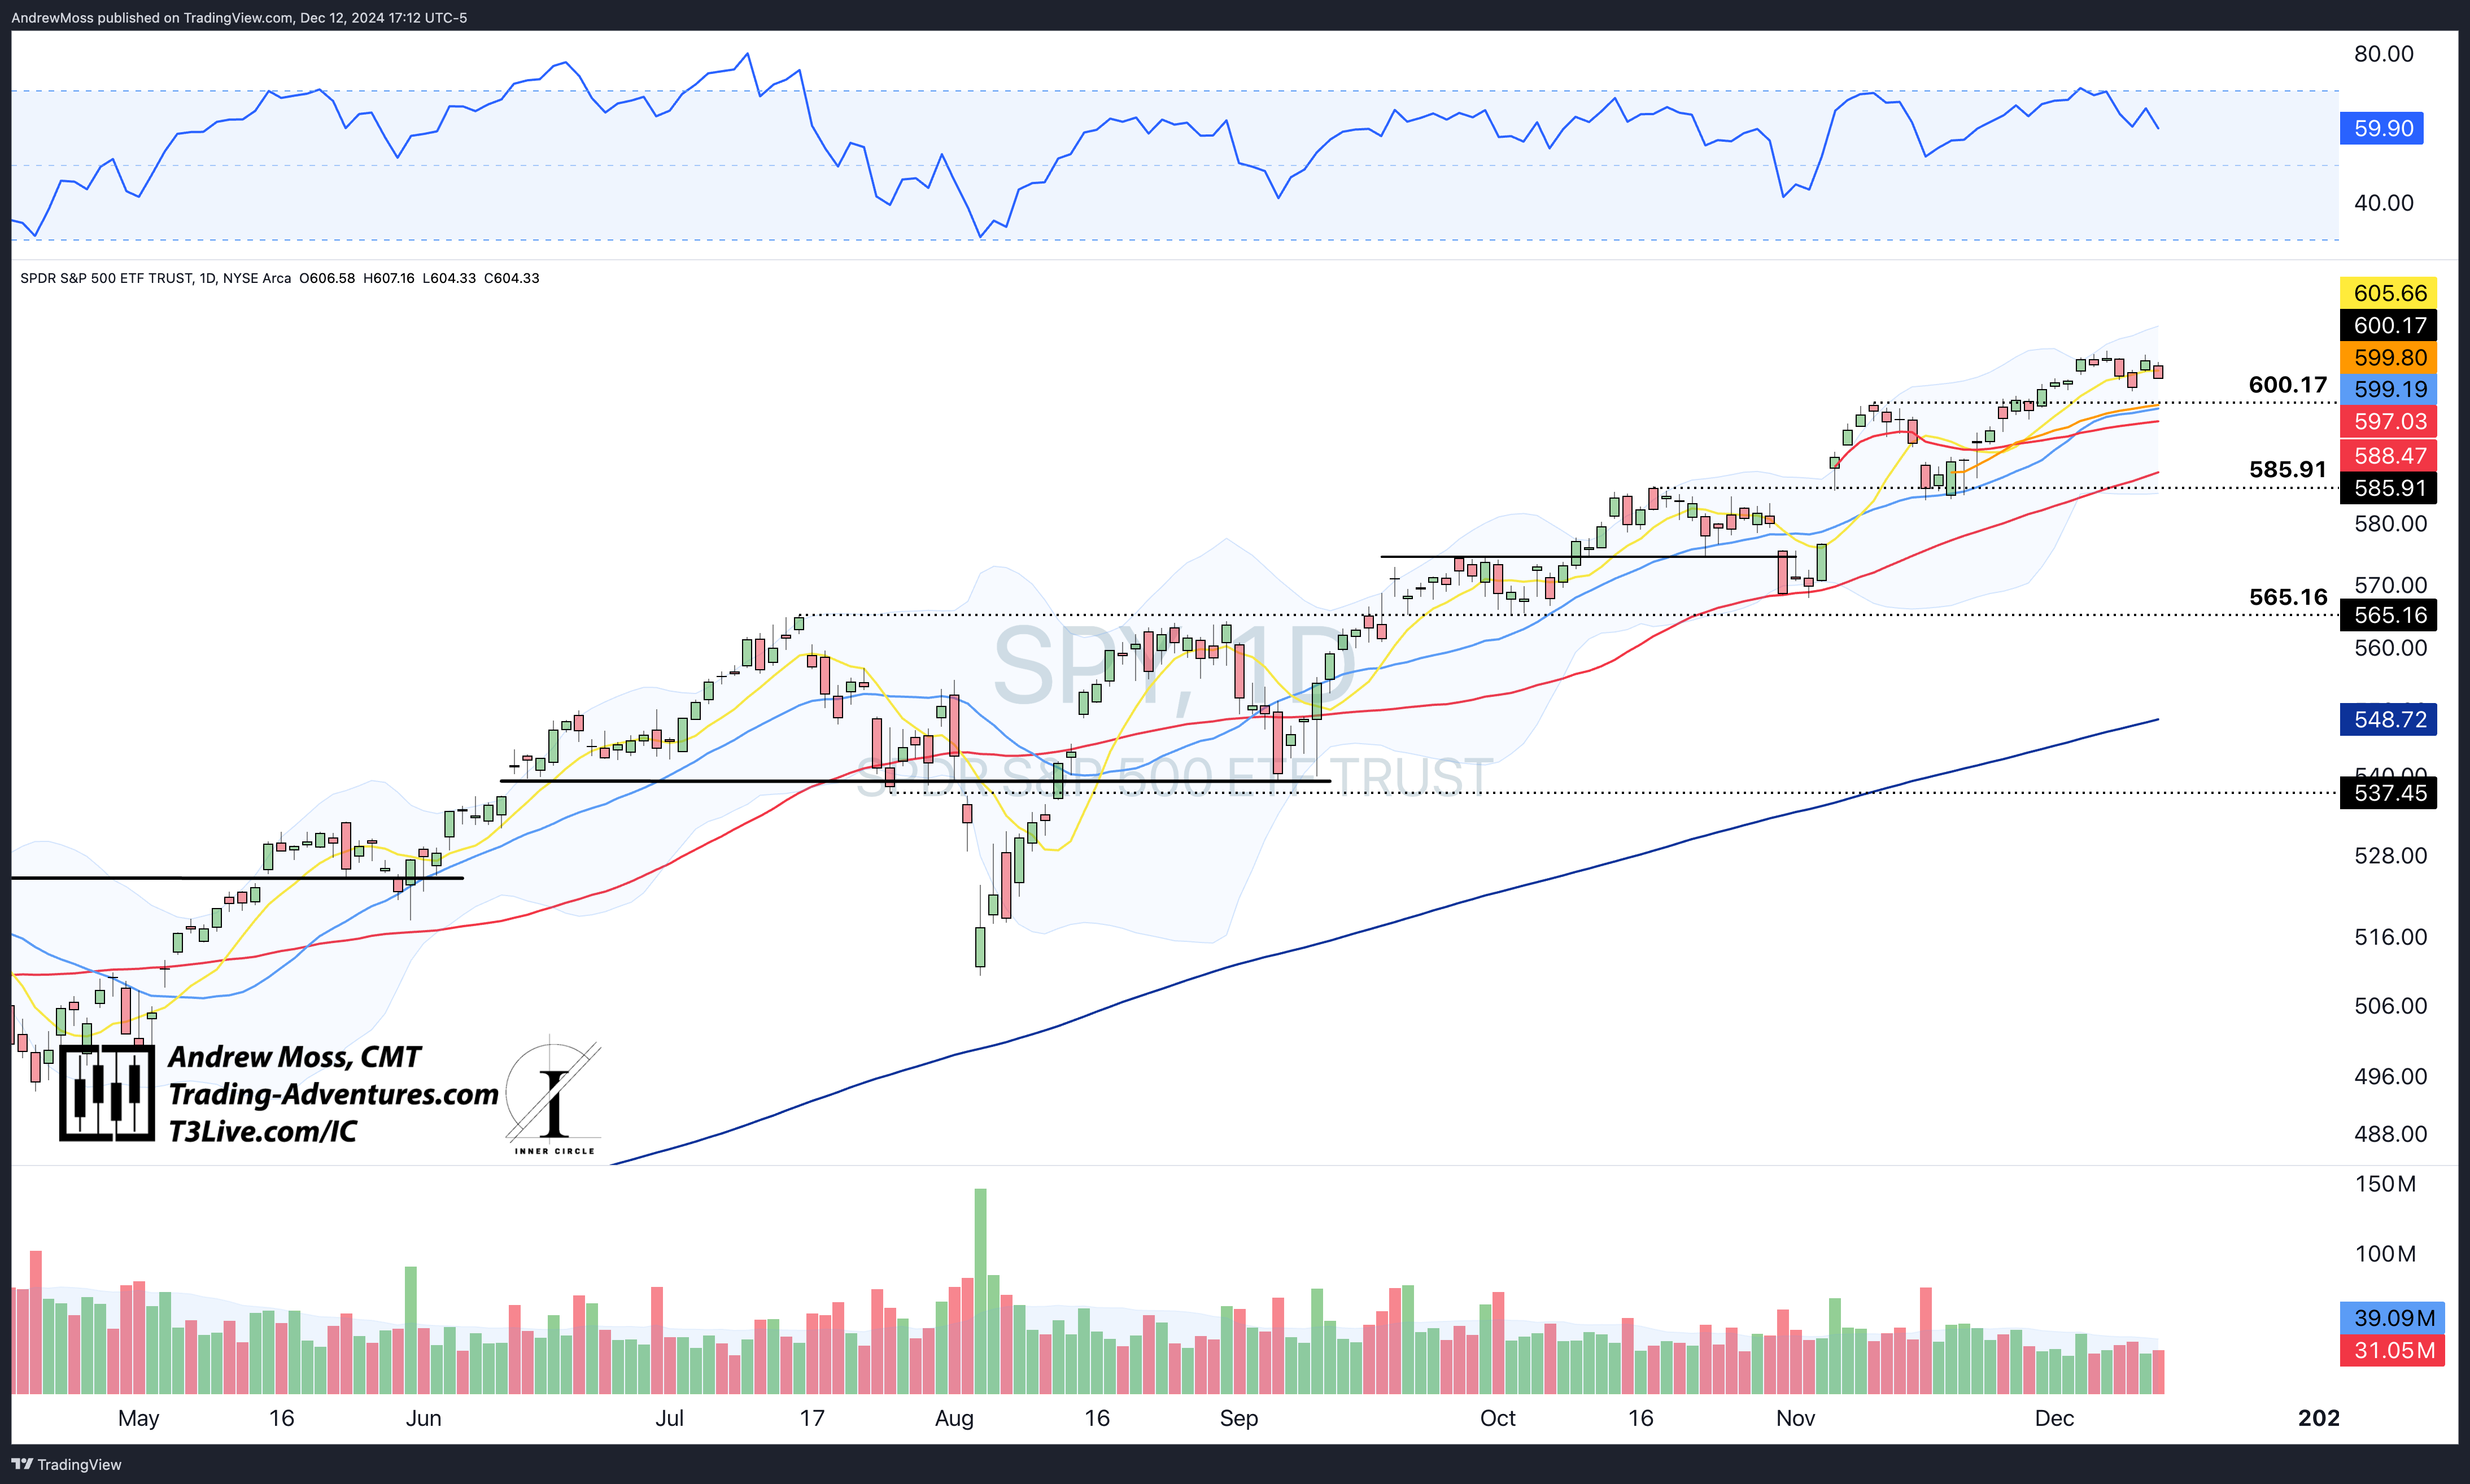
SPY continues in a sideways range above the $600.17 pivot high. Potential support levels haven’t changed much, though they have risen closer to the Nov. pivot.
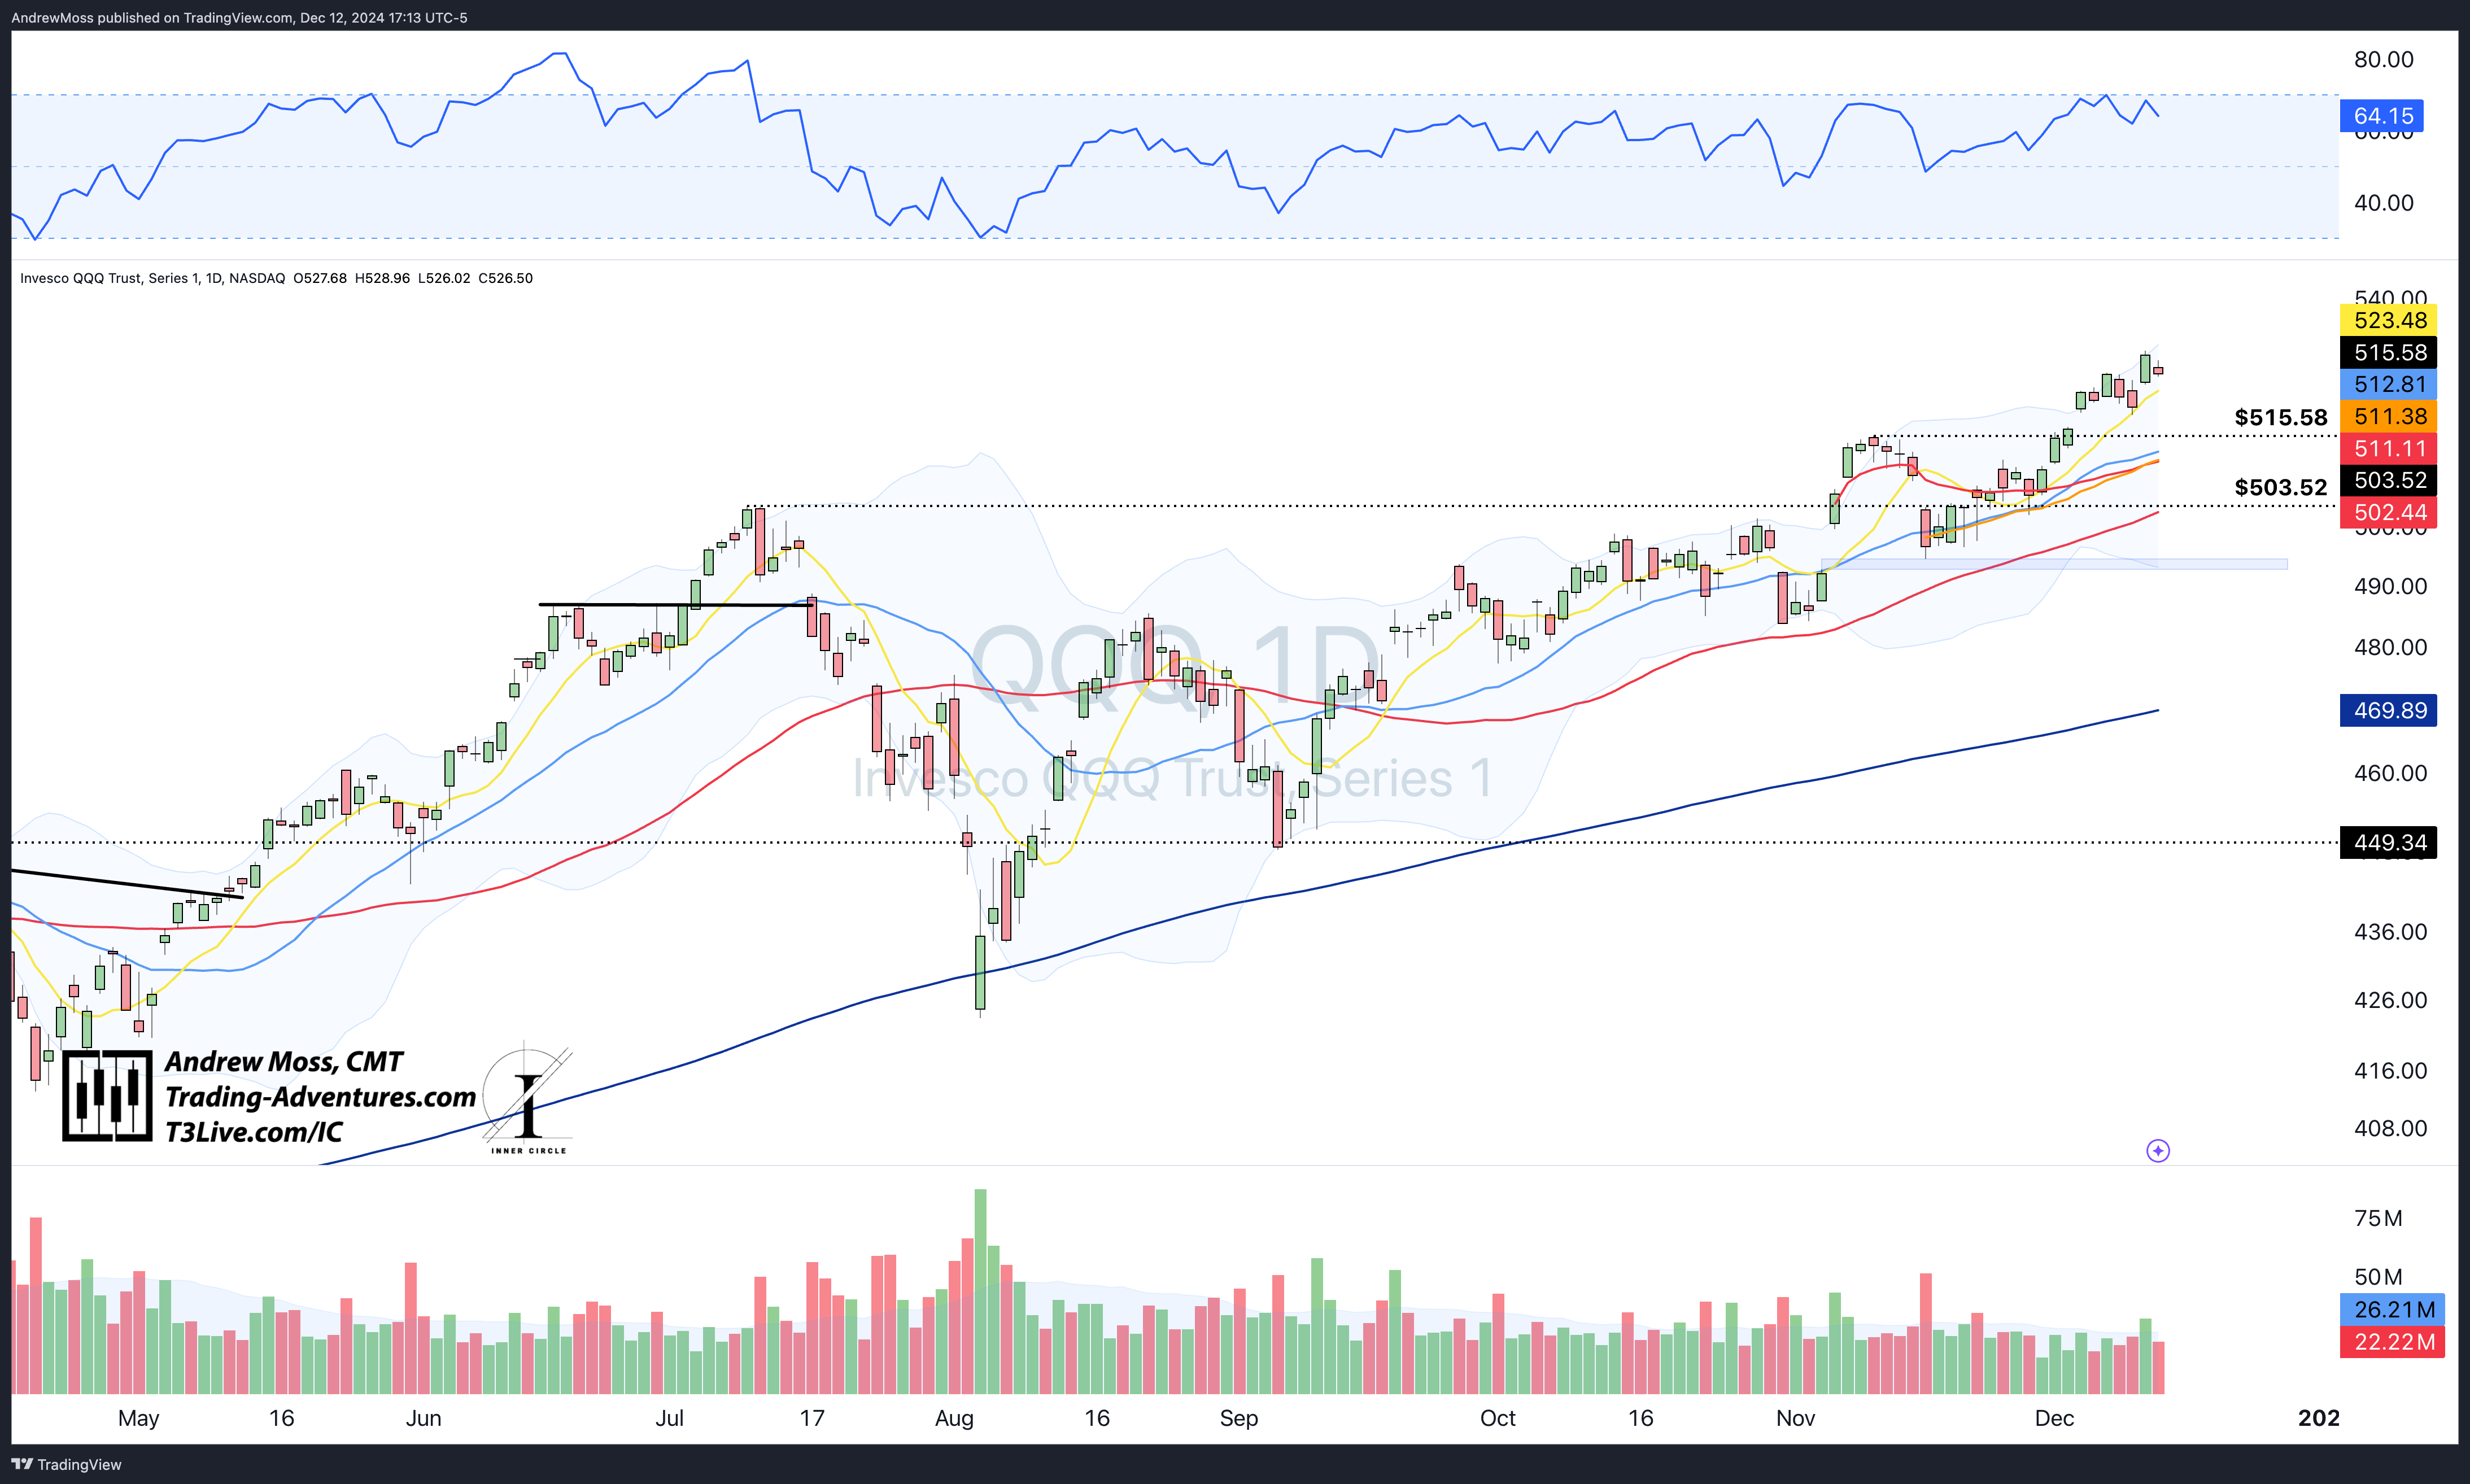
QQQ notched another new closing high yesterday and stayed inside that range today and above the 8-day MA. ~$515 is still the next potential support level.
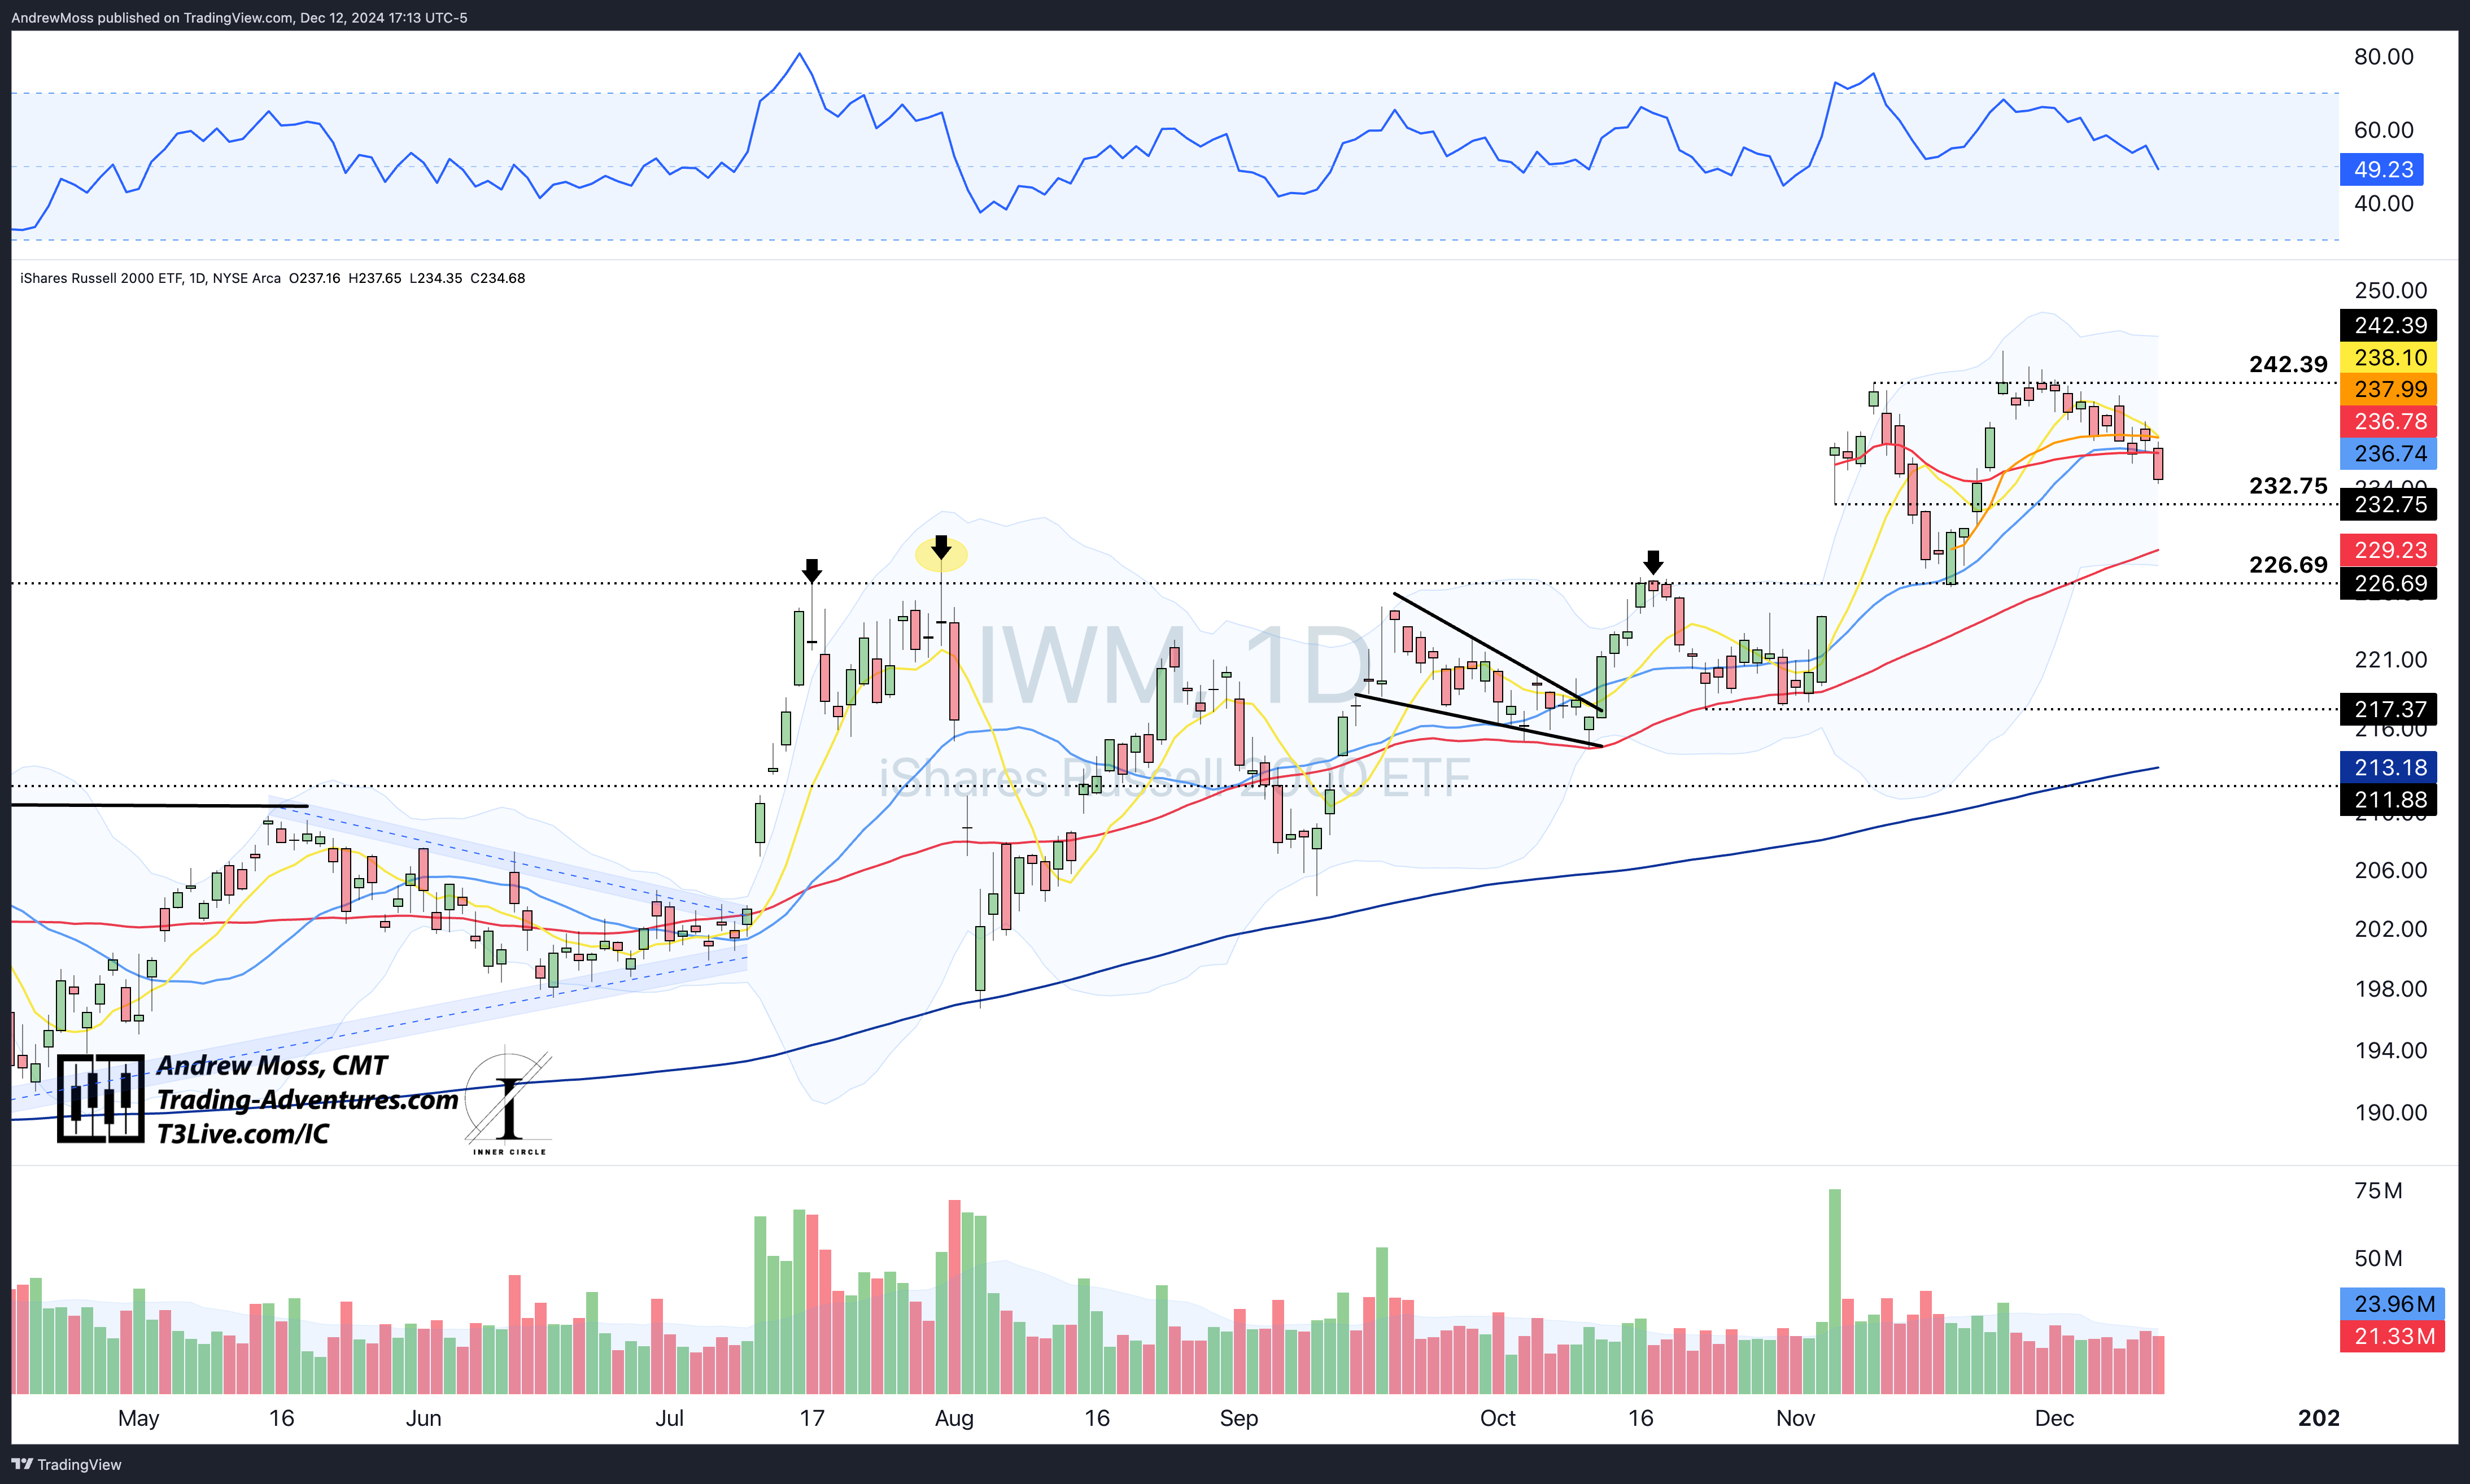
IWM is now down -4.20 % from the peak of Nov. 25. It’s below the 8 and 21-day MAs and the recent AVWAPs from the election gap and subsequent pivot low of Nov. 19. Failed breakout? Not exactly, since it never closed far enough above the $242.39 pivot breakout level. But it does look susceptible to more selling. Potential support is at the $232.75 pivot, followed by the 50-day MA.
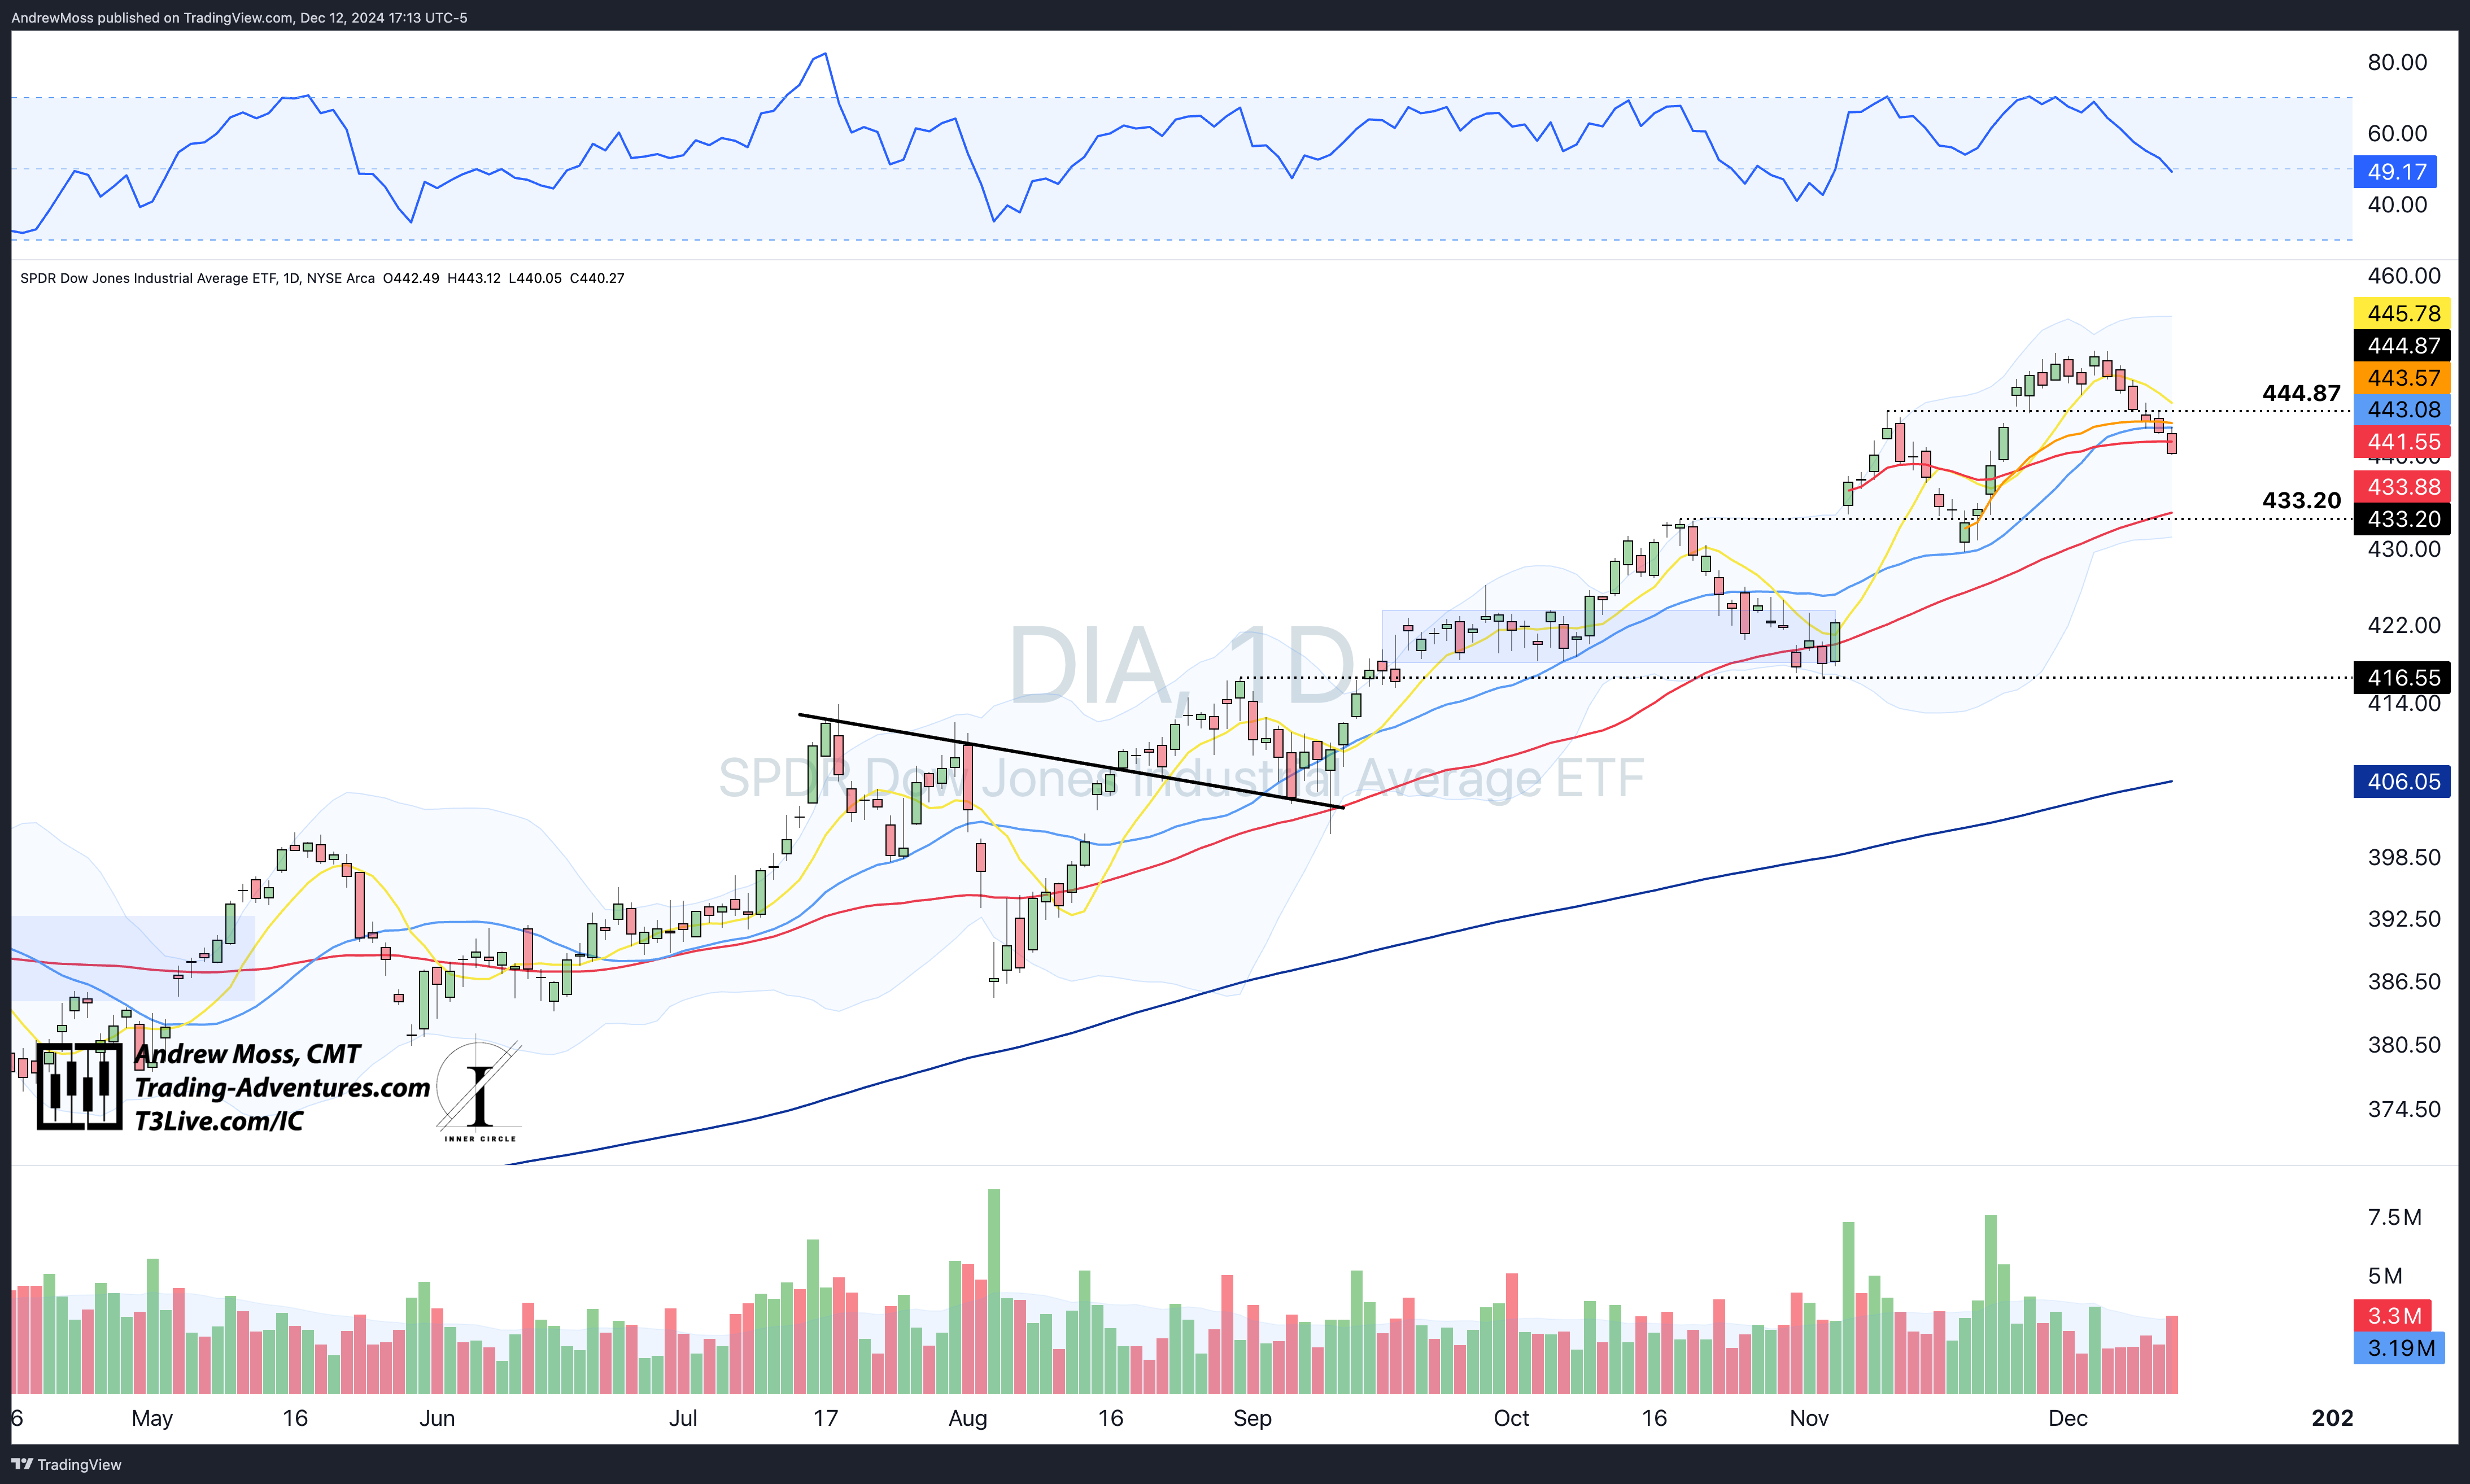
DIA is also below its 8 and 21-day MAs and the recent AVWAPs. ~$433 is the next area for possible support.
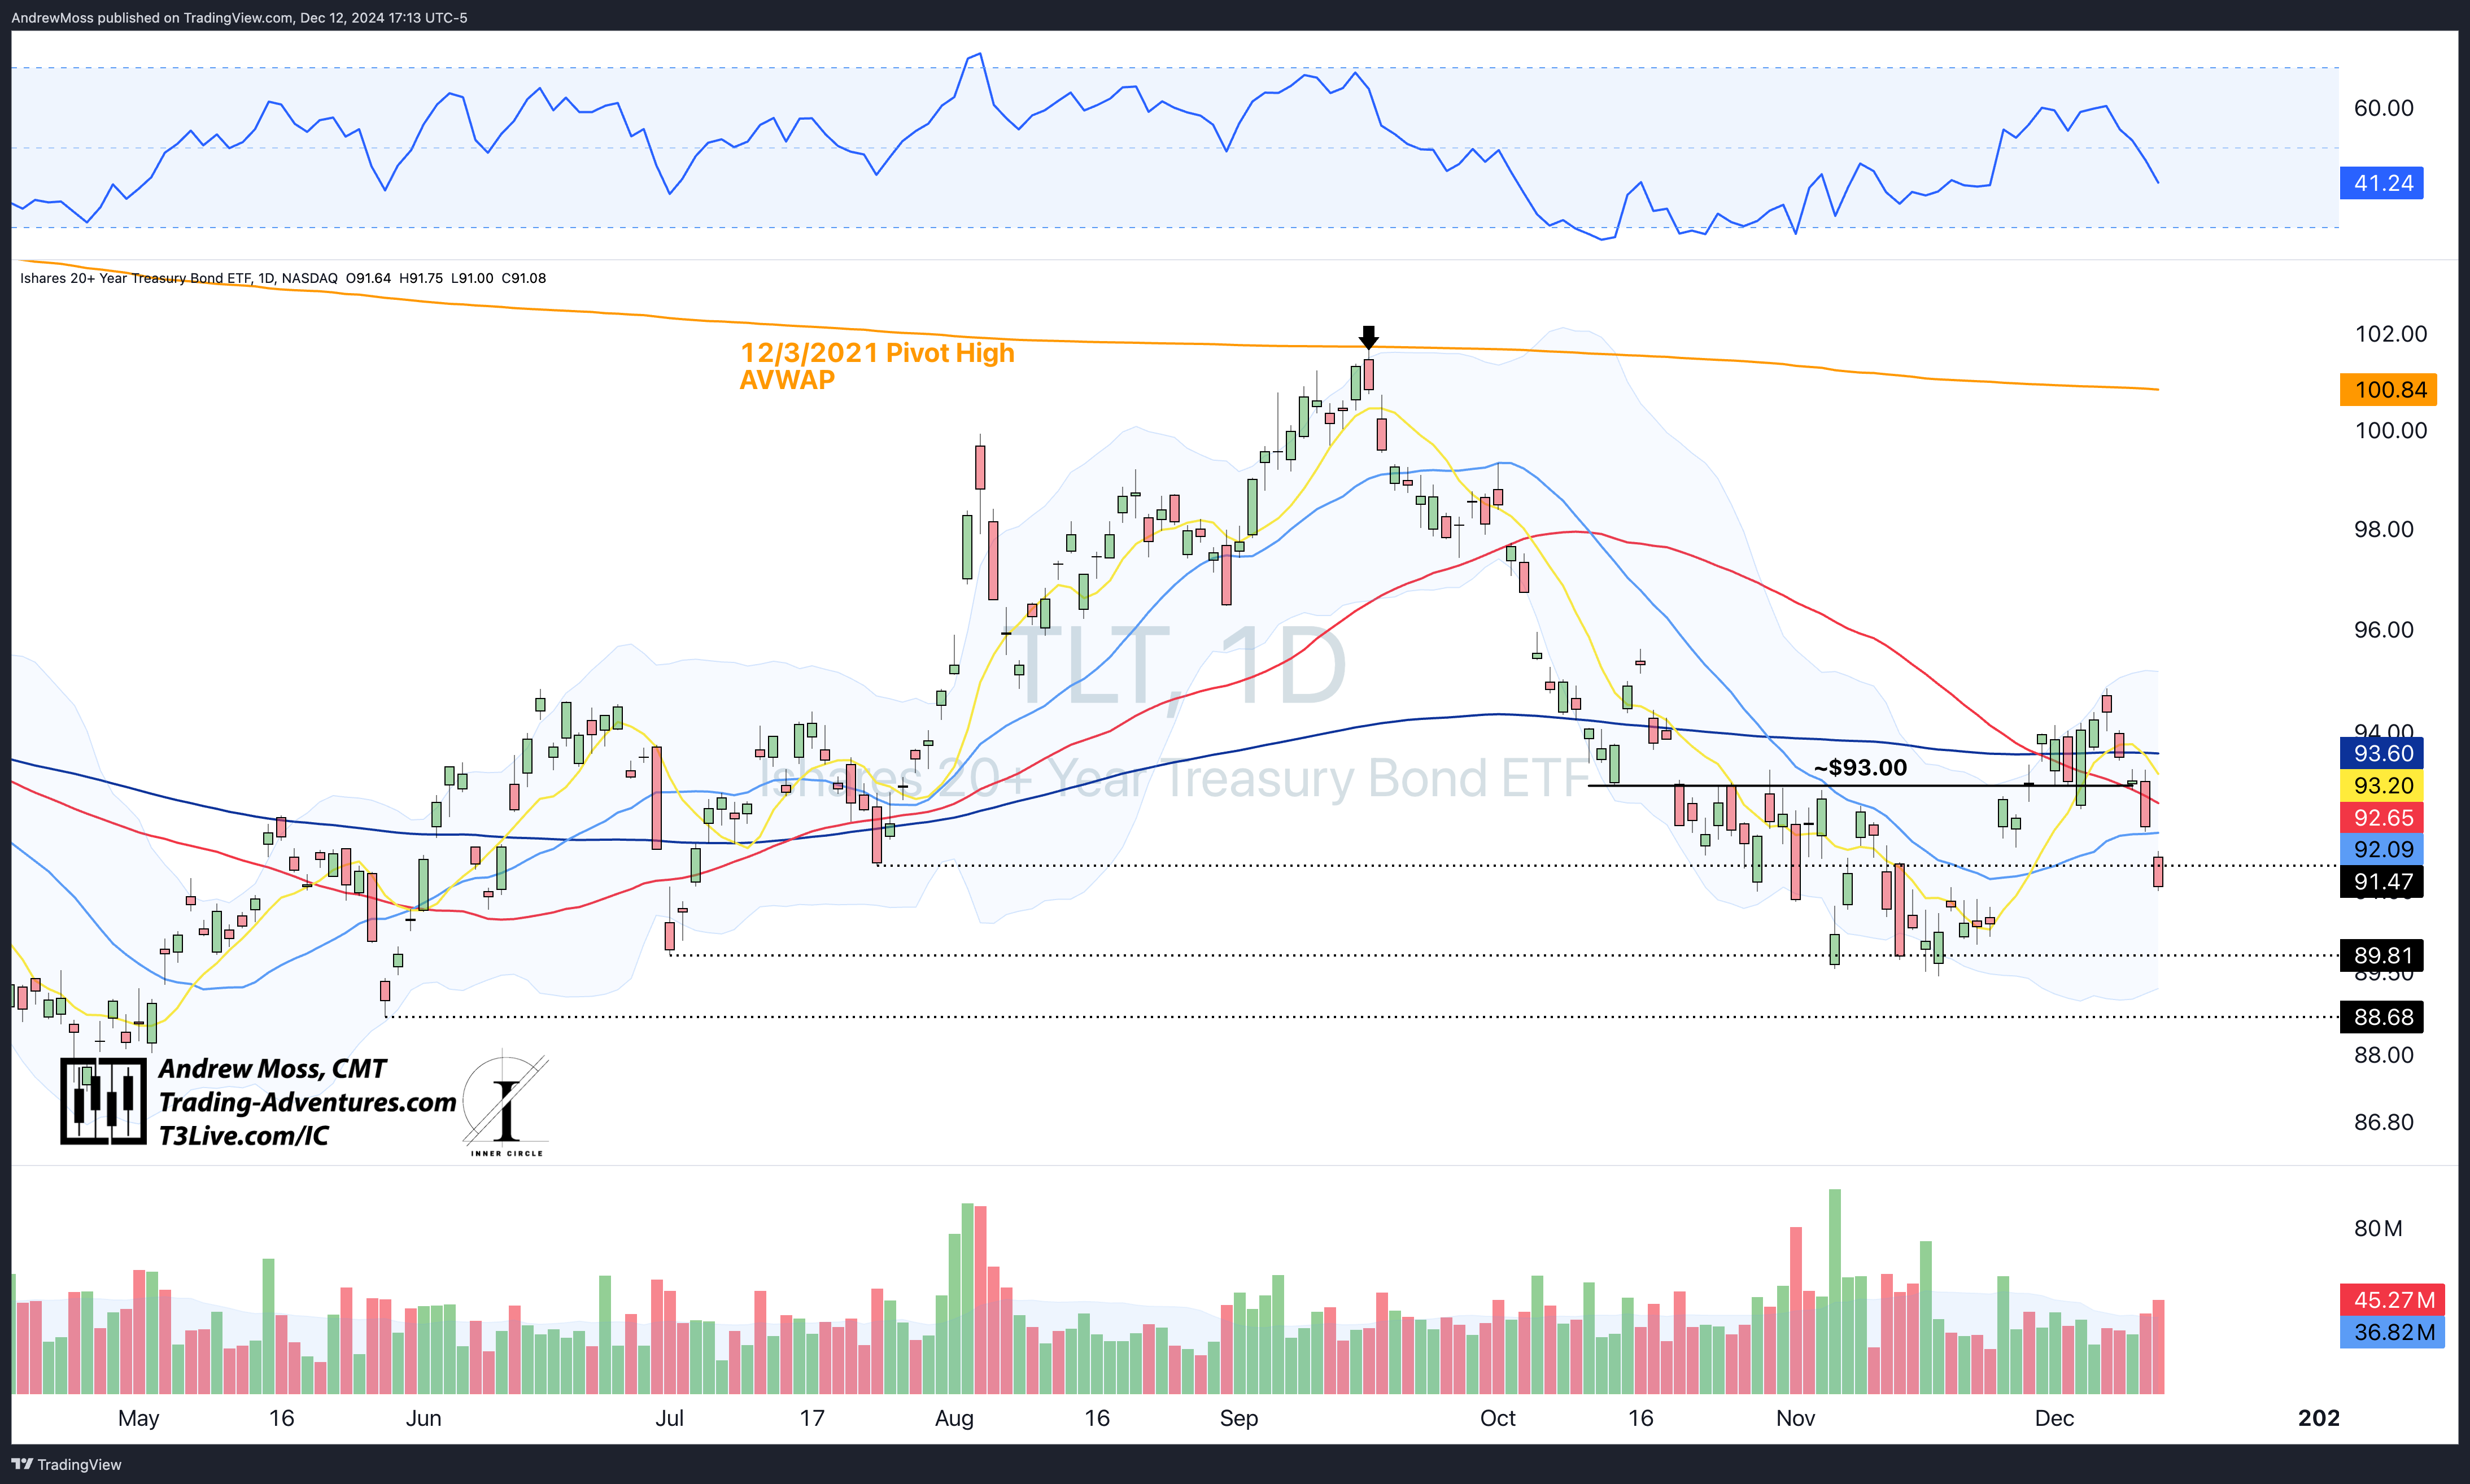
TLT has given up most of its recent gains. We seem to see its ‘headwind’ affect DIA and IWM without hindering SPY and QQQ. Five days of sharply lower action have taken the ‘oomph’ out of this recovery attempt.
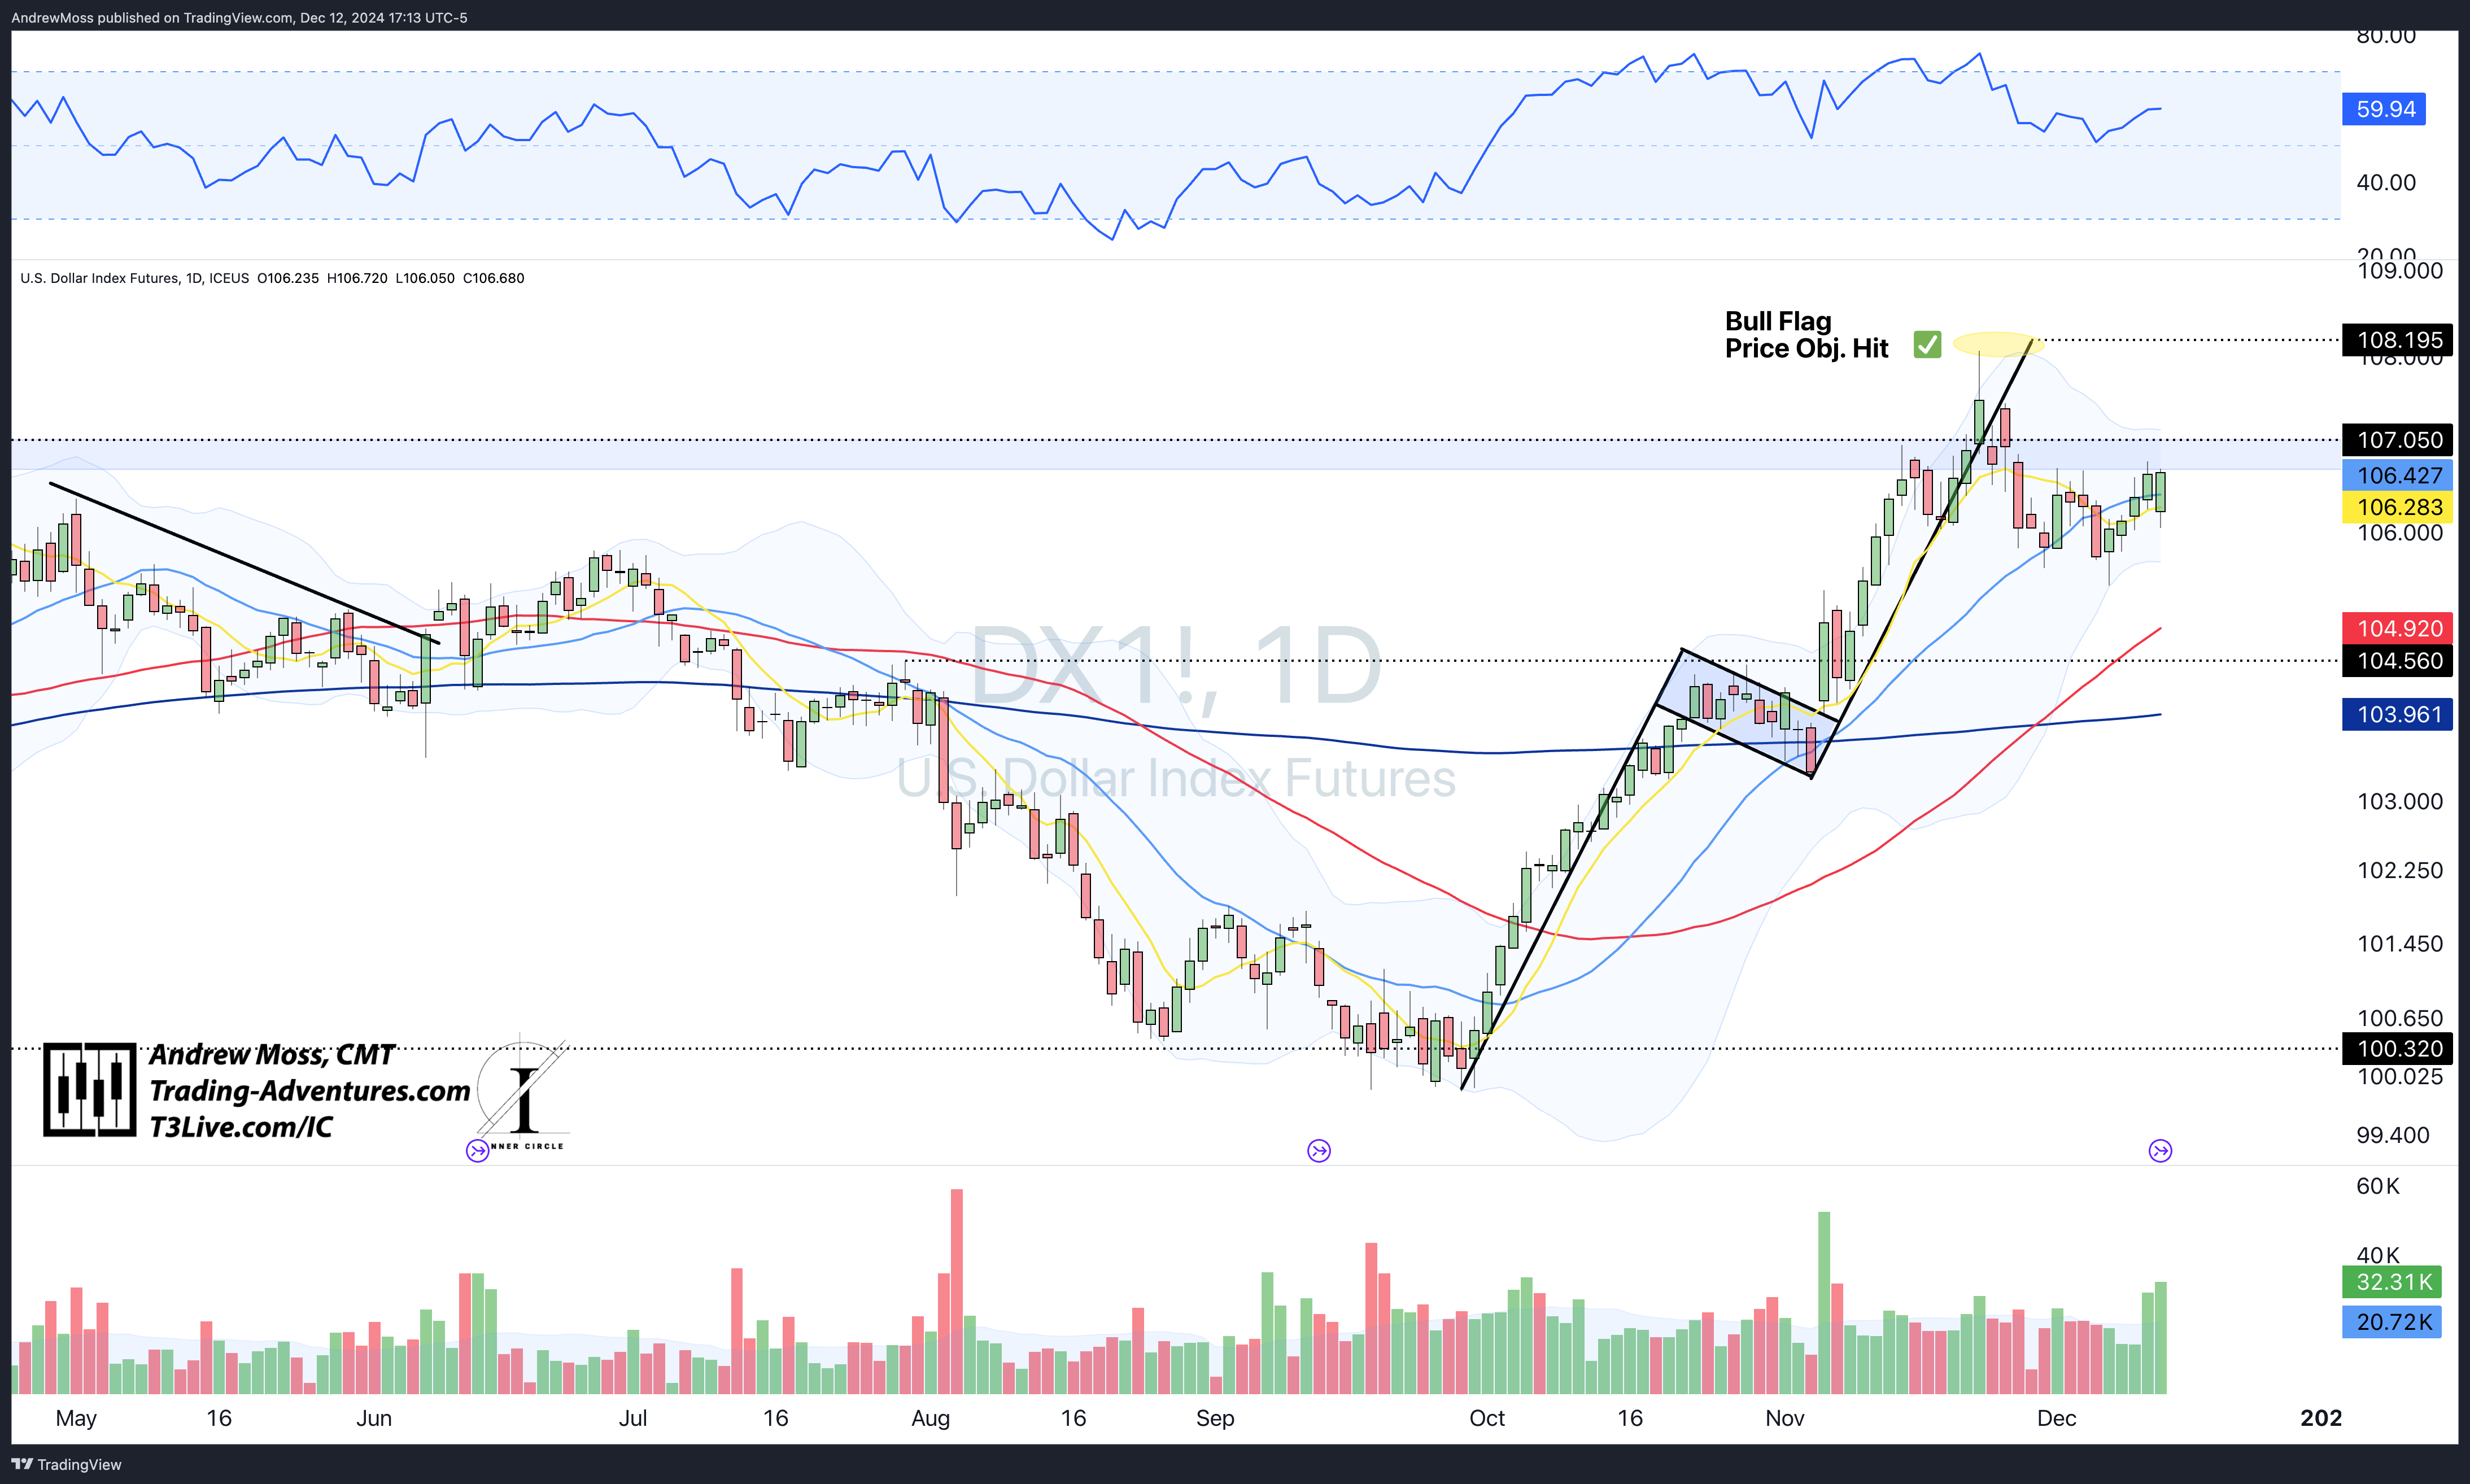
DXY appears to be gathering strength as it bumps against the pivot area on 5 of the last 9 days. The Bollinger Bands are flat and narrow, suggesting more consolidation. When they open wider, we’ll want to pay close attention to which direction they slope.
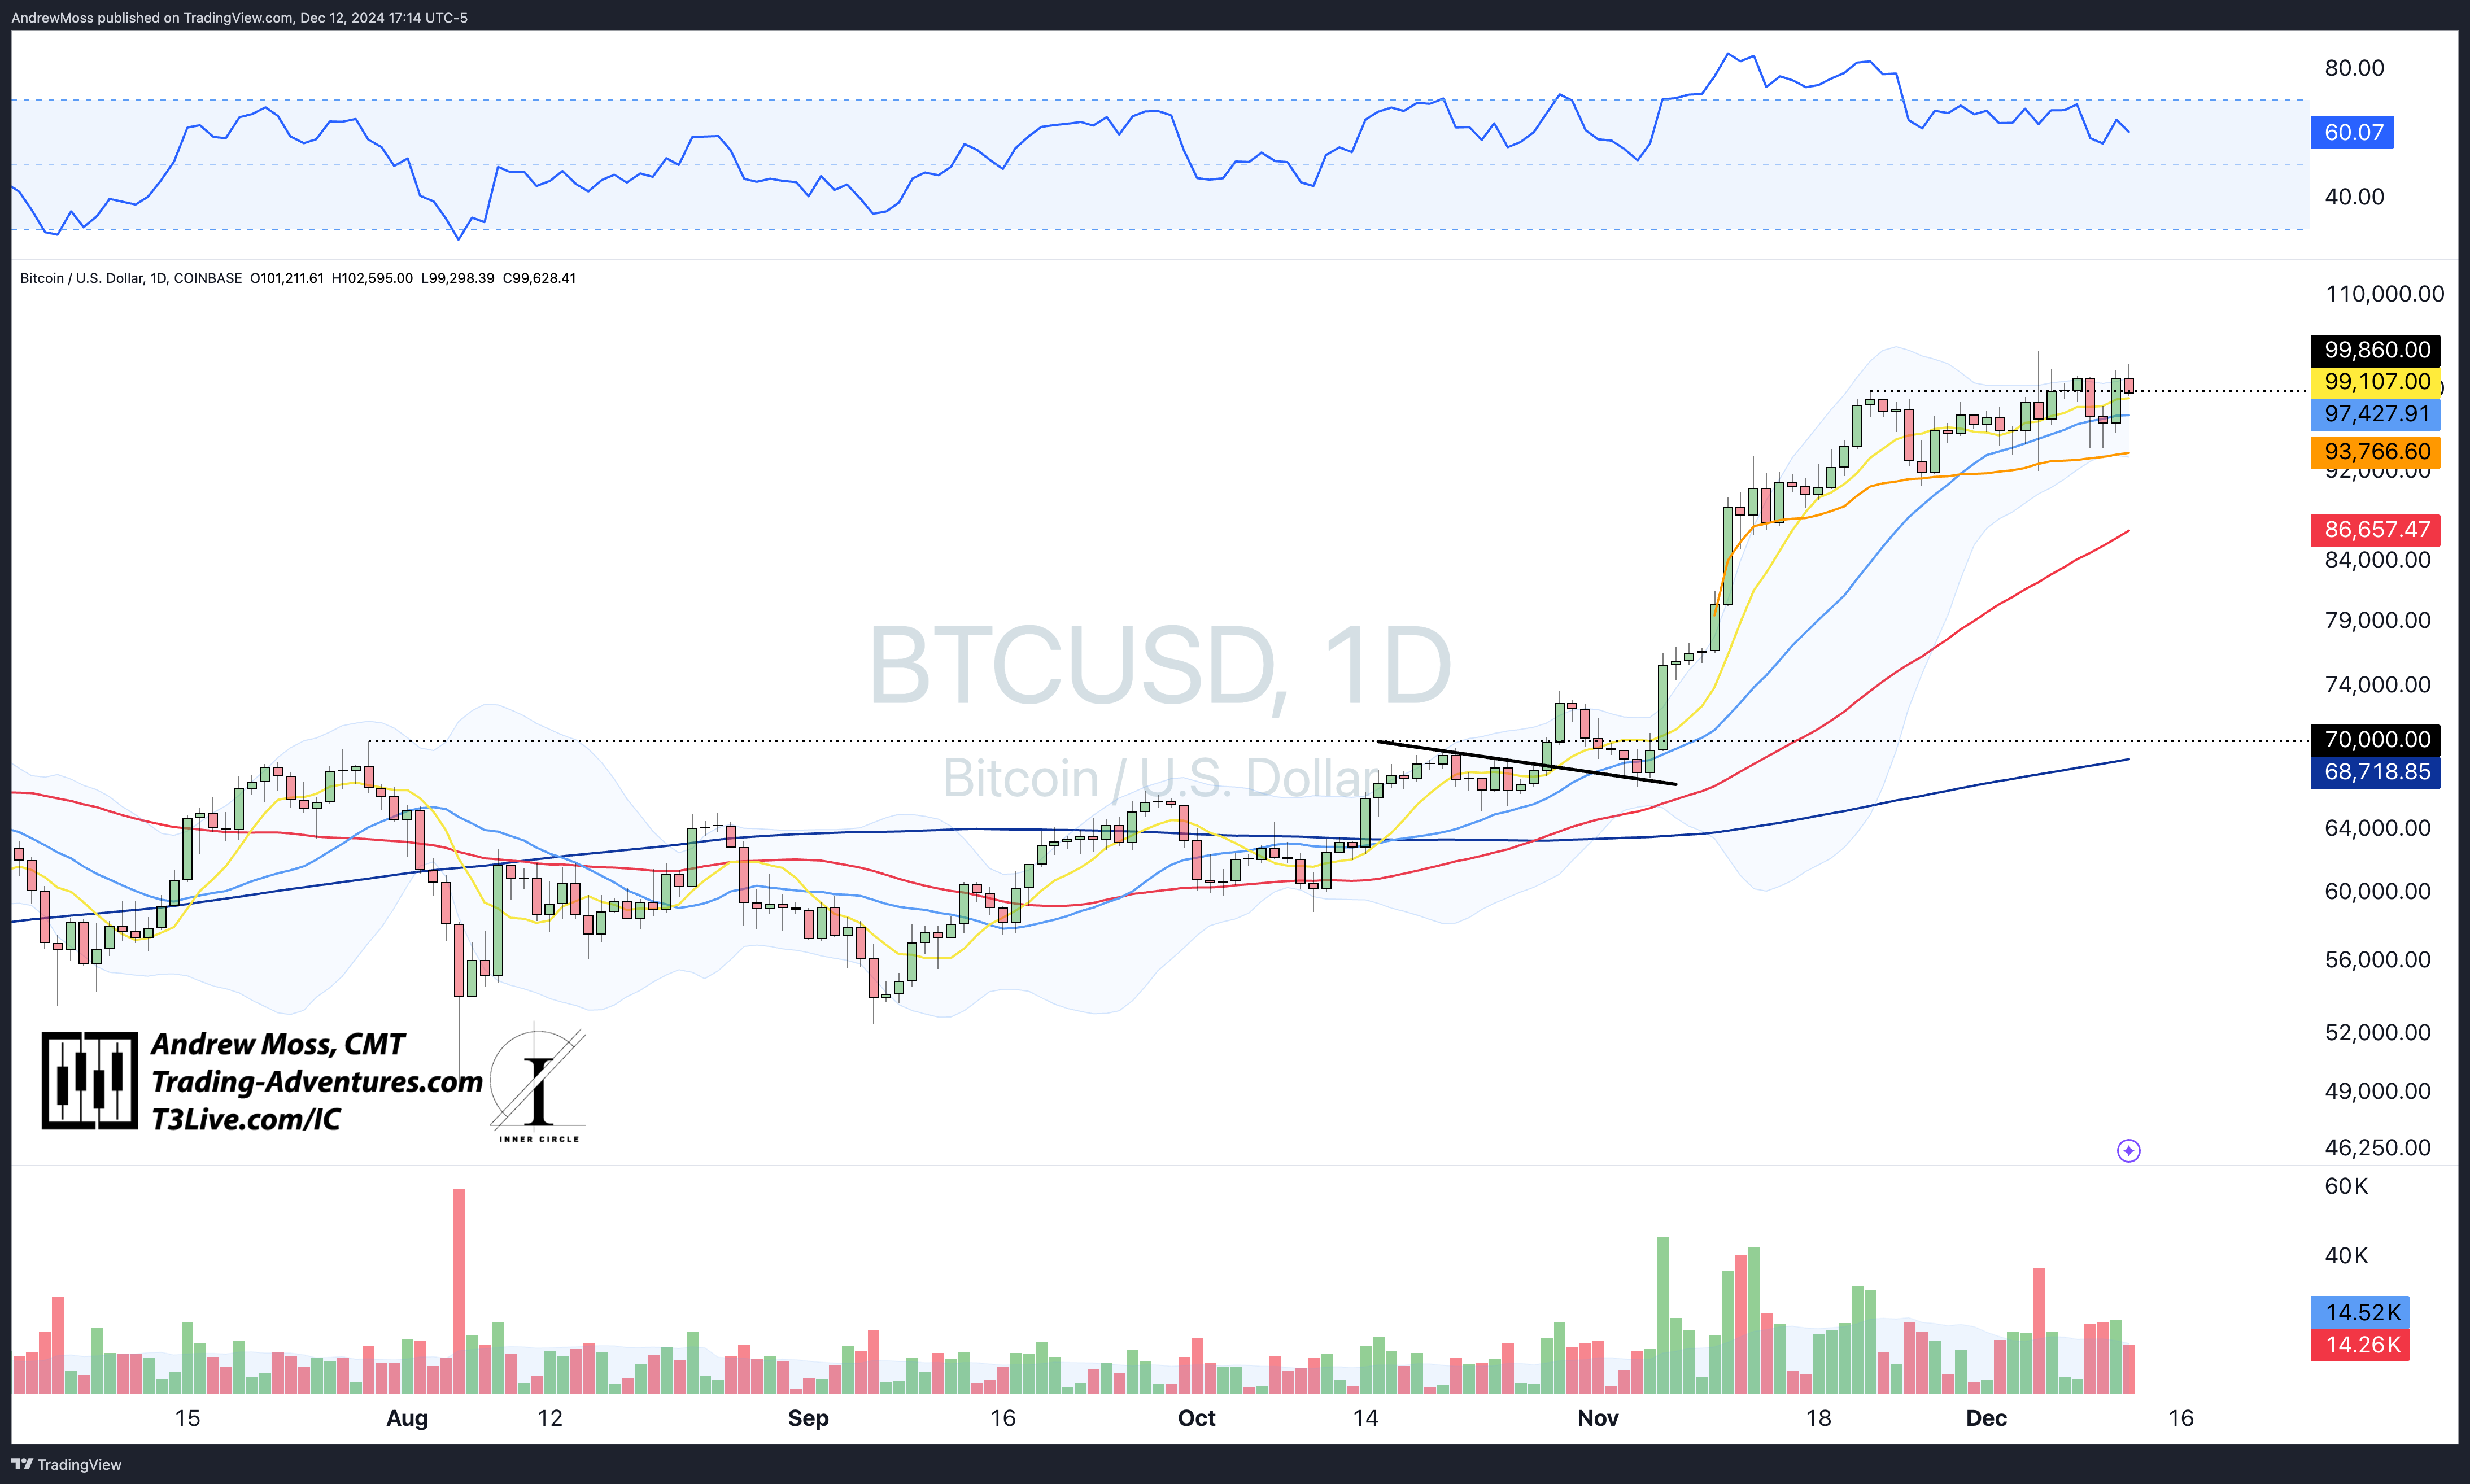
BTCUSD is still attached to the sticky $100k spot. There's not much to do but wait and watch as this one searches for direction. Notably, the AVWAP from the Nov. 10 breakout move has been support several times so far. The bullish case is in place as long as price stays above there.
The Trade
It’s been a relatively quiet week despite getting CPI and PPI data the last two days. The quietness and lack of (buying) action are likely to blame for the drift lower in breadth. As far as sentiment goes, the air of caution persists among active traders.
Regardless, the charts are still bullish, even if some have lost momentum. If seasonality continues to be a worthy guide (see the above chart titled Santa Comes Later In December), we should see more action and upside moves begin to take shape next week.
Be ready.
Note: there will not be charts on X tomorrow or a weekly chart thread this coming Saturday. We have a weekend of travel and birthday celebrations coming, so I will be focusing my time on family. I will try to check in and prepare for the week with a video update on Sunday evening or Monday morning.
Let me know if there’s anything specific you’d like to look at.
The Disclosures
***This is NOT financial advice. This is NOT a recommendation to buy, sell, or trade any security. The content presented here is intended for educational purposes only.
Looking For More?
Elevate Your Trading Adventure Even Further With These Offerings.

EpicTrades Options Newsletter
Real-time trade ideas and insights, providing actionable trading insights focusing on options trades with short-term horizons, aiming to capitalize on weekly market movements.
The approach includes detailed reasoning for trades, specific options, and profit targets. It focuses on quick gains with a minimal time commitment from subscribers.

The Inner Circle
The Inner Circle is a Virtual Trading Floor (VTF) at T3 Live. It’s the group I’ve been working and trading with since 2022. You may have noticed the logo in the watermarks on my charts.
Founded by David Prince and led by him, Rick March, and Kira Turner, the Inner Circle is a community of elite traders, including hedge fund managers, family office heads, corporate executives, financial advisors, and even professional poker players.
Fundamental, Macro, and Technical Analysis all combine to find and discuss the best opportunities in current markets.
