

Monday Market Update
Stock Indexes Find Resistance While NVDA Logs A New All-Time High


The Markets
On Thursday of last week, as SPY traded lower for a fourth consecutive day, neared its 100-day MA, and put in a new ‘lower low,’ the selling was beginning to look a little overdone in the short term.
Today, we see 21-day MAs hit on SPY and QQQ before moving lower to create a potential reversal candle on the daily charts.
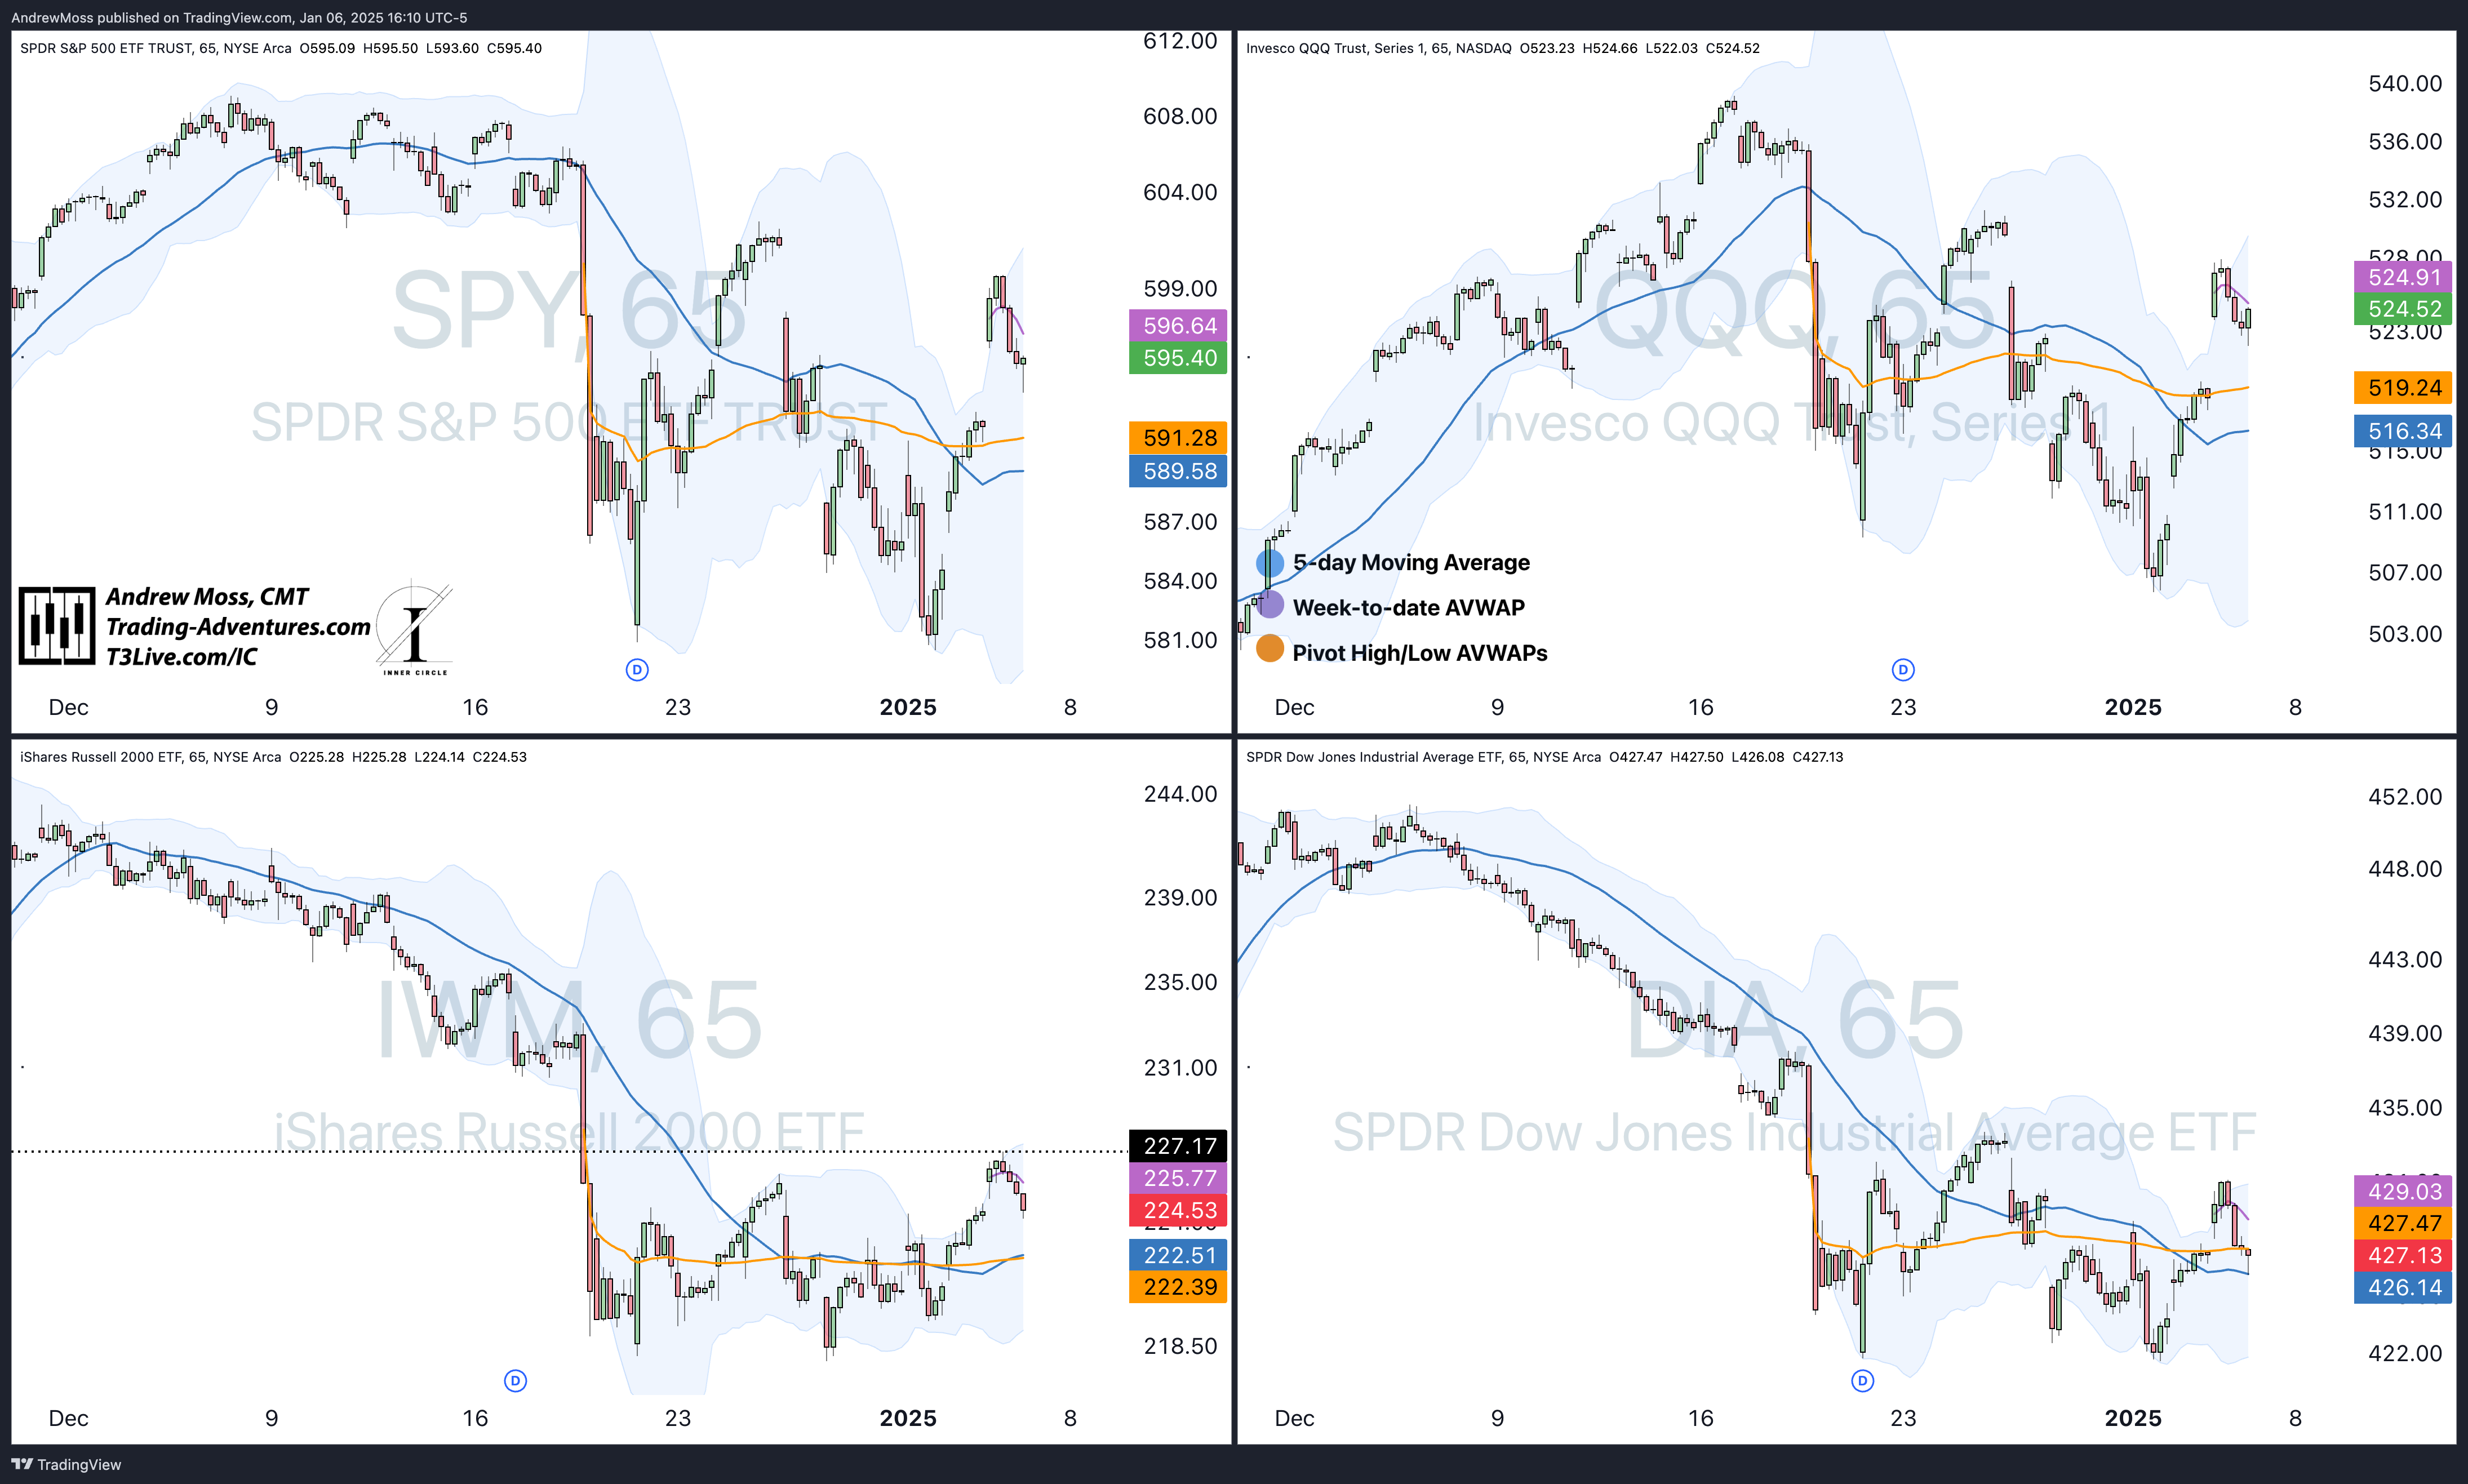
Before we look at that, here’s a check of the roadmap via the 65-minute charts. This morning, prices gapped higher, moving further above the VWAP anchored to the Dec. 18th Fed announcement and the flat to falling 5-day MAs.
As they pull back, these levels could be our first clue as to whether or not this bounce can hold up. Watch the orange and blue lines and the gap-fill areas (DIA is already there) for the first signs of support.
Now, on to the daily charts.
The Charts
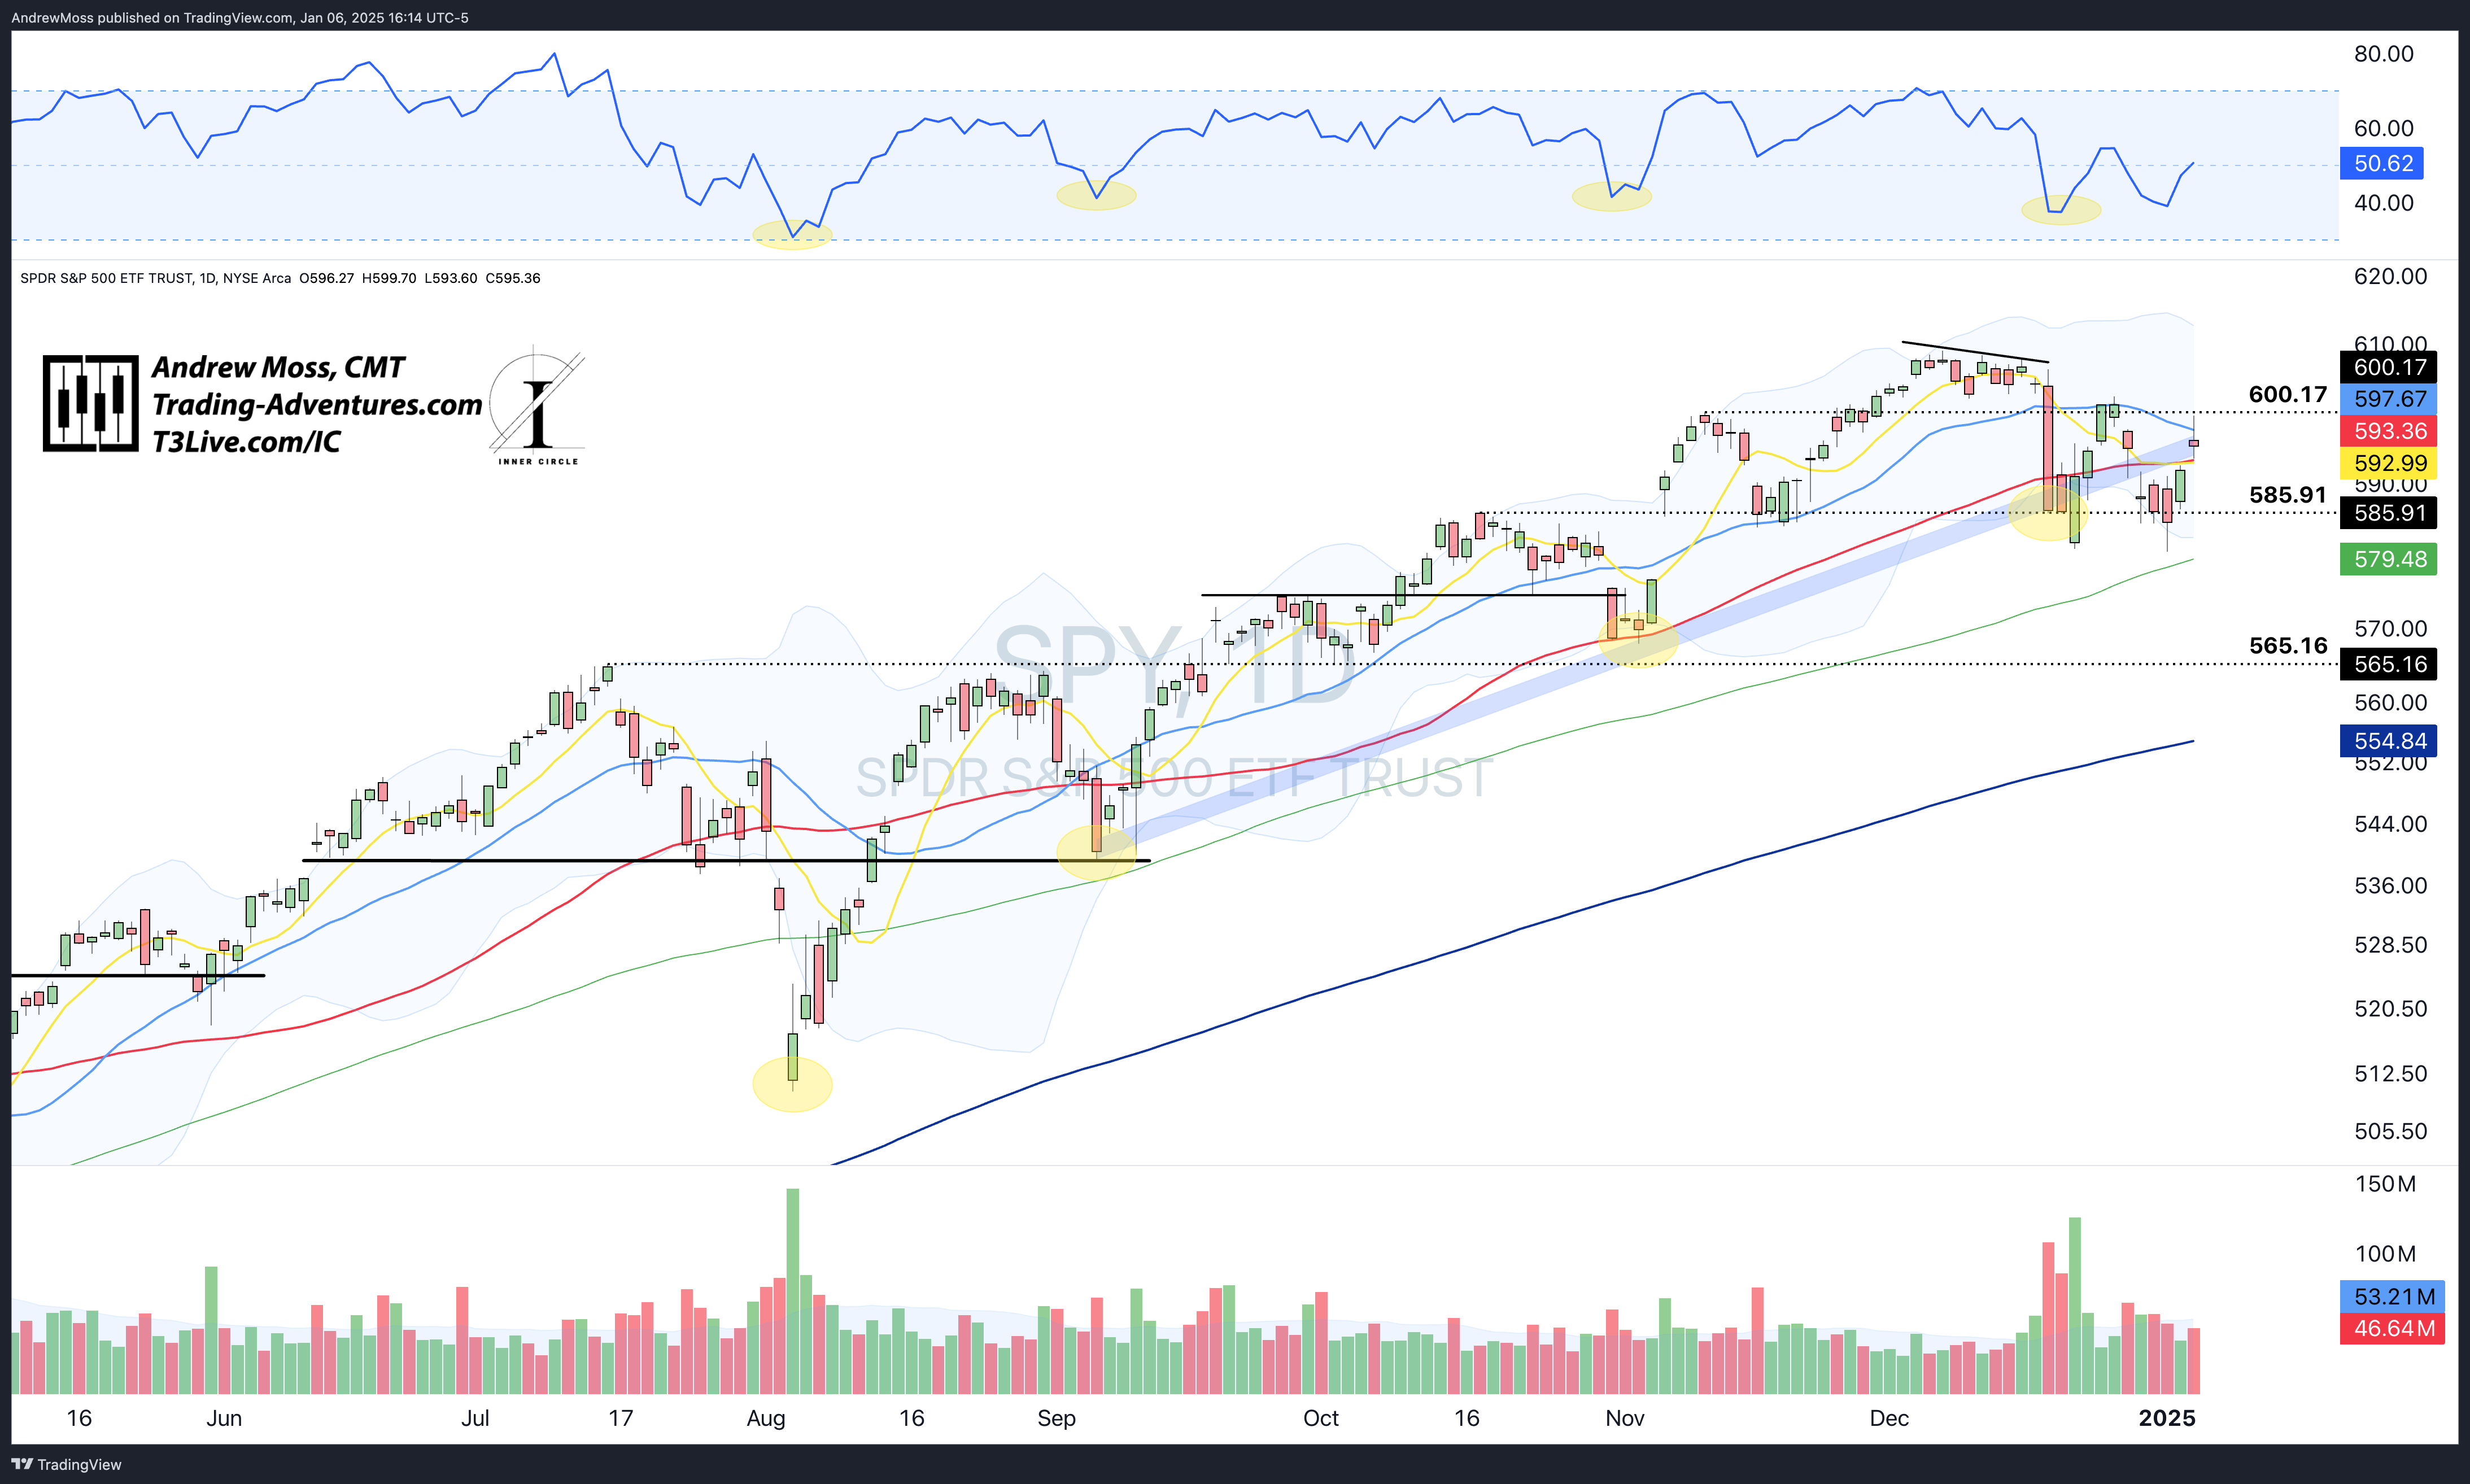
SPY moved beyond the 21-day MA, nearly reaching the $600.17 pivot level before selling took over. This resulted in a potential reversal candle between some key moving averages — the 21-day MA above near $597 and the 8 and 50-day MA below near $593. An open tomorrow morning below $593 would confirm the reversal pattern and put us on alert for more downside.
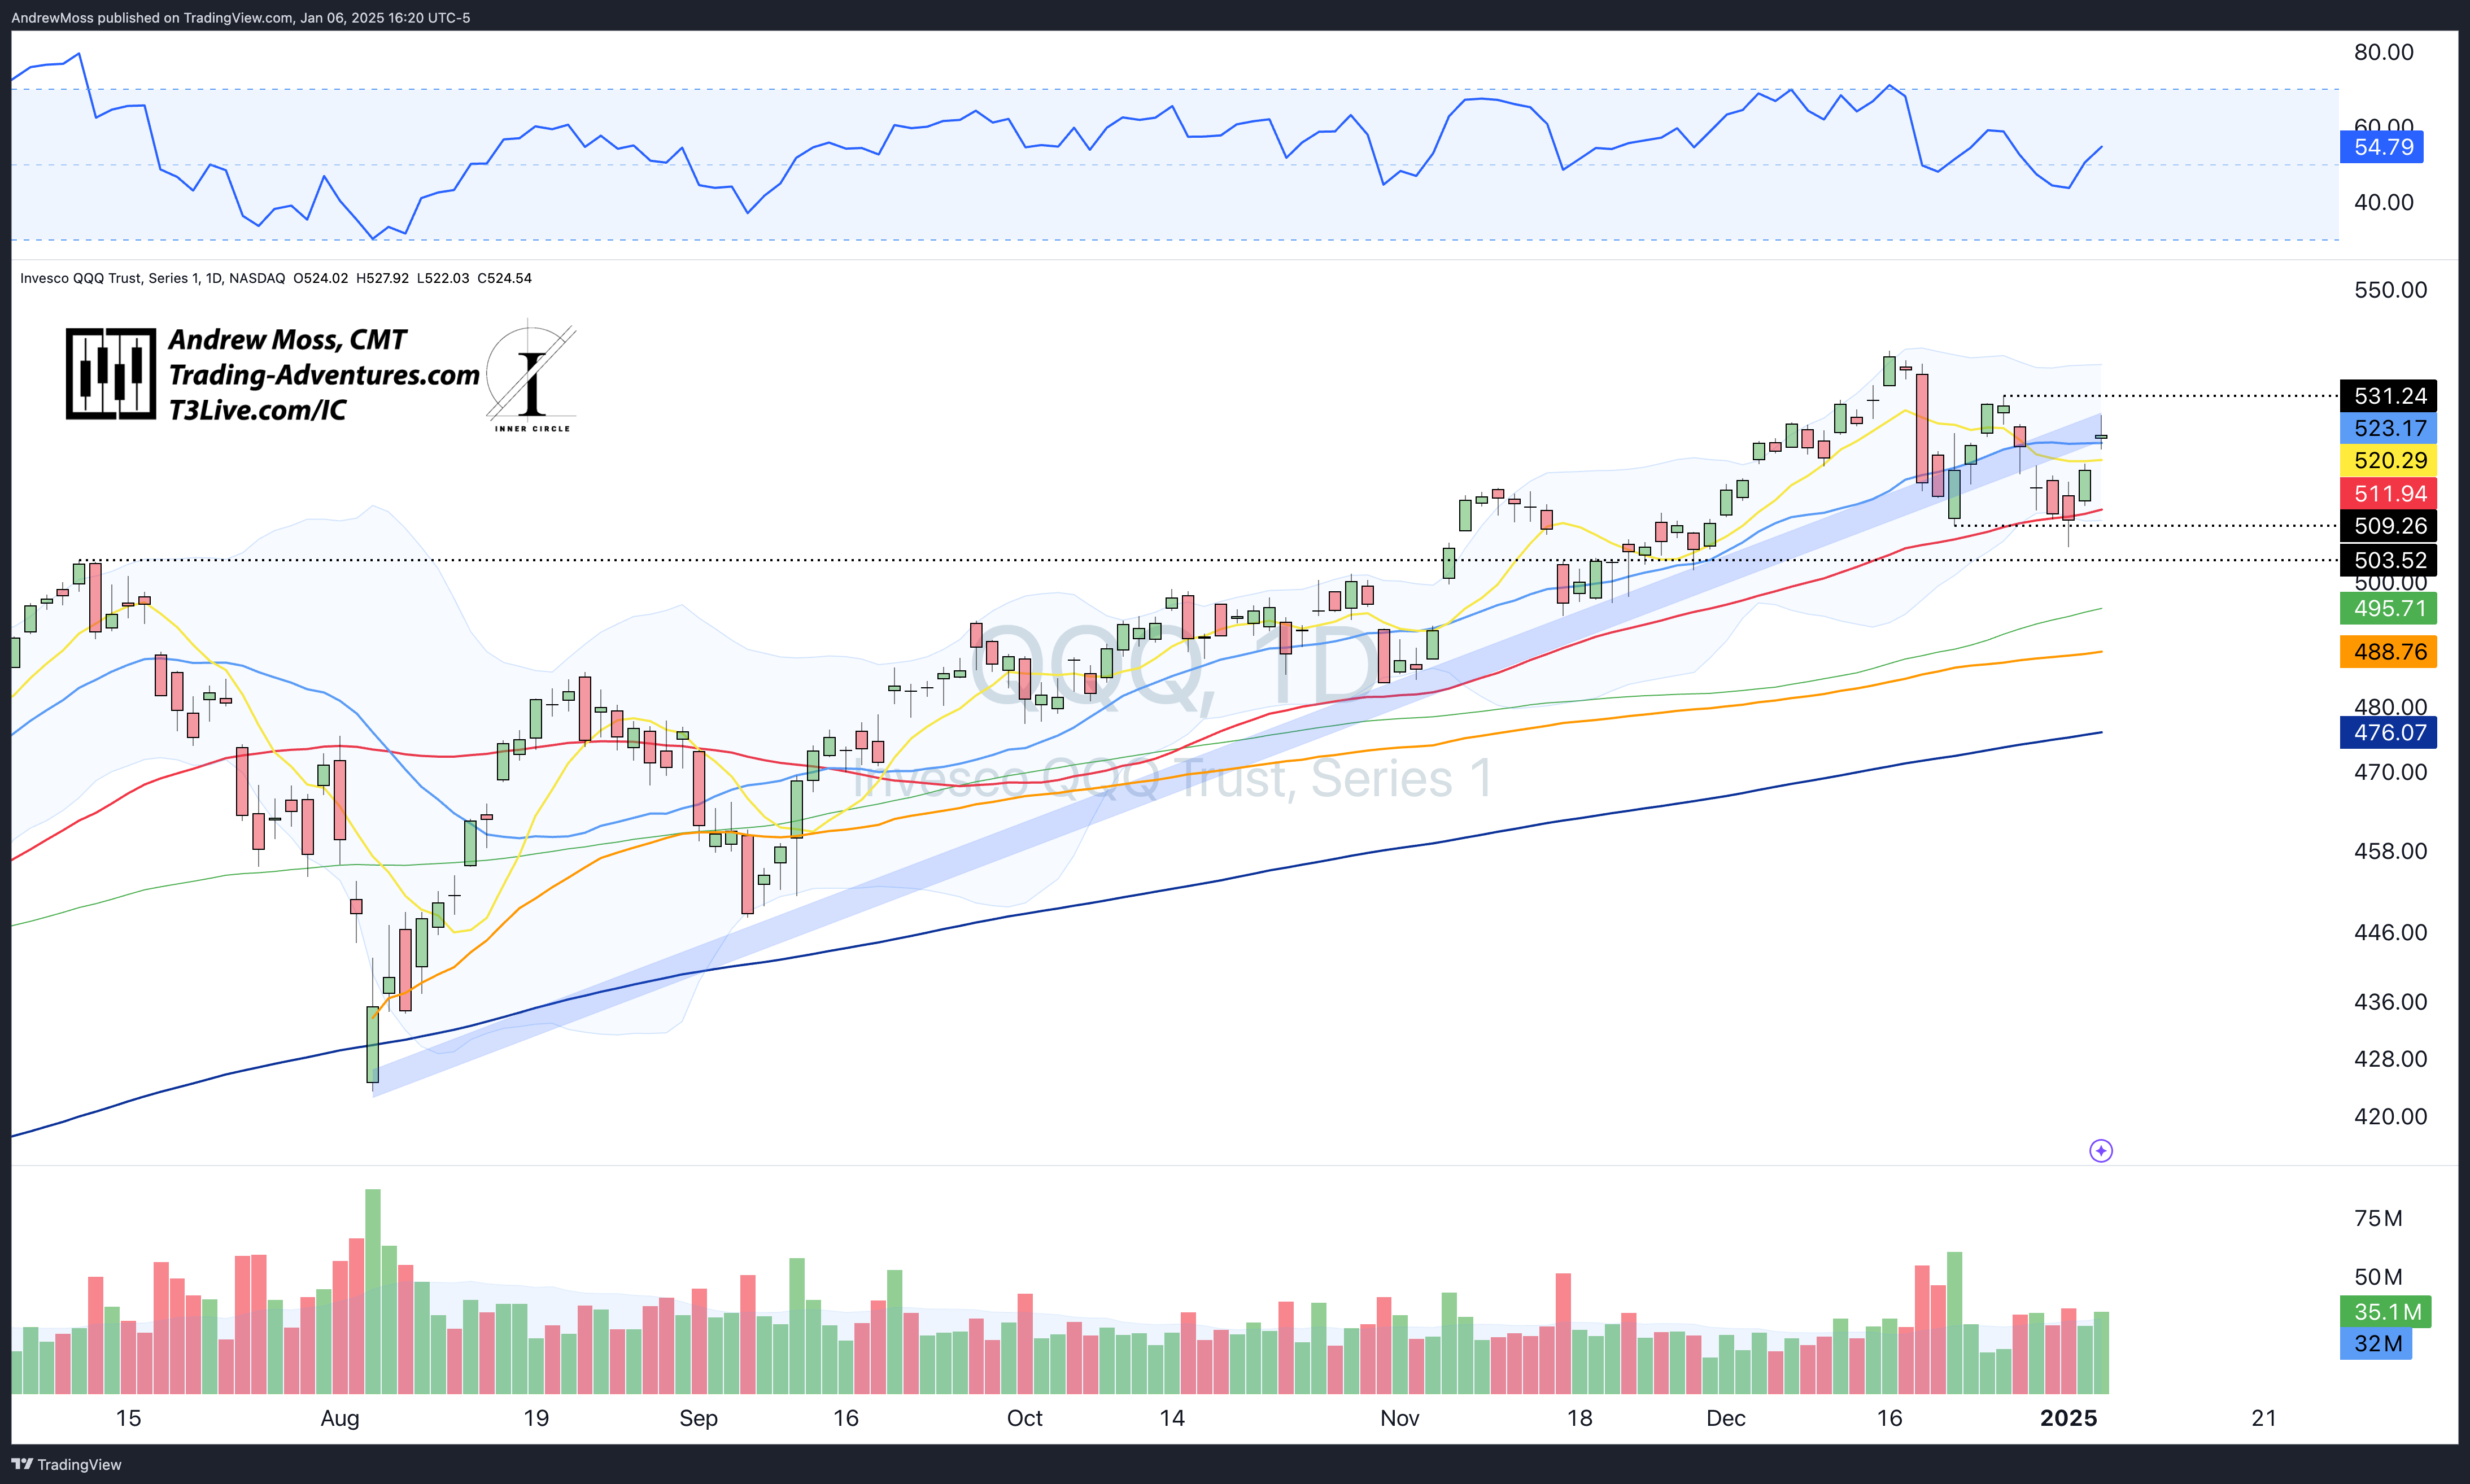
QQQ has similar potential for reversal, though it did close above its 21-day MA and with the trendline zone. It was resistance for a day. Does it develop into resistance for several days? Watch for price action below $523 and then $520 tomorrow to signal more downside or a move above the $531.24 pivot to signal the potential for a continued move higher.
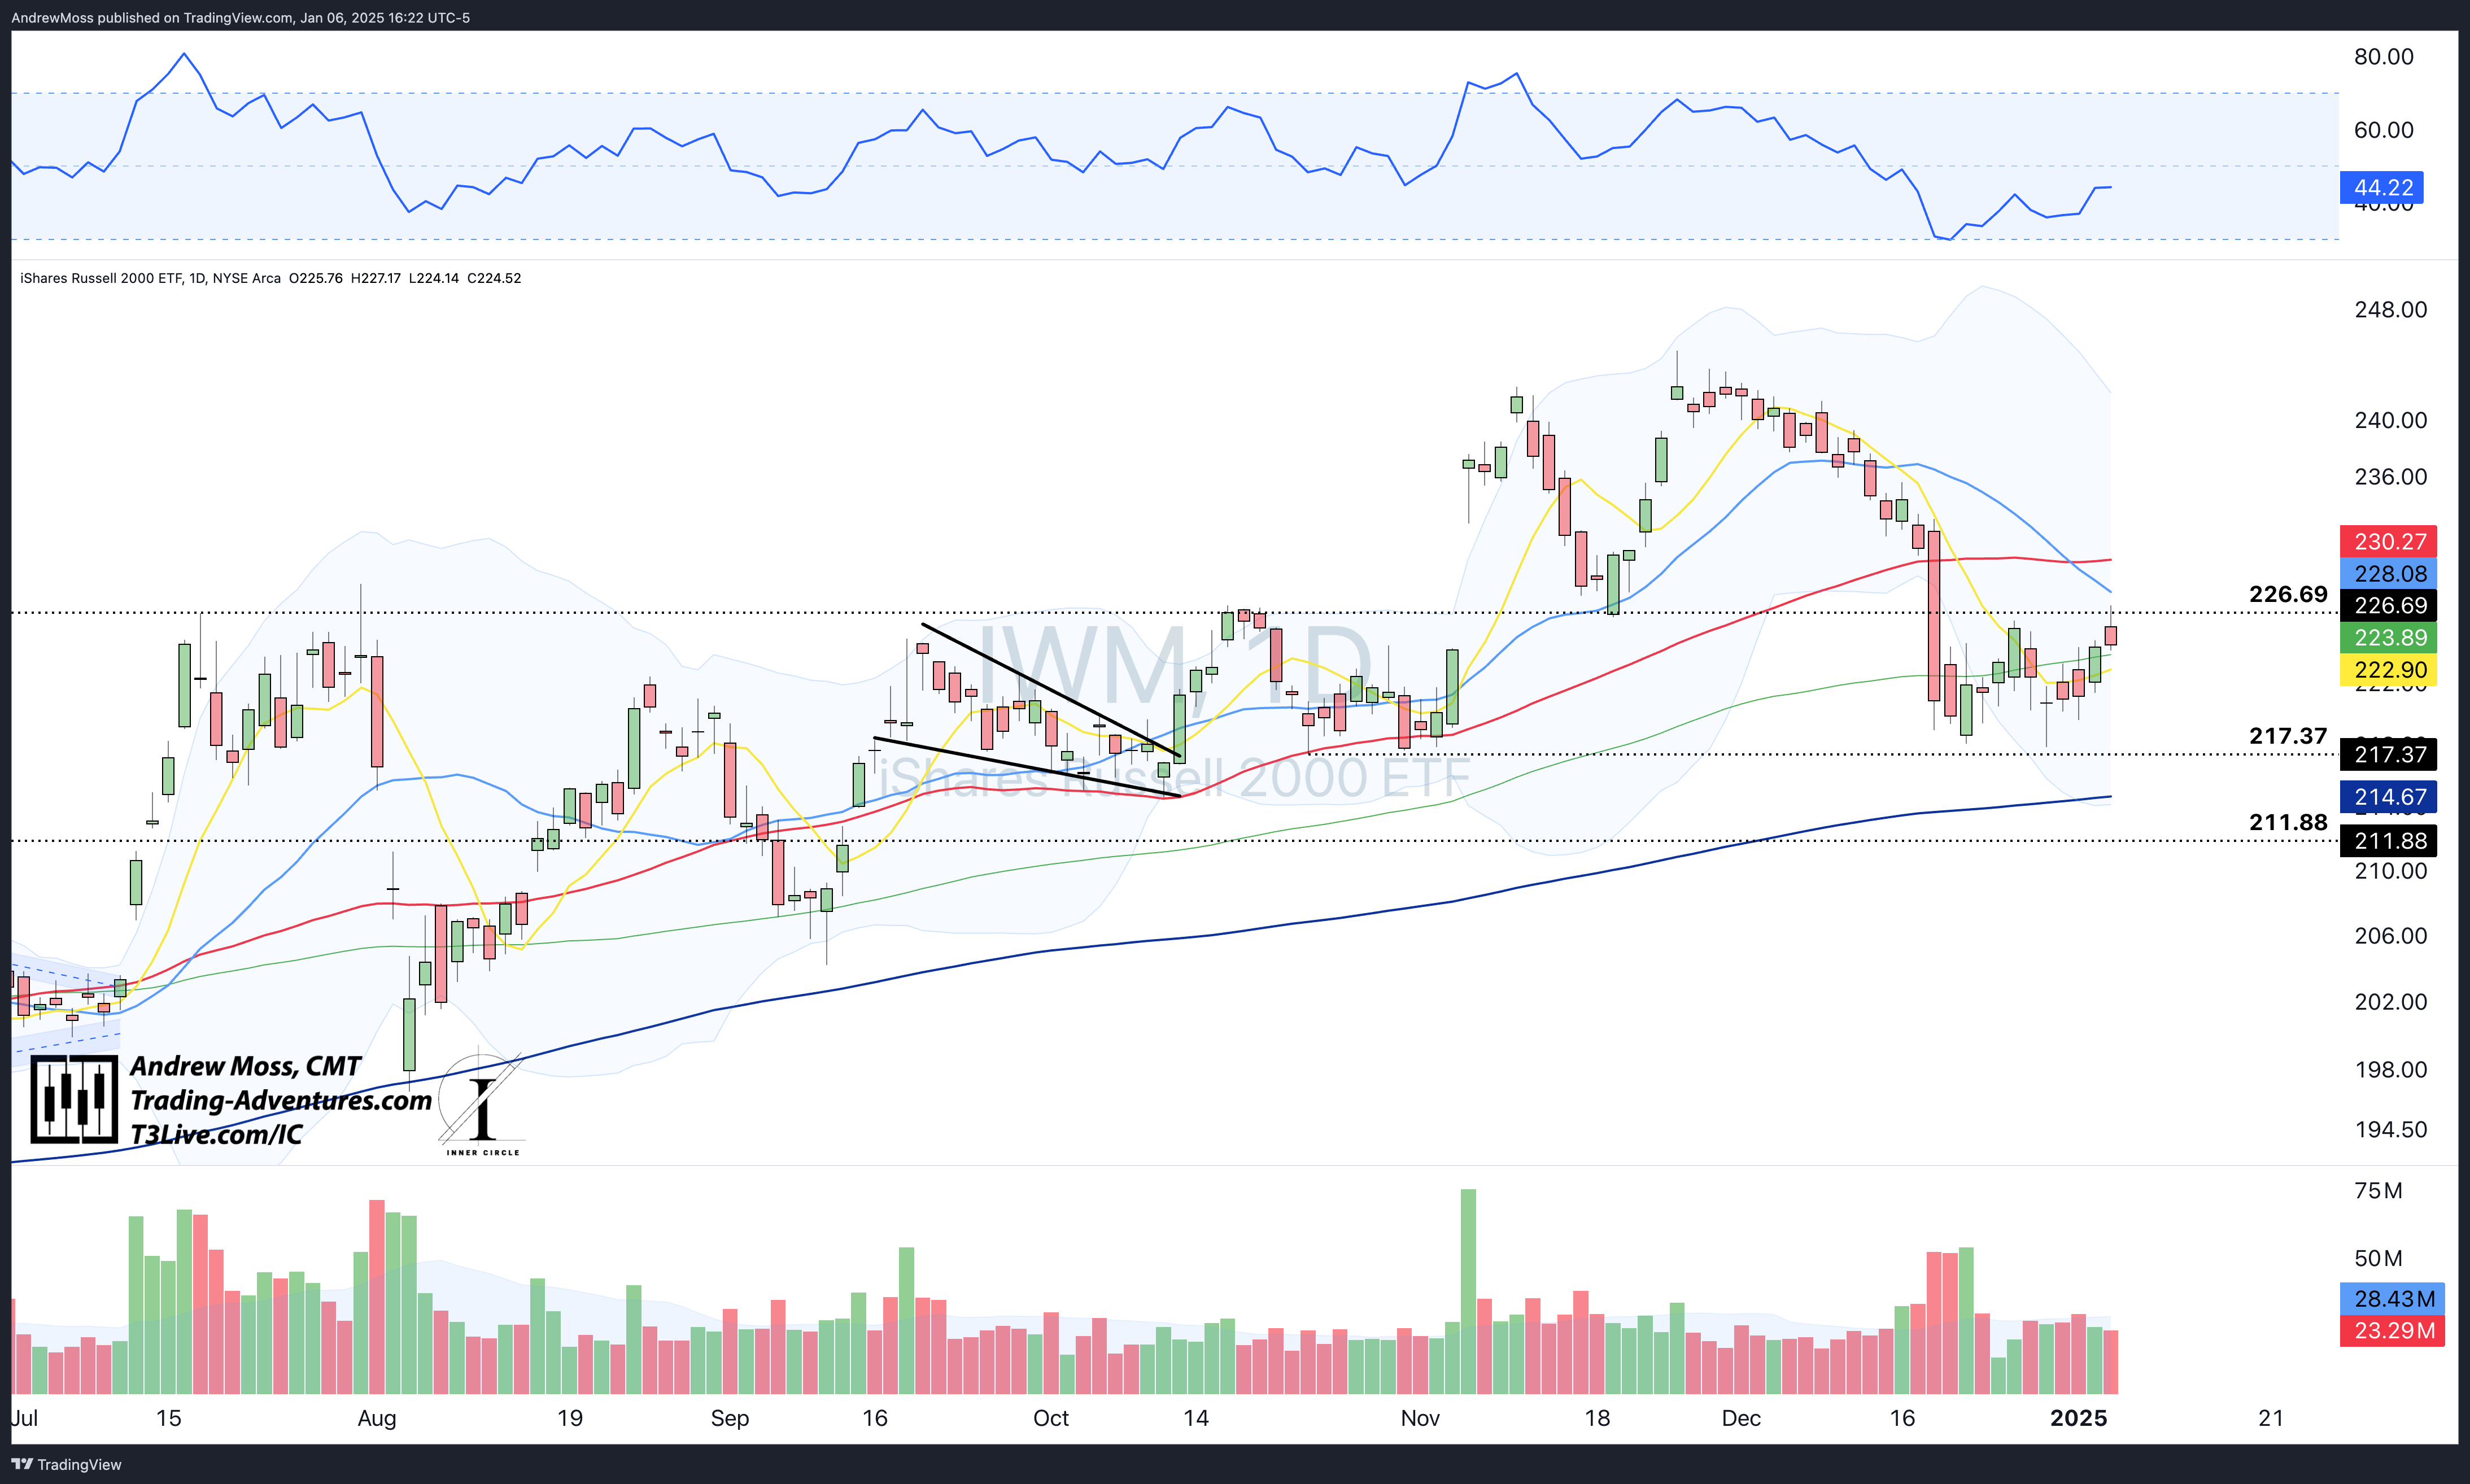
IWM stalled for the day at nearly $227-$228 as the 21-day MA came down to meet a pivot level in that area. This price point has been resistance for the index many times in recent months and support only once. So, as long as it’s trading beneath, the wind is in its face.
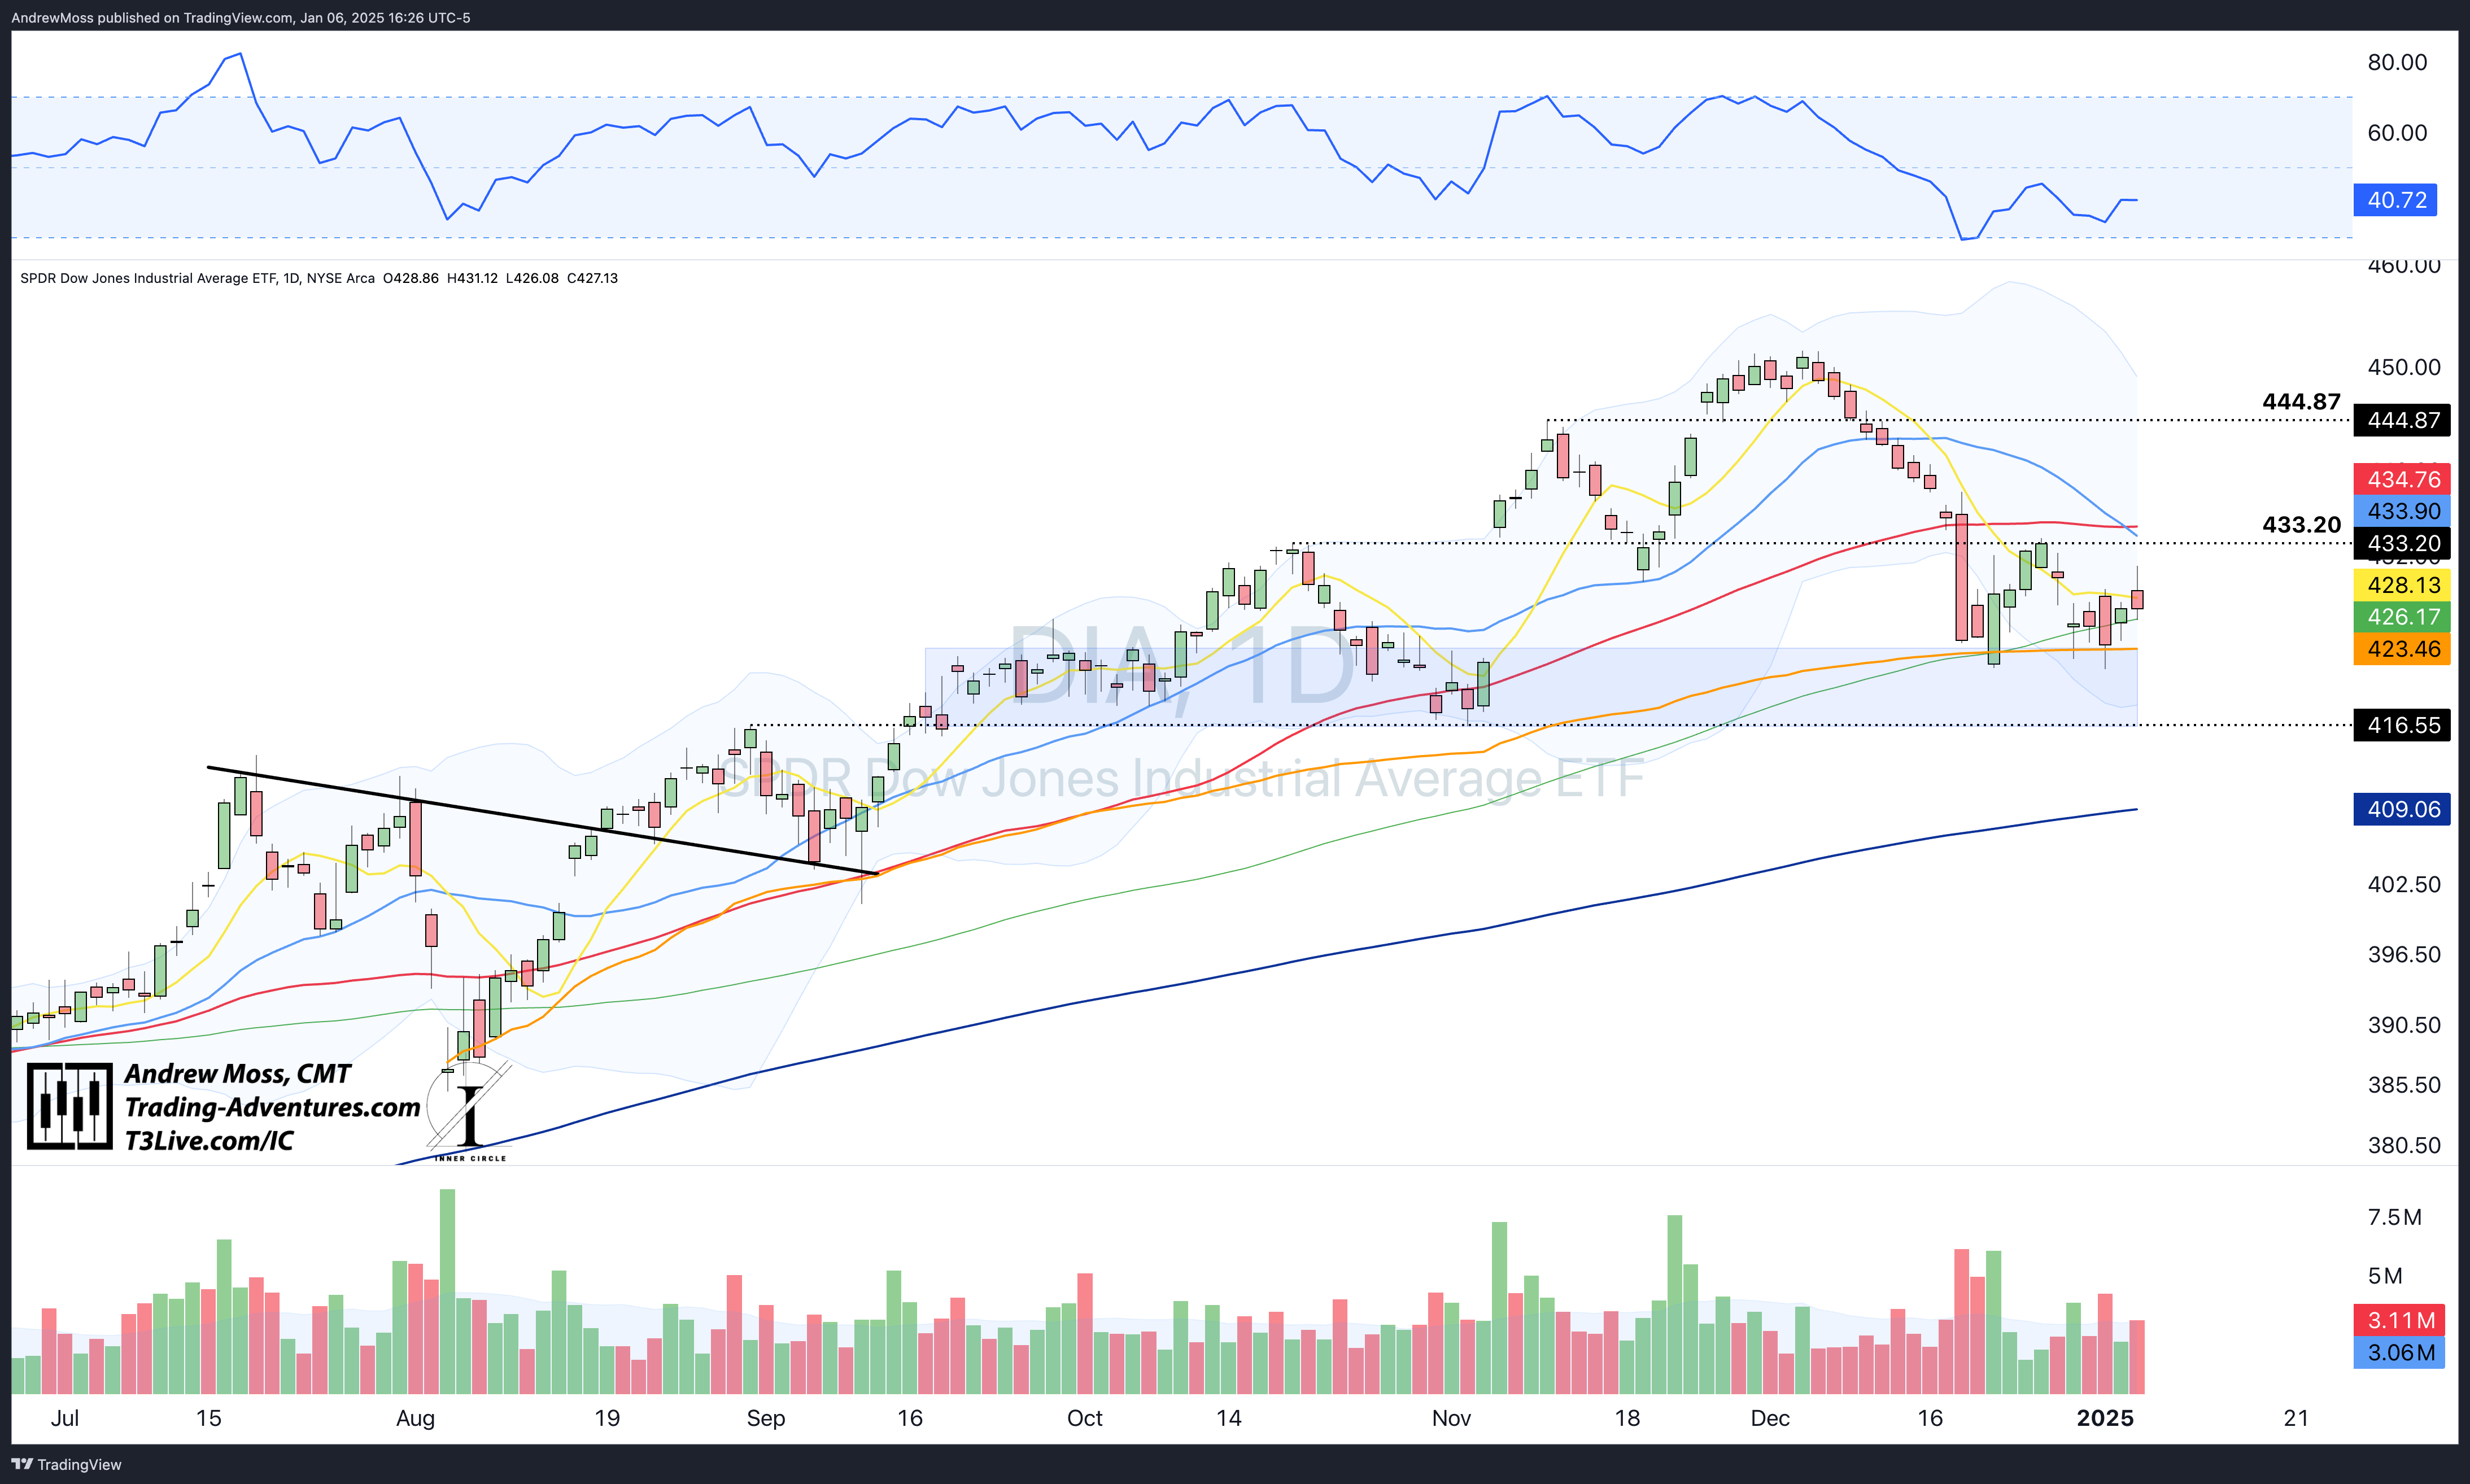
DIA is still in the choppy range between $423 and $433.
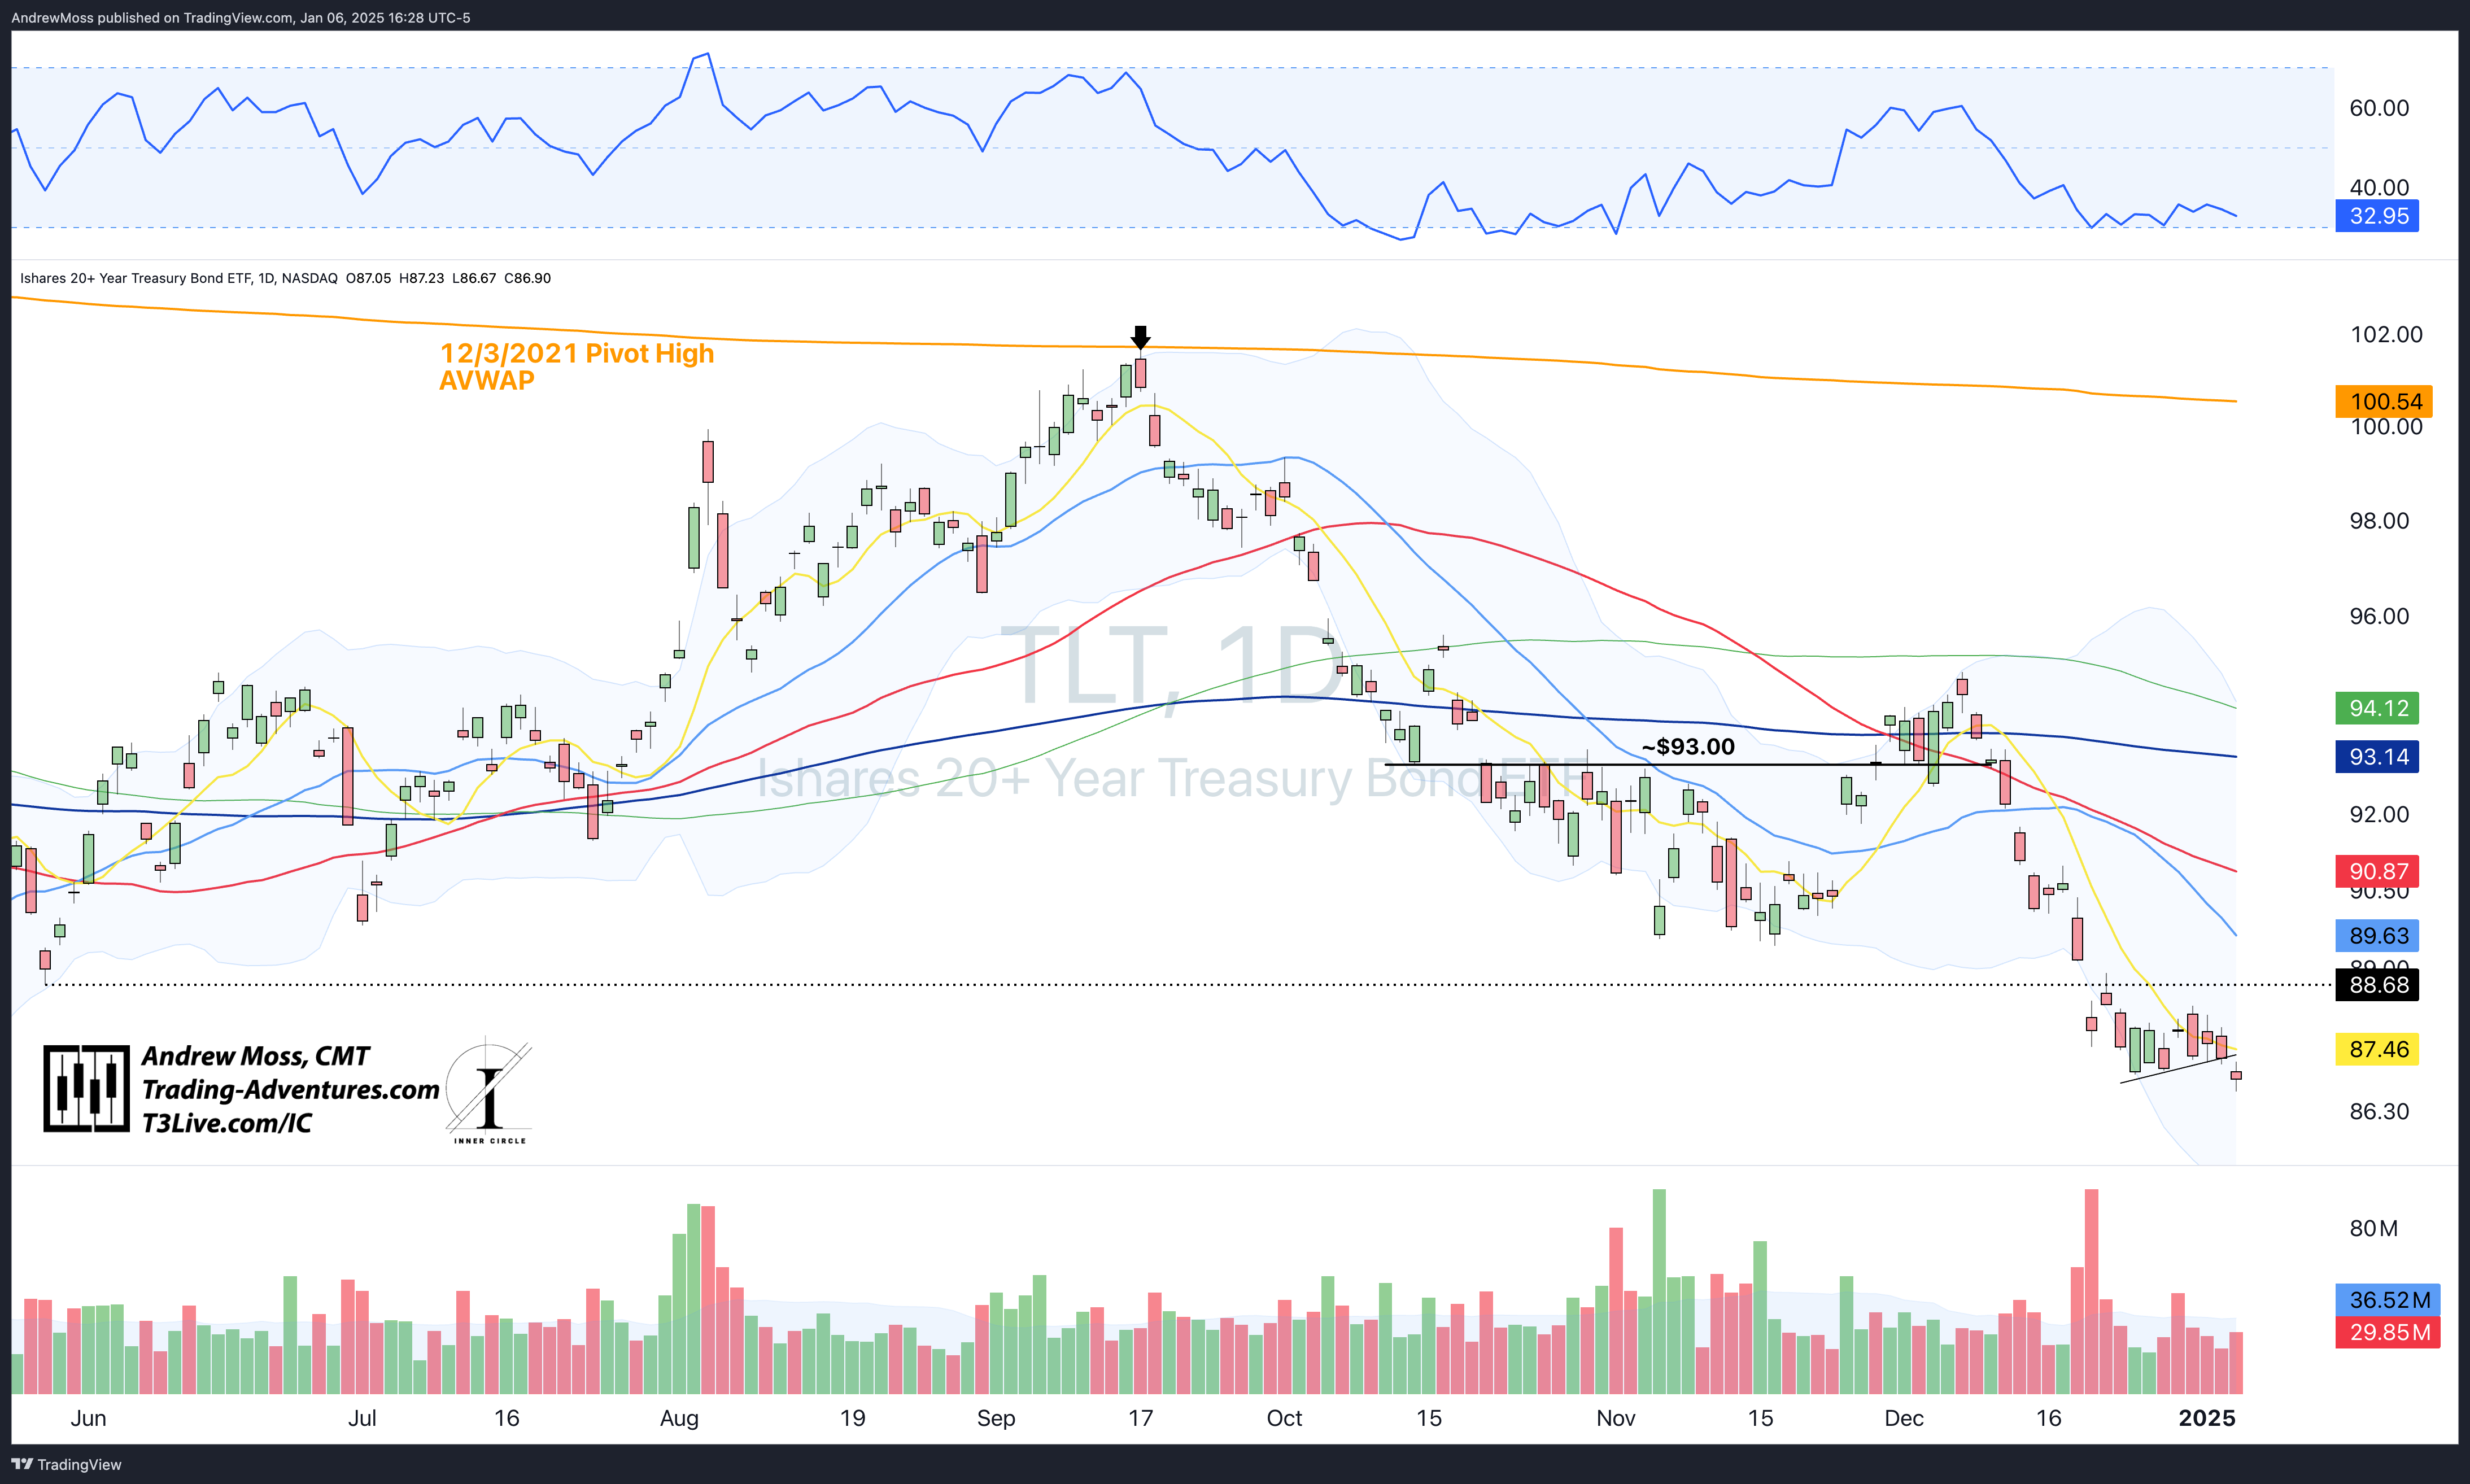
TLT continues to look worse and worse as prices fall and potential support levels prove ineffective and unhelpful. RSI seems comfortable in the very low 30s as the wide Bollinger Bands signal the downtrend in place.
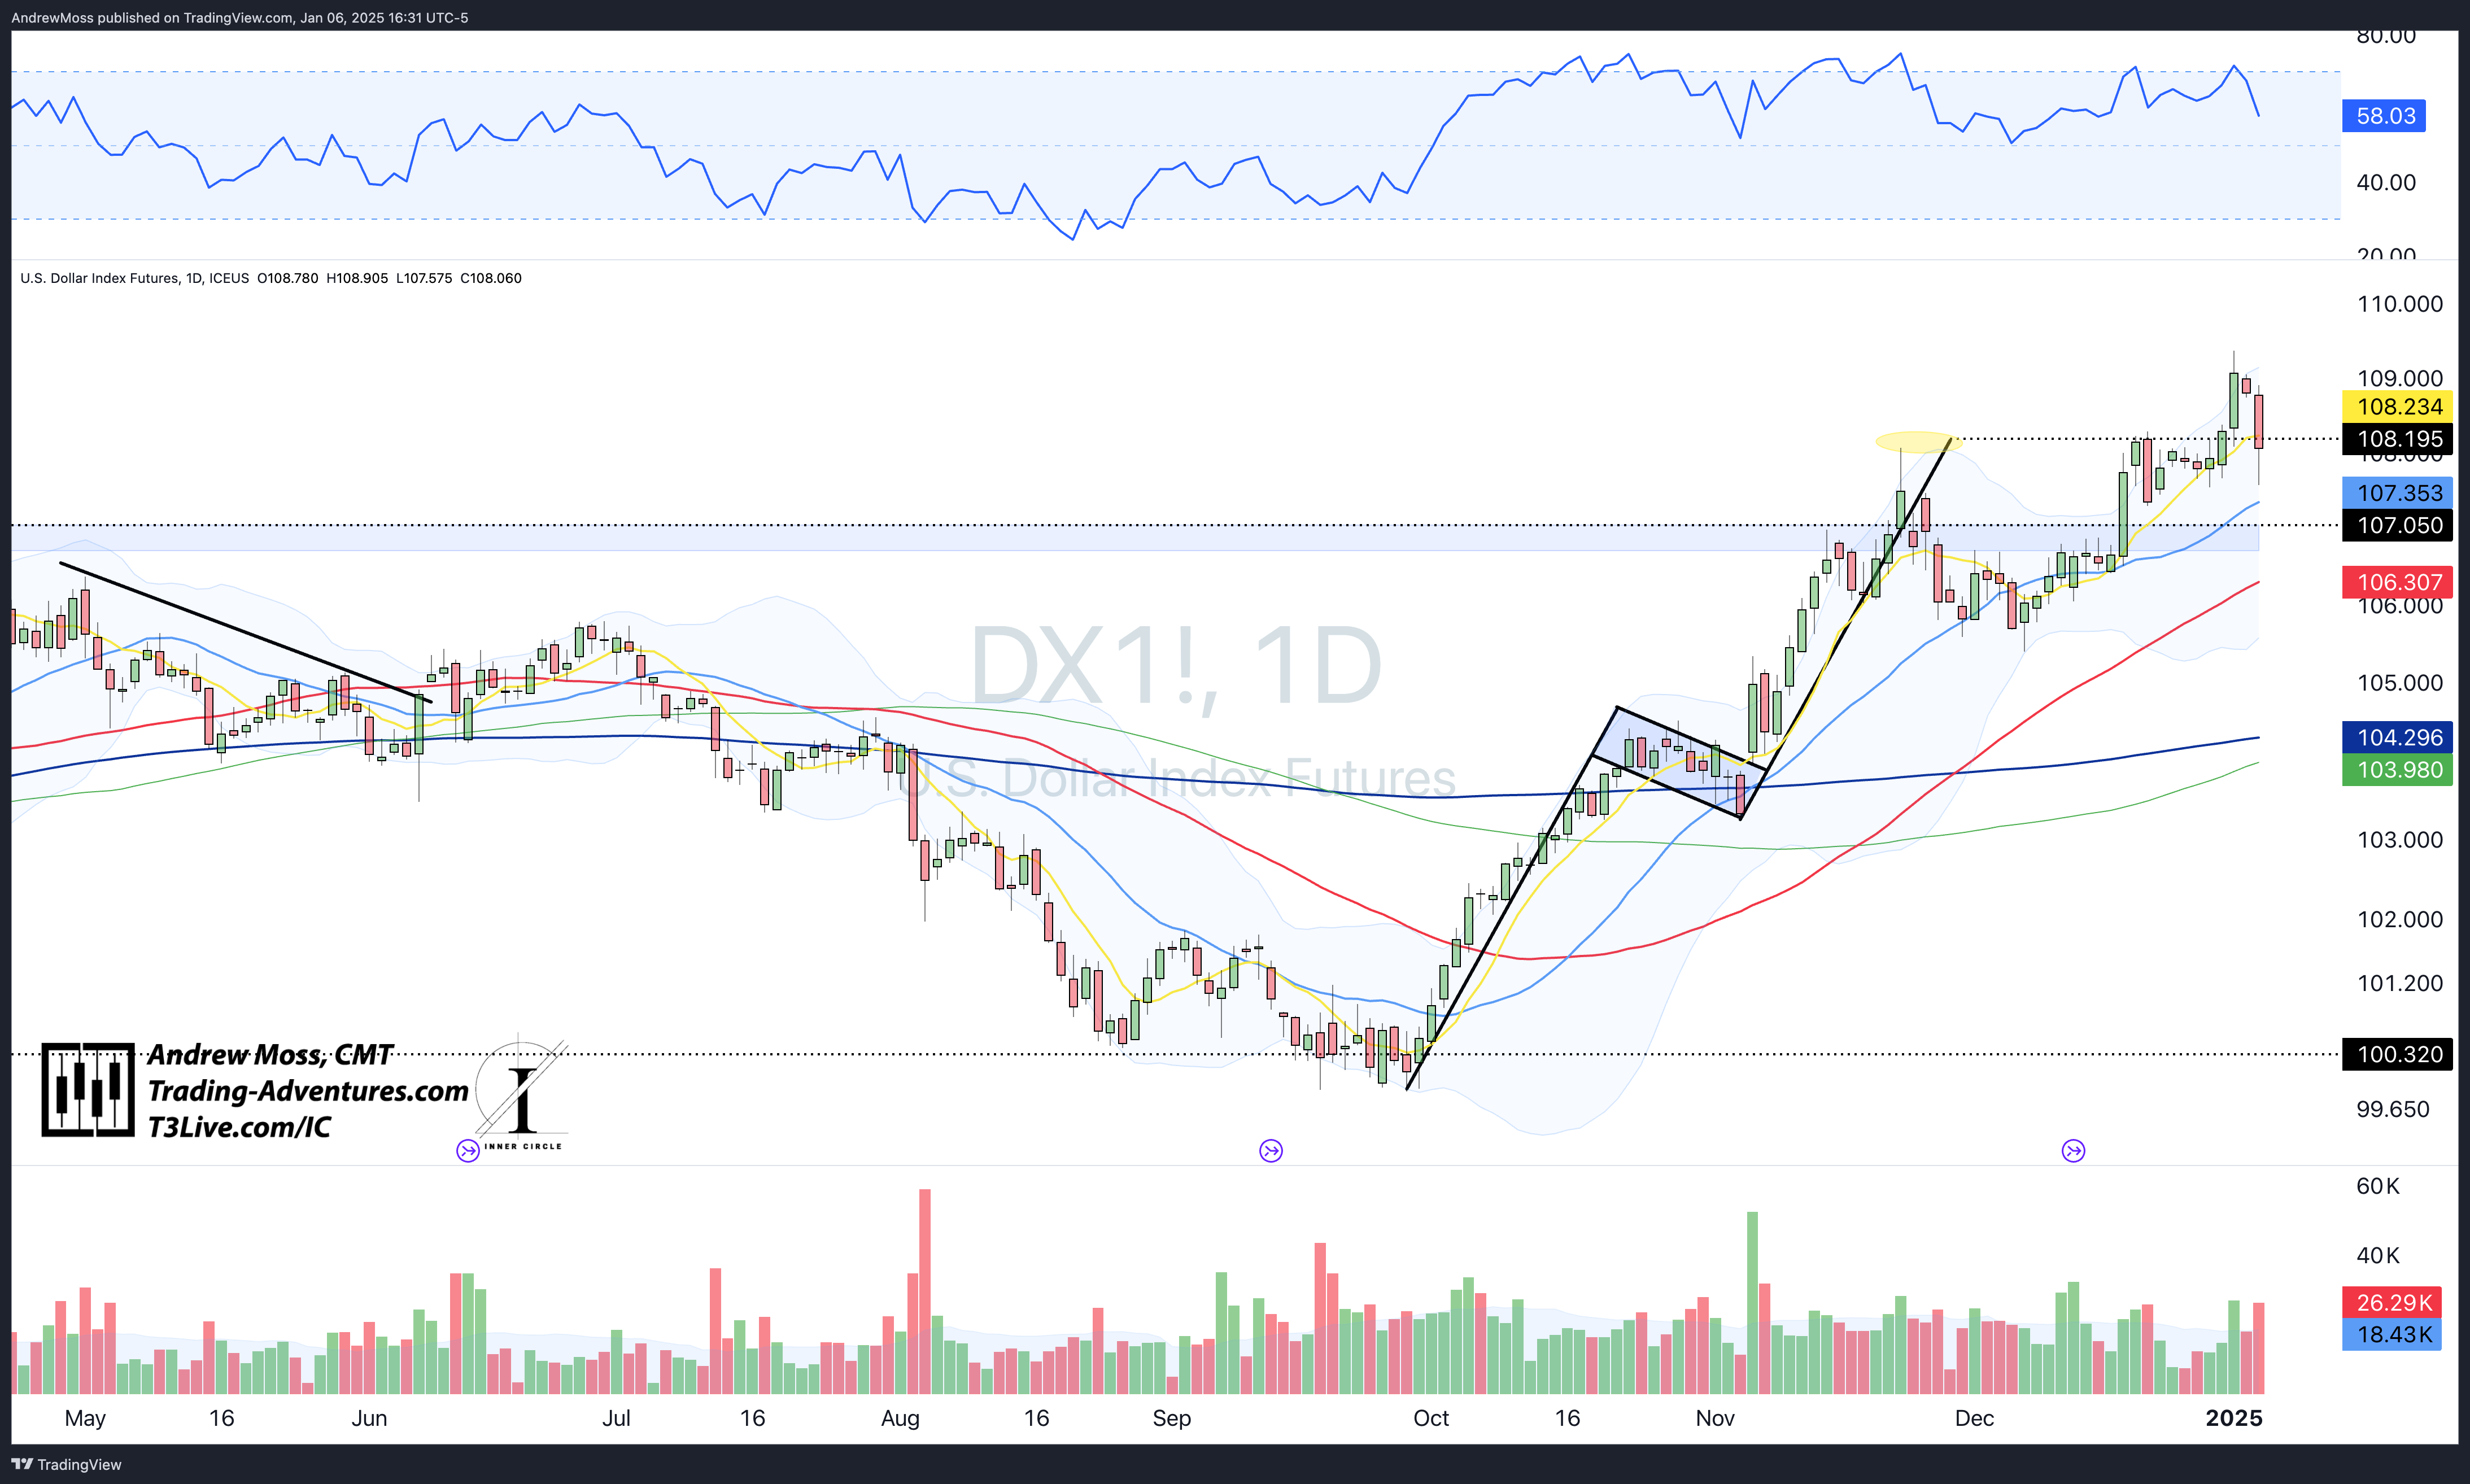
DXY Dollar futures show potential for a failed breakout pattern, an outcome that stocks would welcome. They will likely need to trade below the ~$107 pivot and 21-day MA for that to hold true.
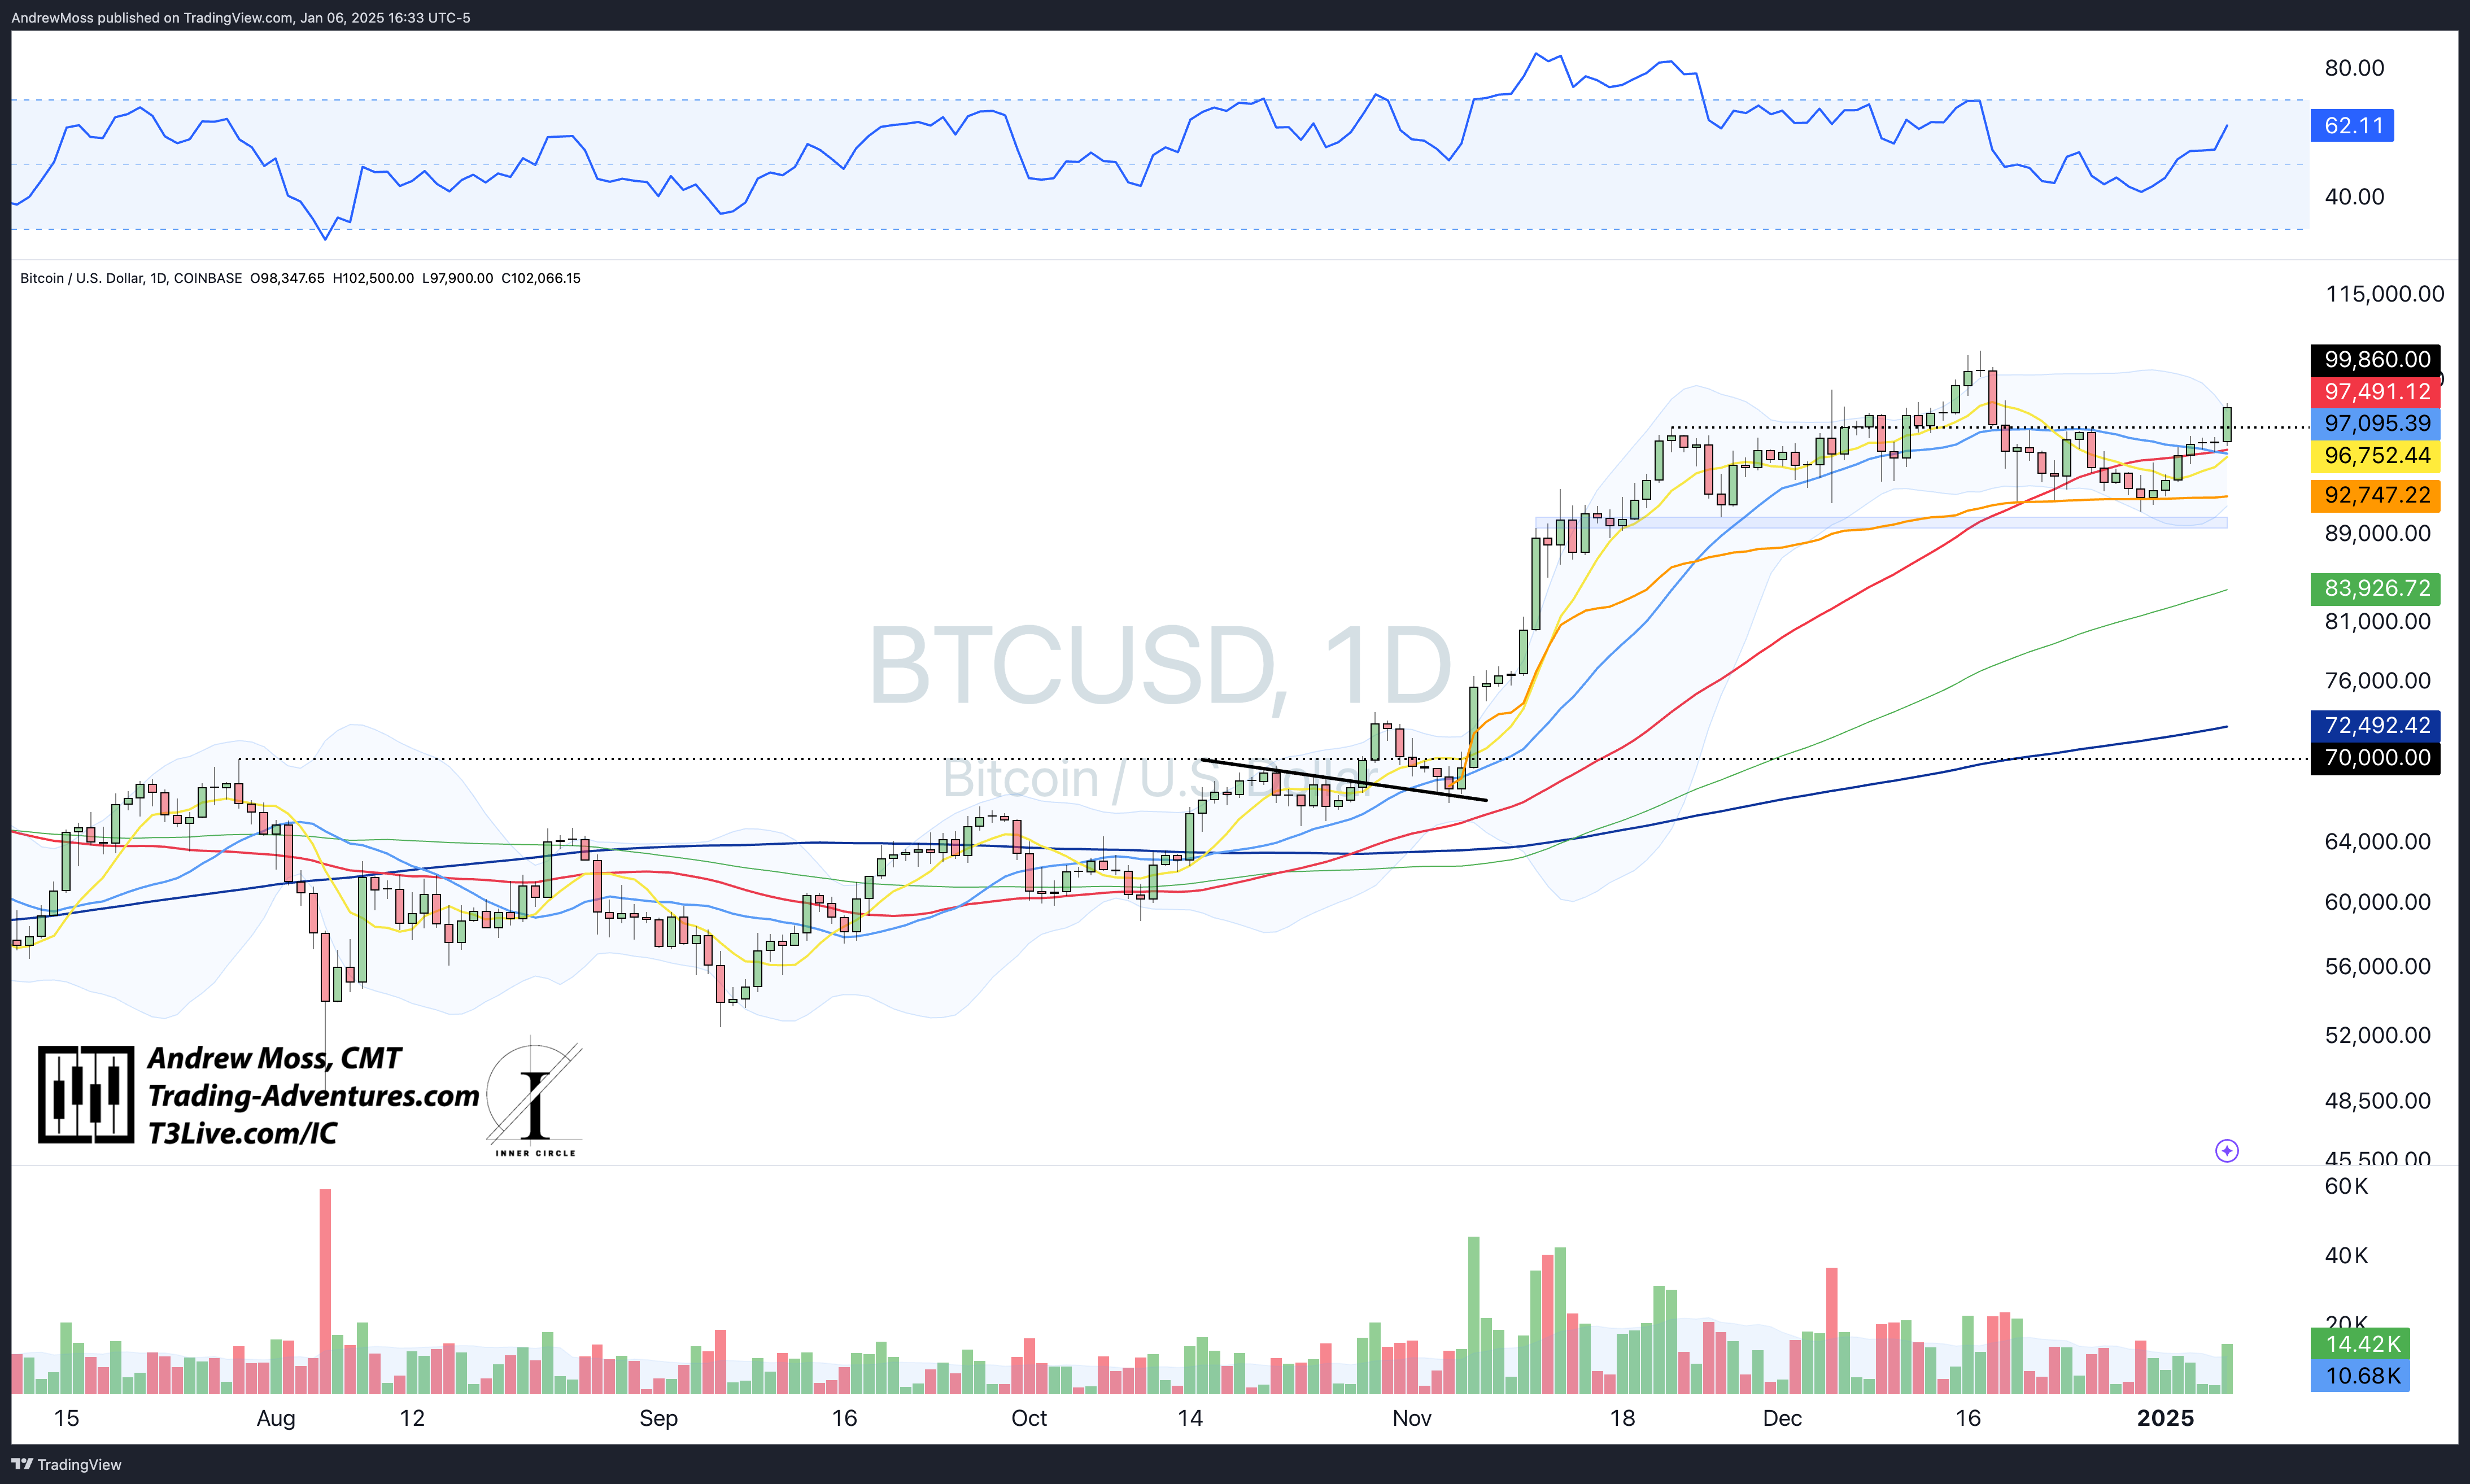
BTCUSD is back over $100k, breaking above the recent consolidation range and not seeming to care what the other indexes or assets are doing. As prices head higher, please refer to the opening of the📈Weekly Chart📉 analysis to look at the potential for a bigger move.
Bonus Charts
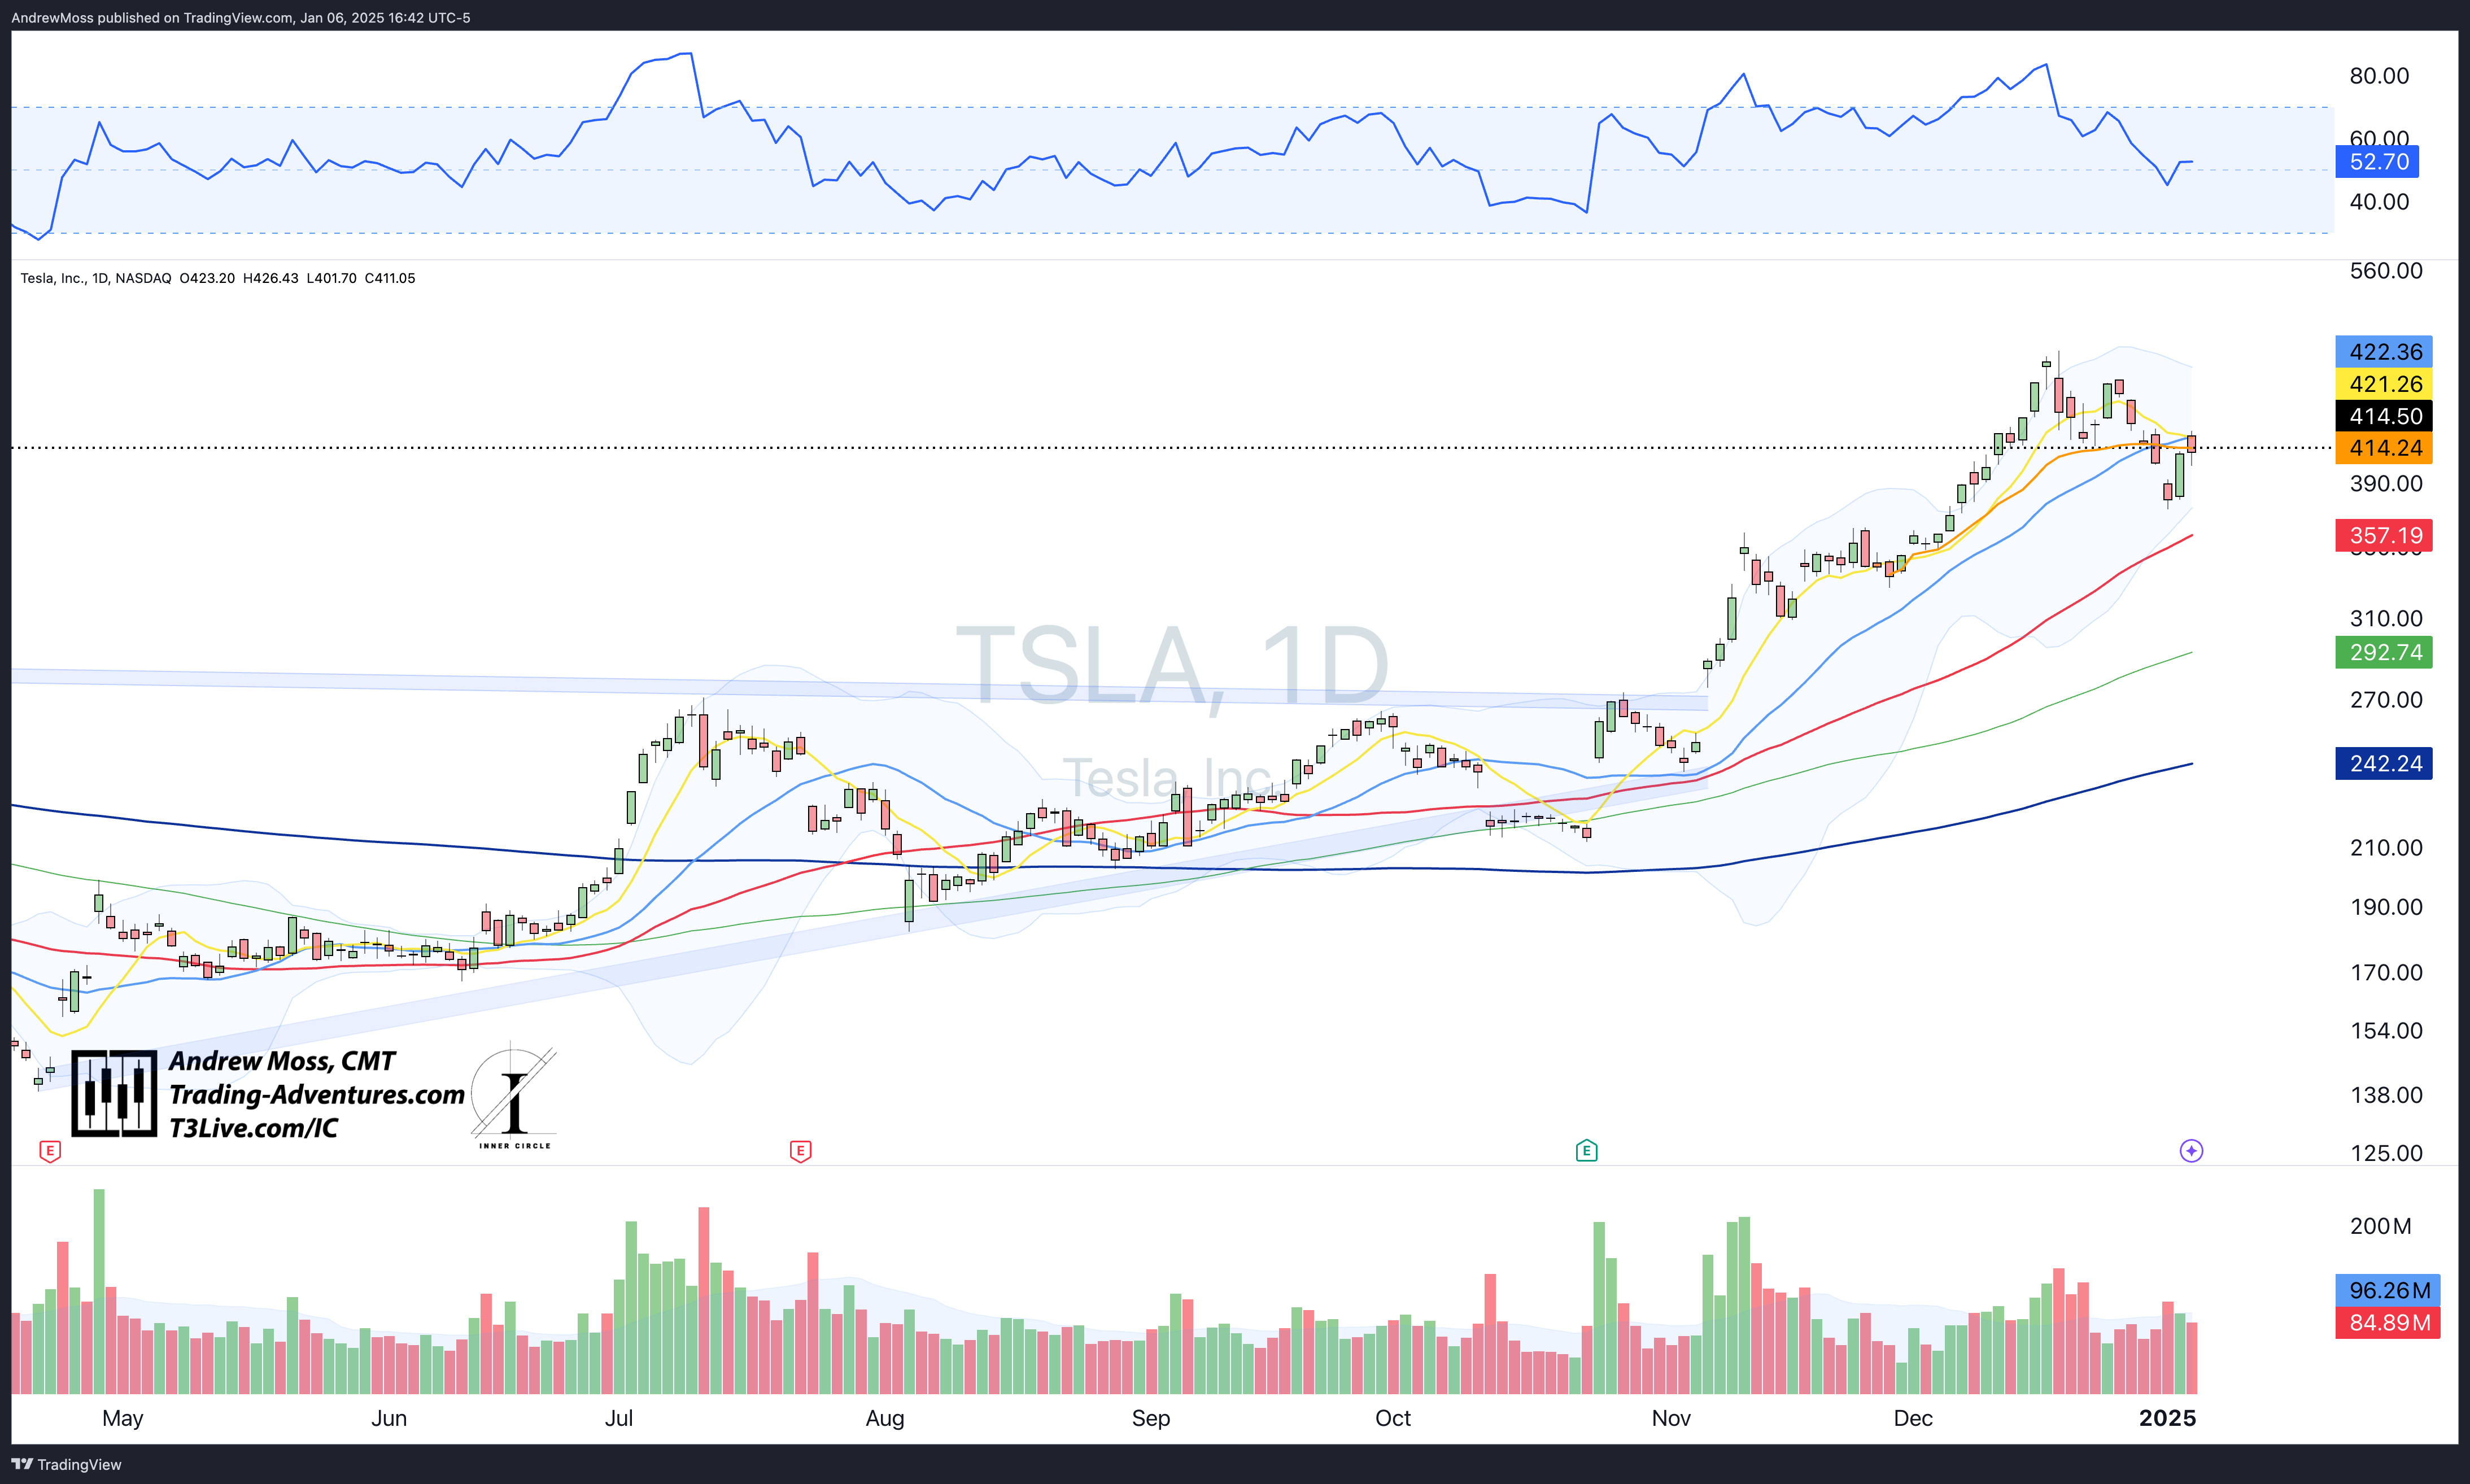
TSLA found resistance precisely at its 8 and 21-day MAs today and missed a close above the pivot low AVWAP at $414.50 pivot.
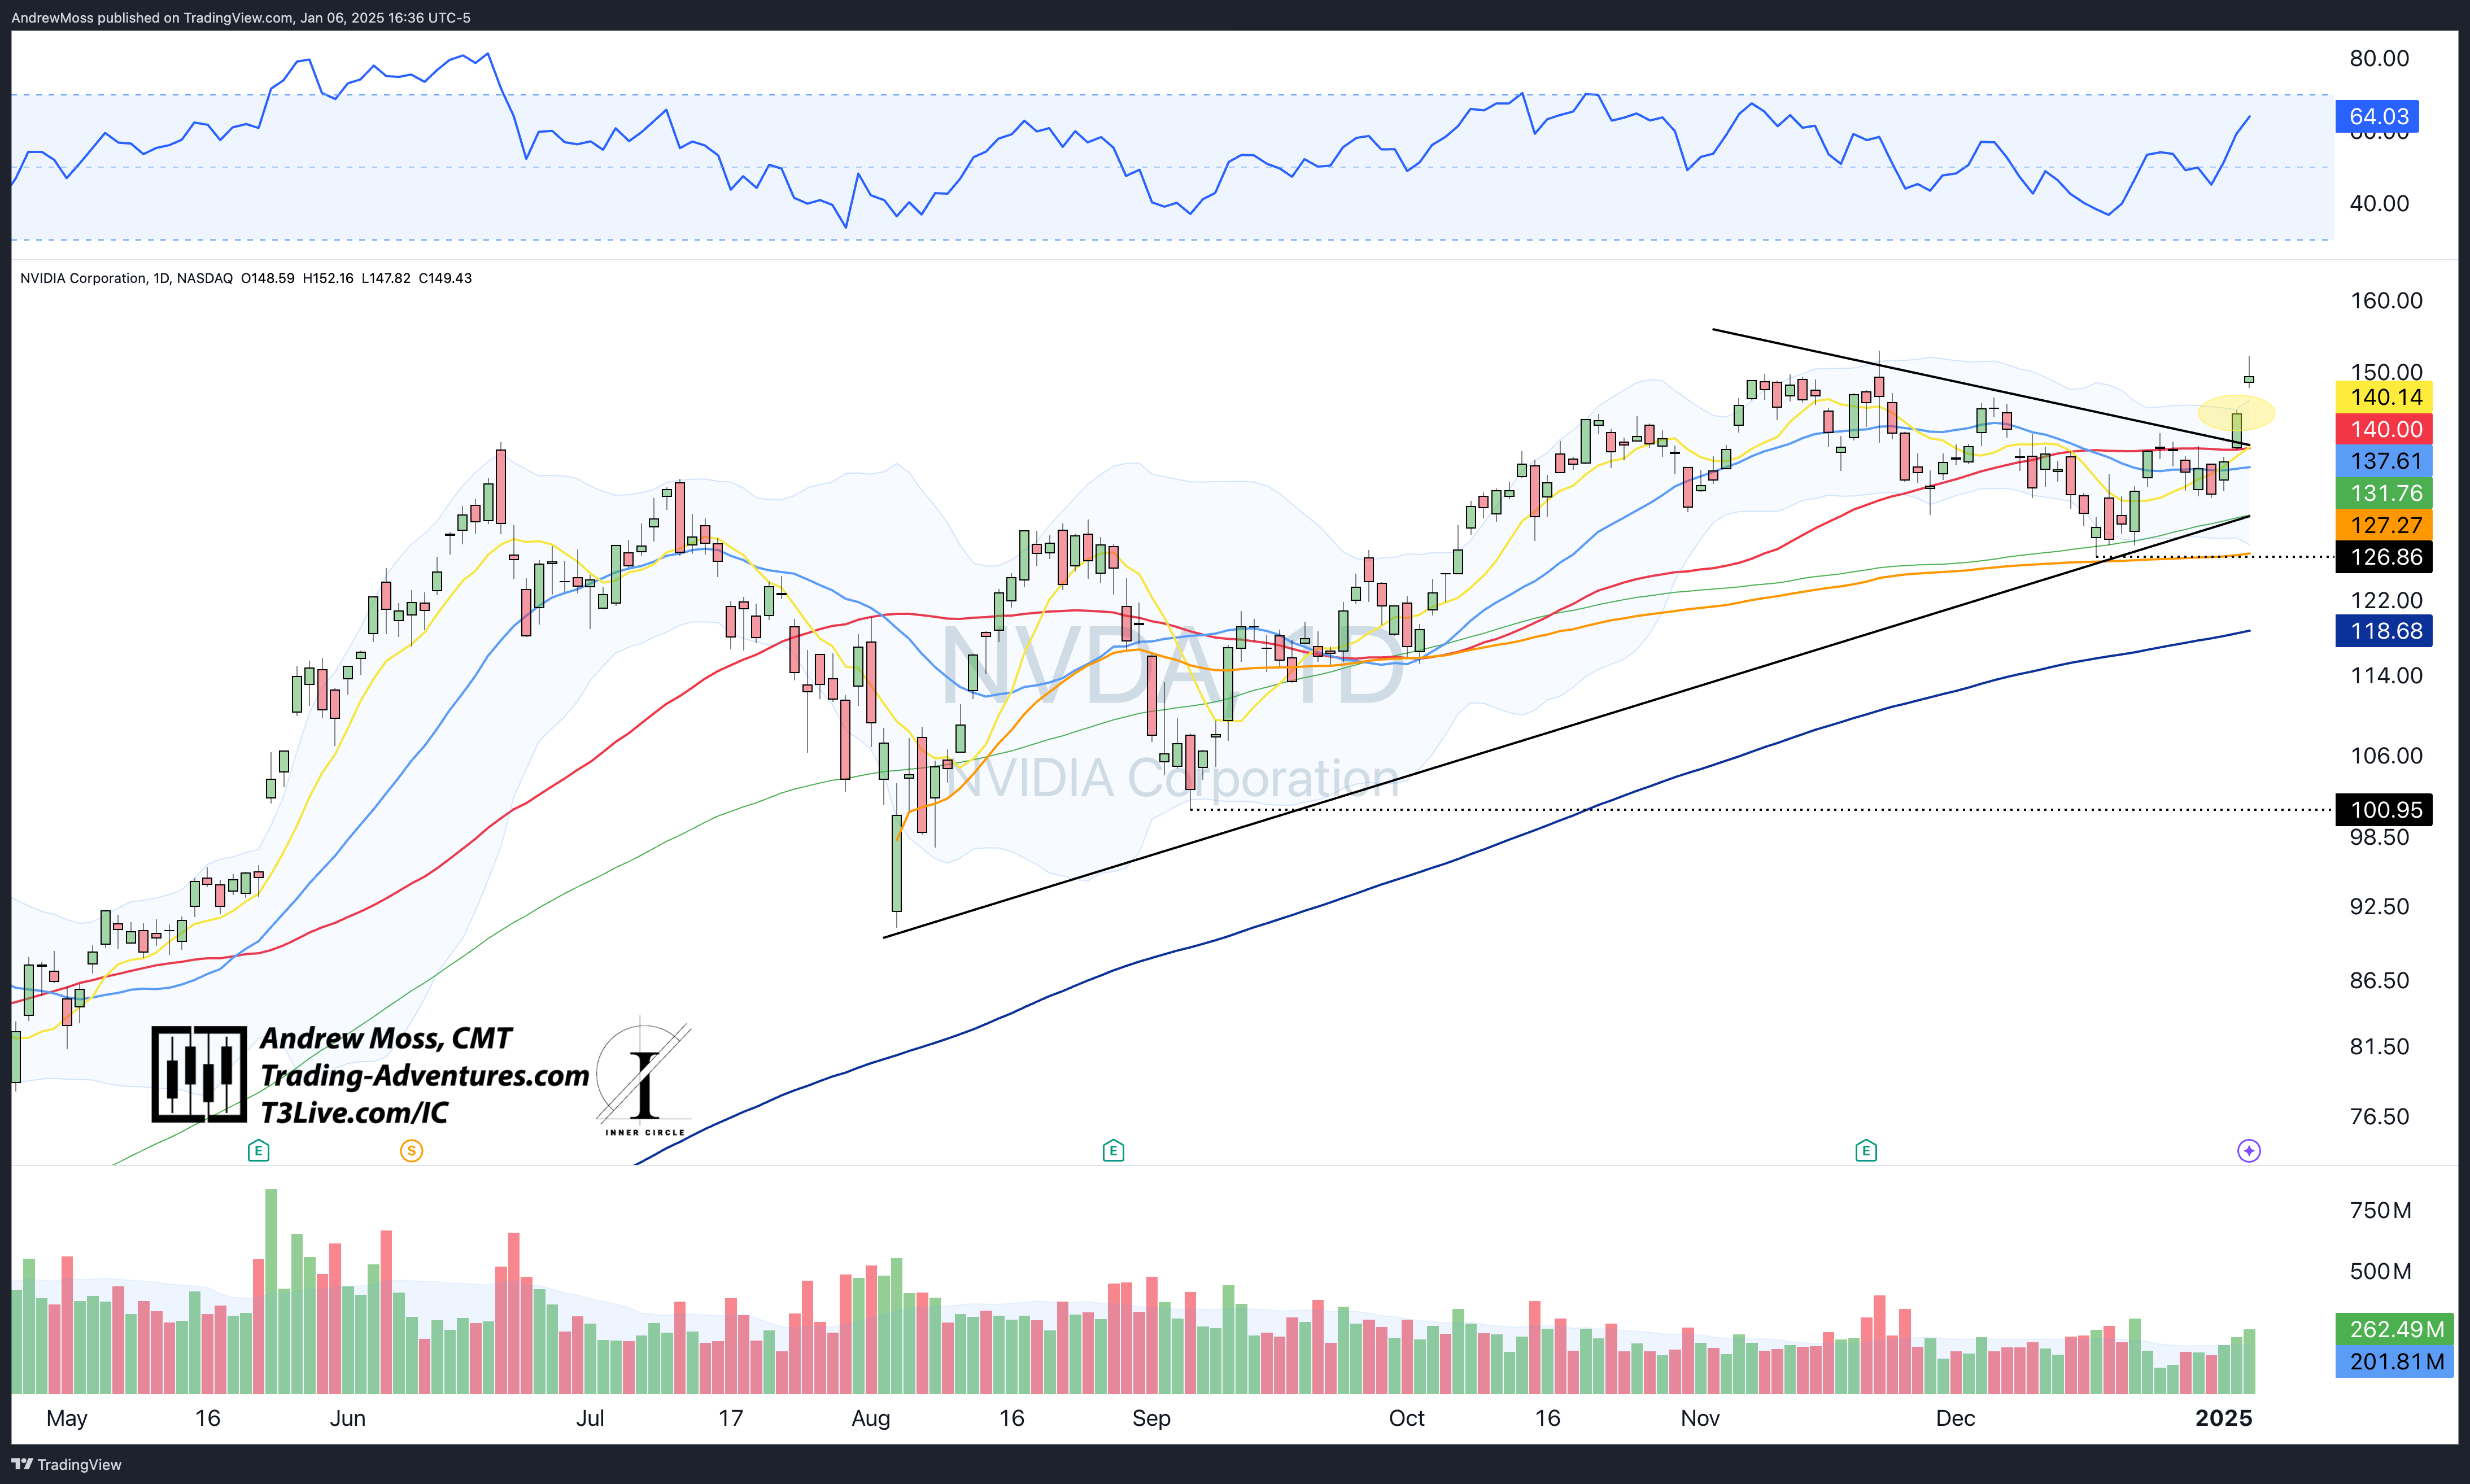
NVDA was a bright spot today as it notched a new all-time closing high with CEO Jensen Huang opened the Consumer Electronics Show (CES). As price breaks out, RSI moves up, and volume outpaces the daily average. Could this be the start of a move to ~$230? So far, it's checking off the boxes of the criteria listed in the 2025 Outlook.
The Disclosures
***This is NOT financial advice. This is NOT a recommendation to buy, sell, or trade any security. The content presented here is intended for educational purposes only.
Looking For More?
Elevate Your Trading Adventure Even Further With These Offerings.

EpicTrades Options Newsletter
Real-time insights and actionable trading ideas focusing on short-term options.
The approach includes detailed reasoning for trades, specific options, and profit targets, focusing on quick gains with less time commitment required from subscribers.

The Inner Circle
The Inner Circle is a Virtual Trading Floor (VTF) at T3 Live.
Founded by David Prince and led by him, Rick March, and Kira Turner, the Inner Circle is a community of elite traders, including hedge fund managers, family office heads, corporate executives, financial advisors, and even professional poker players.
Fundamental, Macro, and Technical Analysis all combine to find and discuss the best opportunities in current markets.
