

Monthly Charts
Market Update August 31, 2023
Special Announcement!
This entry is very chart heavy. It may get cut off in your email. If so, click through to read the complete article.
The Markets
We’ve got a nice coincidence with the Trading Adventures publishing schedule change; it’s the end of the month. Which means we can take a look at the monthly charts.
But first, a recap of the price action so far.
Stocks are mostly higher for the 5th consecutive day as earnings and econ data have been well received. Notably, the JOLTs report Tuesday morning indicated that the jobs market may be cooling off. Bad news, right? Well, yes, for some.
But for stocks, the news was a boost. A slowing jobs market means that the Federal Reserve is getting the desired effect of the interest rate hikes. And if they are getting the result they want then can slow down, or stop raising. Therefore, stocks go up.
Now we look to the Nonfarm payrolls number tomorrow morning. After 5 days higher for stocks, it’s harder to have high expectations, even if the numbers are favorable. But anything can happen.
Monthly Charts
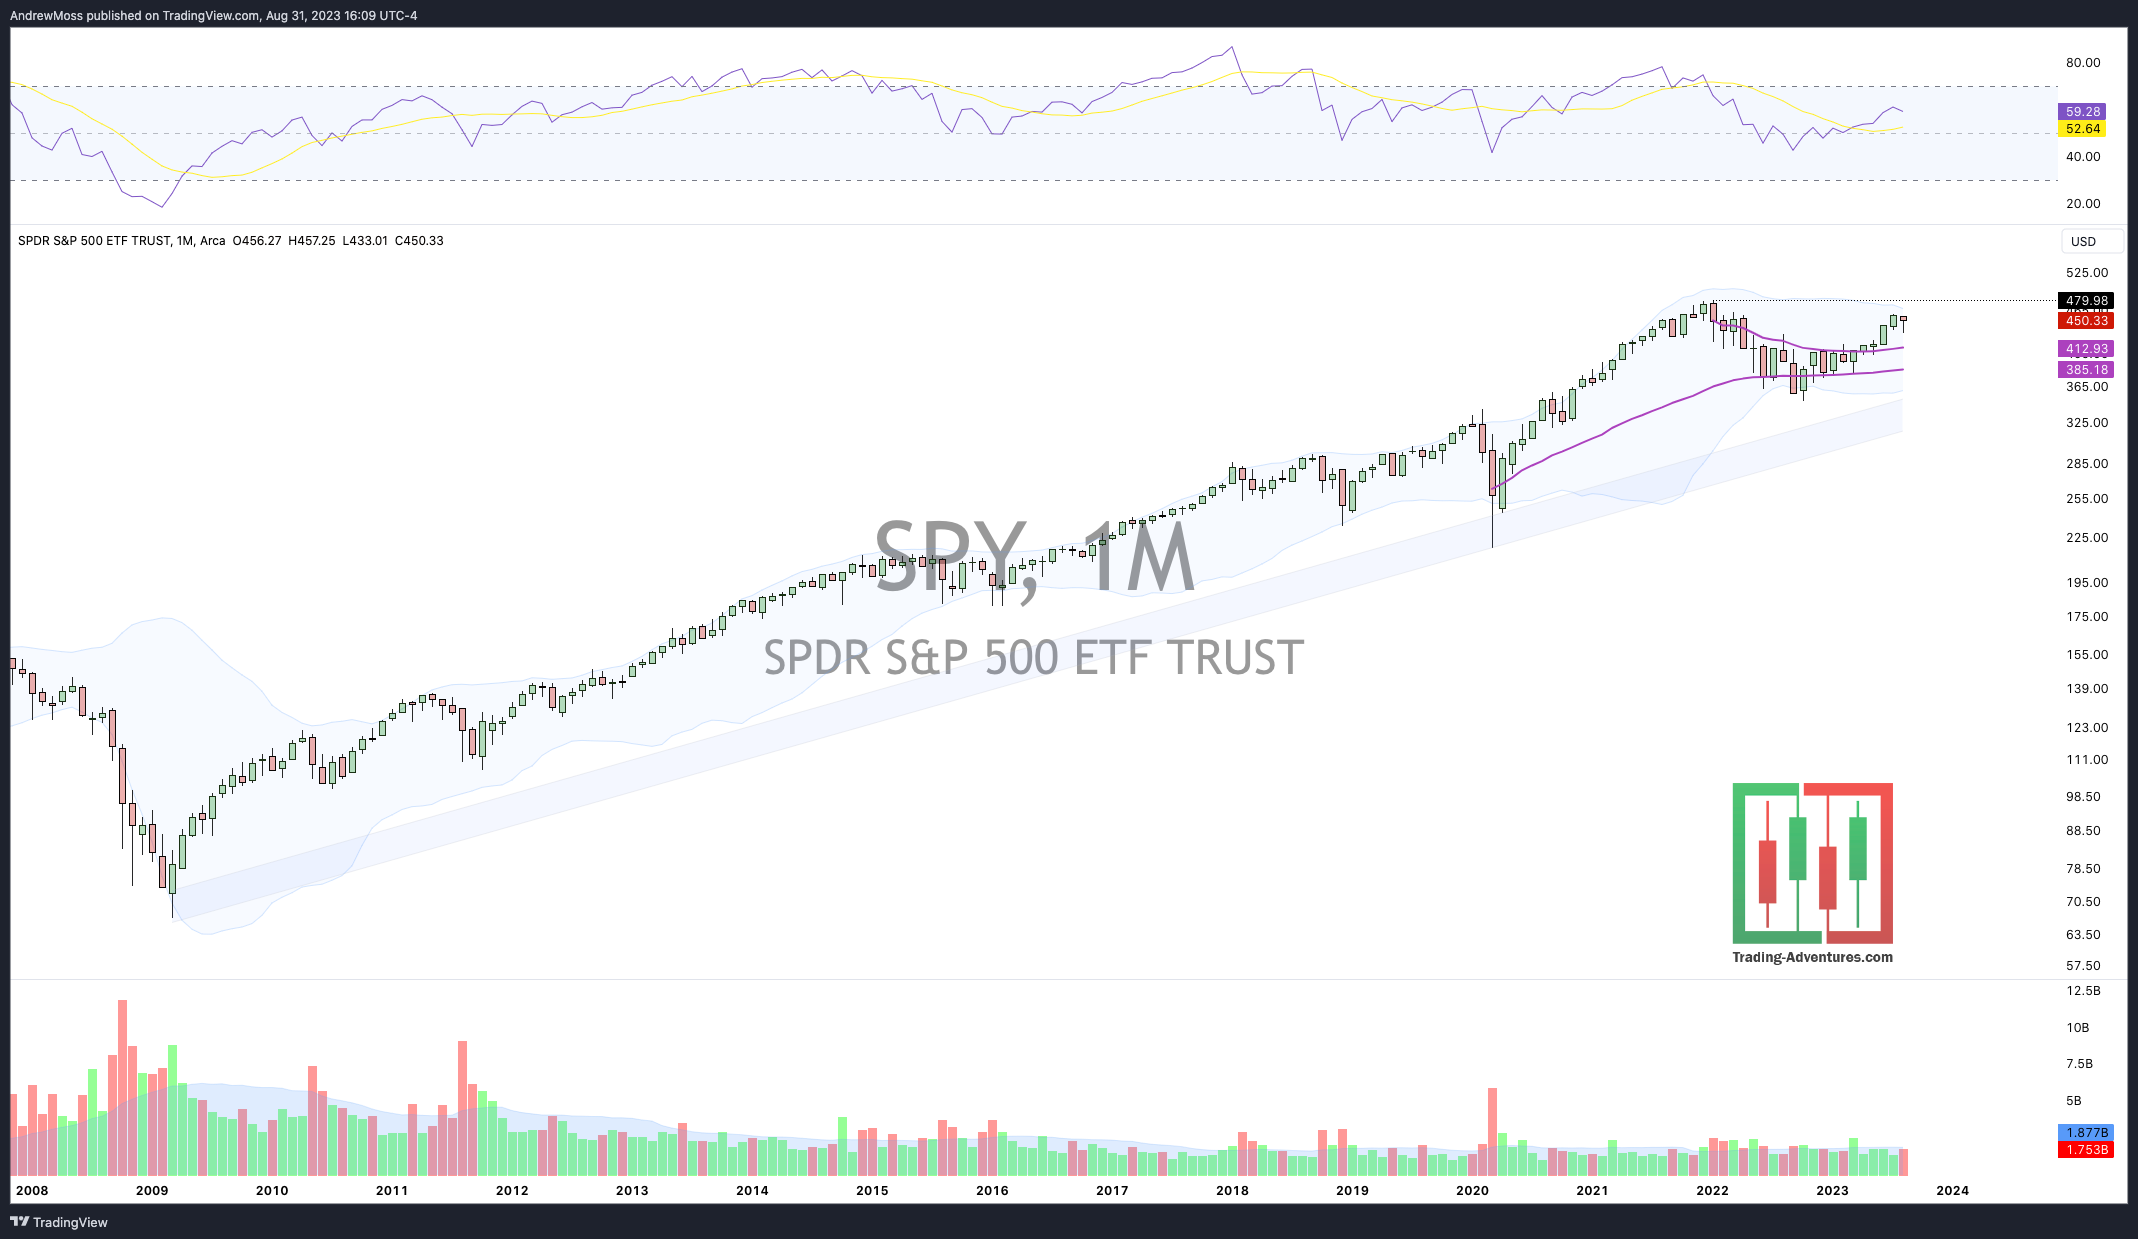
SPY Closing the month in the upper end of the range and only ~6% off the all-time high, $479.98.
QQQ rallies to close in the upper half of the long-standing uptrend channel.

IWM continues the sideways move and closes the month between the ATH and Covid low anchored VWAPs. Indecision.

DIA came back to retest the upper bounds of the range.

TLT Treasury bonds were able to bounce from the October ‘22 pivot low.

DXY The US Dollar continues along in a mostly sideways range at a long-time support/resistance zone.

More charts! The Macro View
ACWX The Rest Of The World is struggling to find upward momentum.

FXI China gave back most of last month’s progress, showing continued weakness.

TNX 10-year yields found resistance at the 2022 highs.

TYX 30-year yields moved briefly above last year’s high before coming back down.

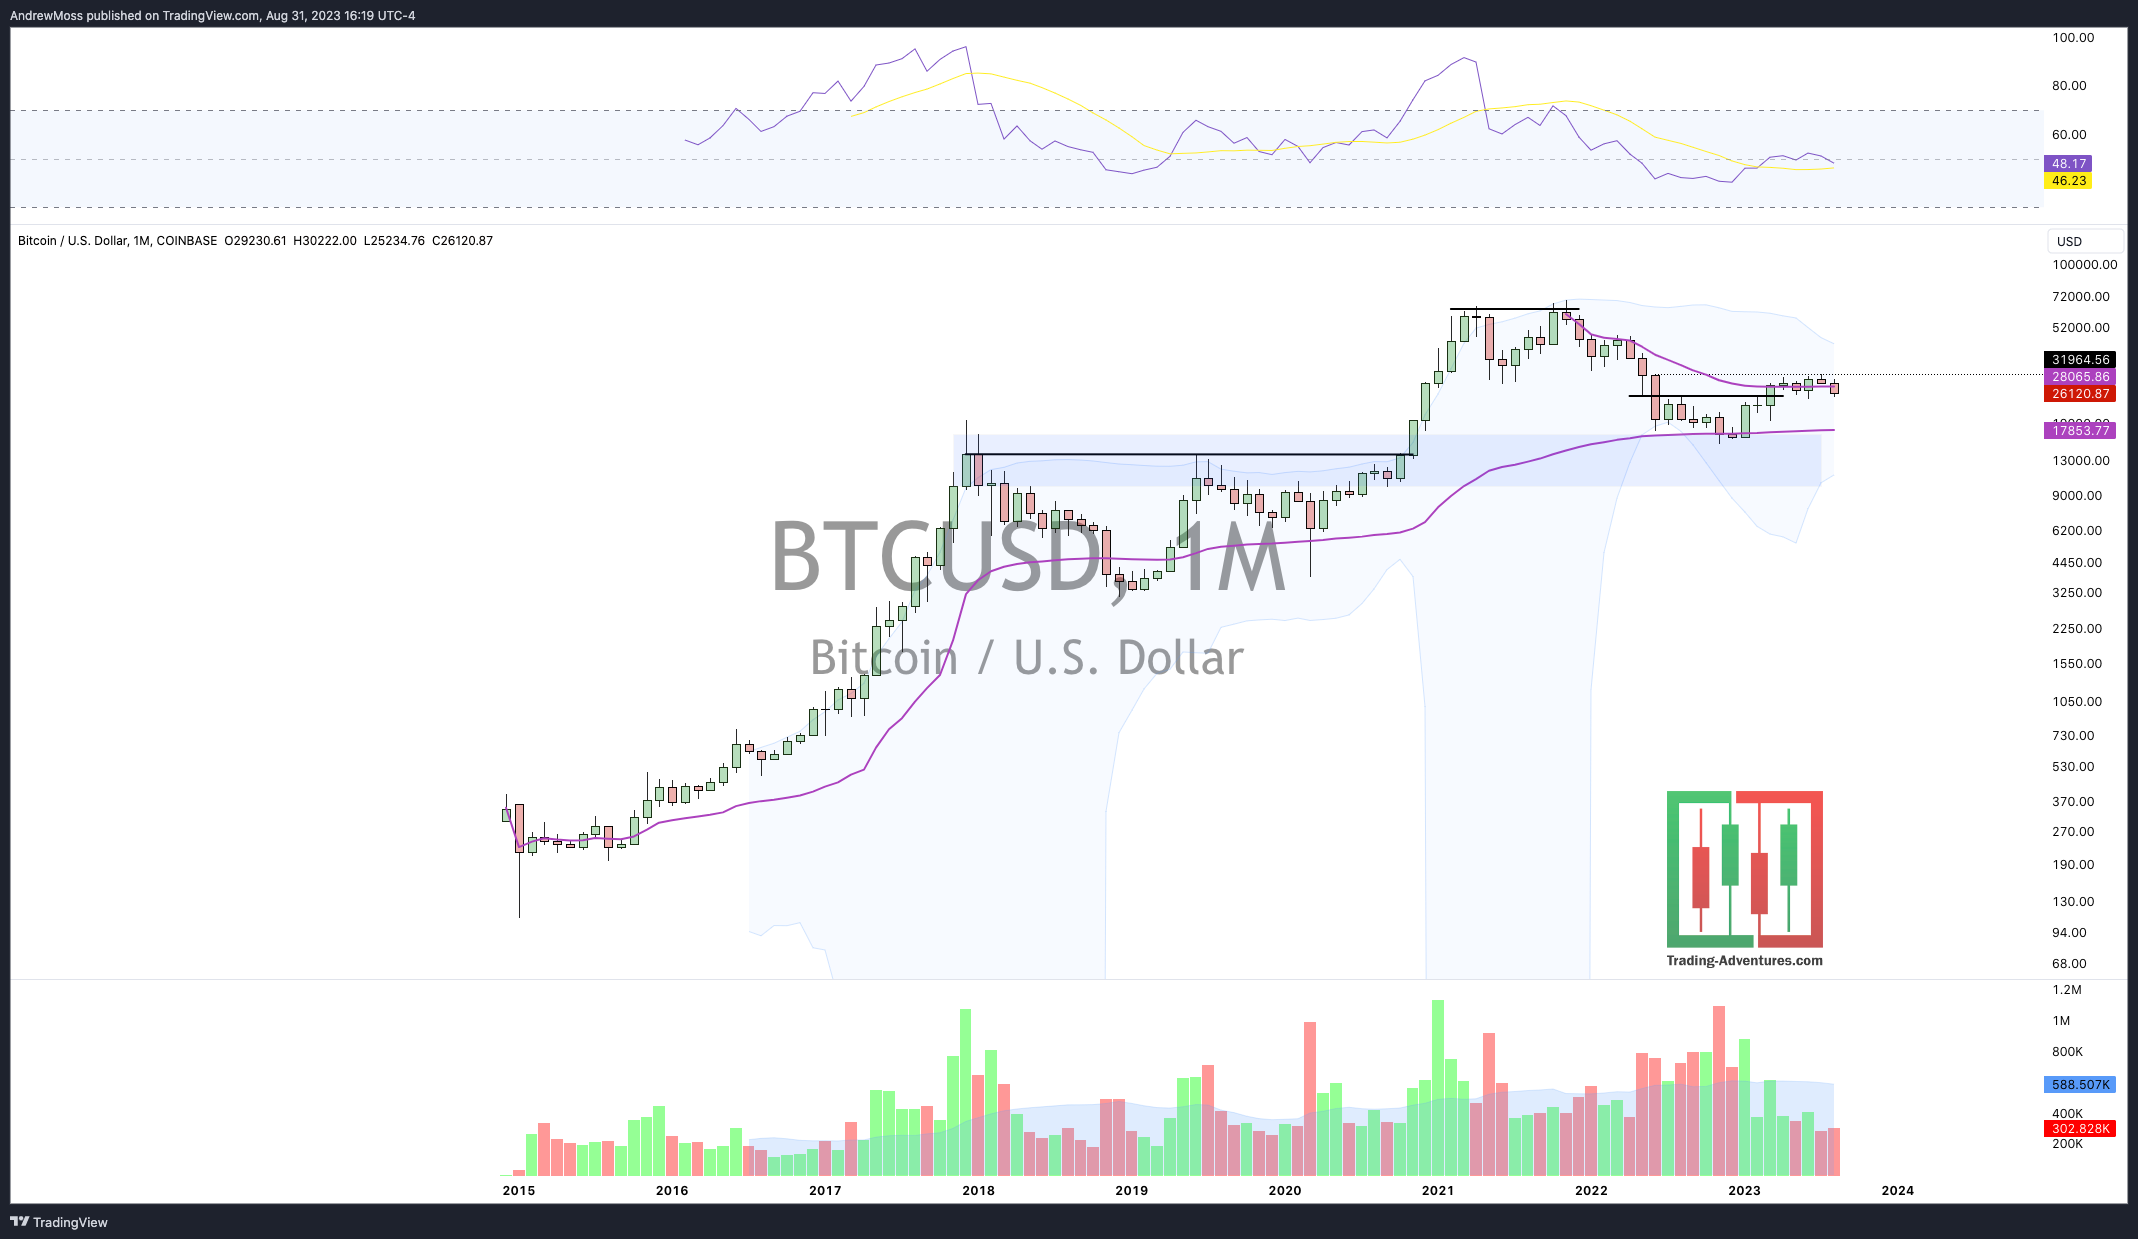
BTCUSD Bitcoin is still hovering around the VWAP anchored to the all-time high.
GSG Commodities held last month’s breakout well and stayed close to the ATH AVWAP.

USO Oil may want to take another shot at the downtrend resistance line.

GLD Gold rallied to save the breakdown.

SPY vs. ACWX - US Stocks vs. The Rest of the World is still in an uptrend.

The 7+
META found resistance at the $328 pivot.

AAPL stayed close to all-time highs.

AMZN working its way higher

GOOGL Alphabet is making progress.

MSFT is still struggling with resistance near the Nov. ‘21 high.

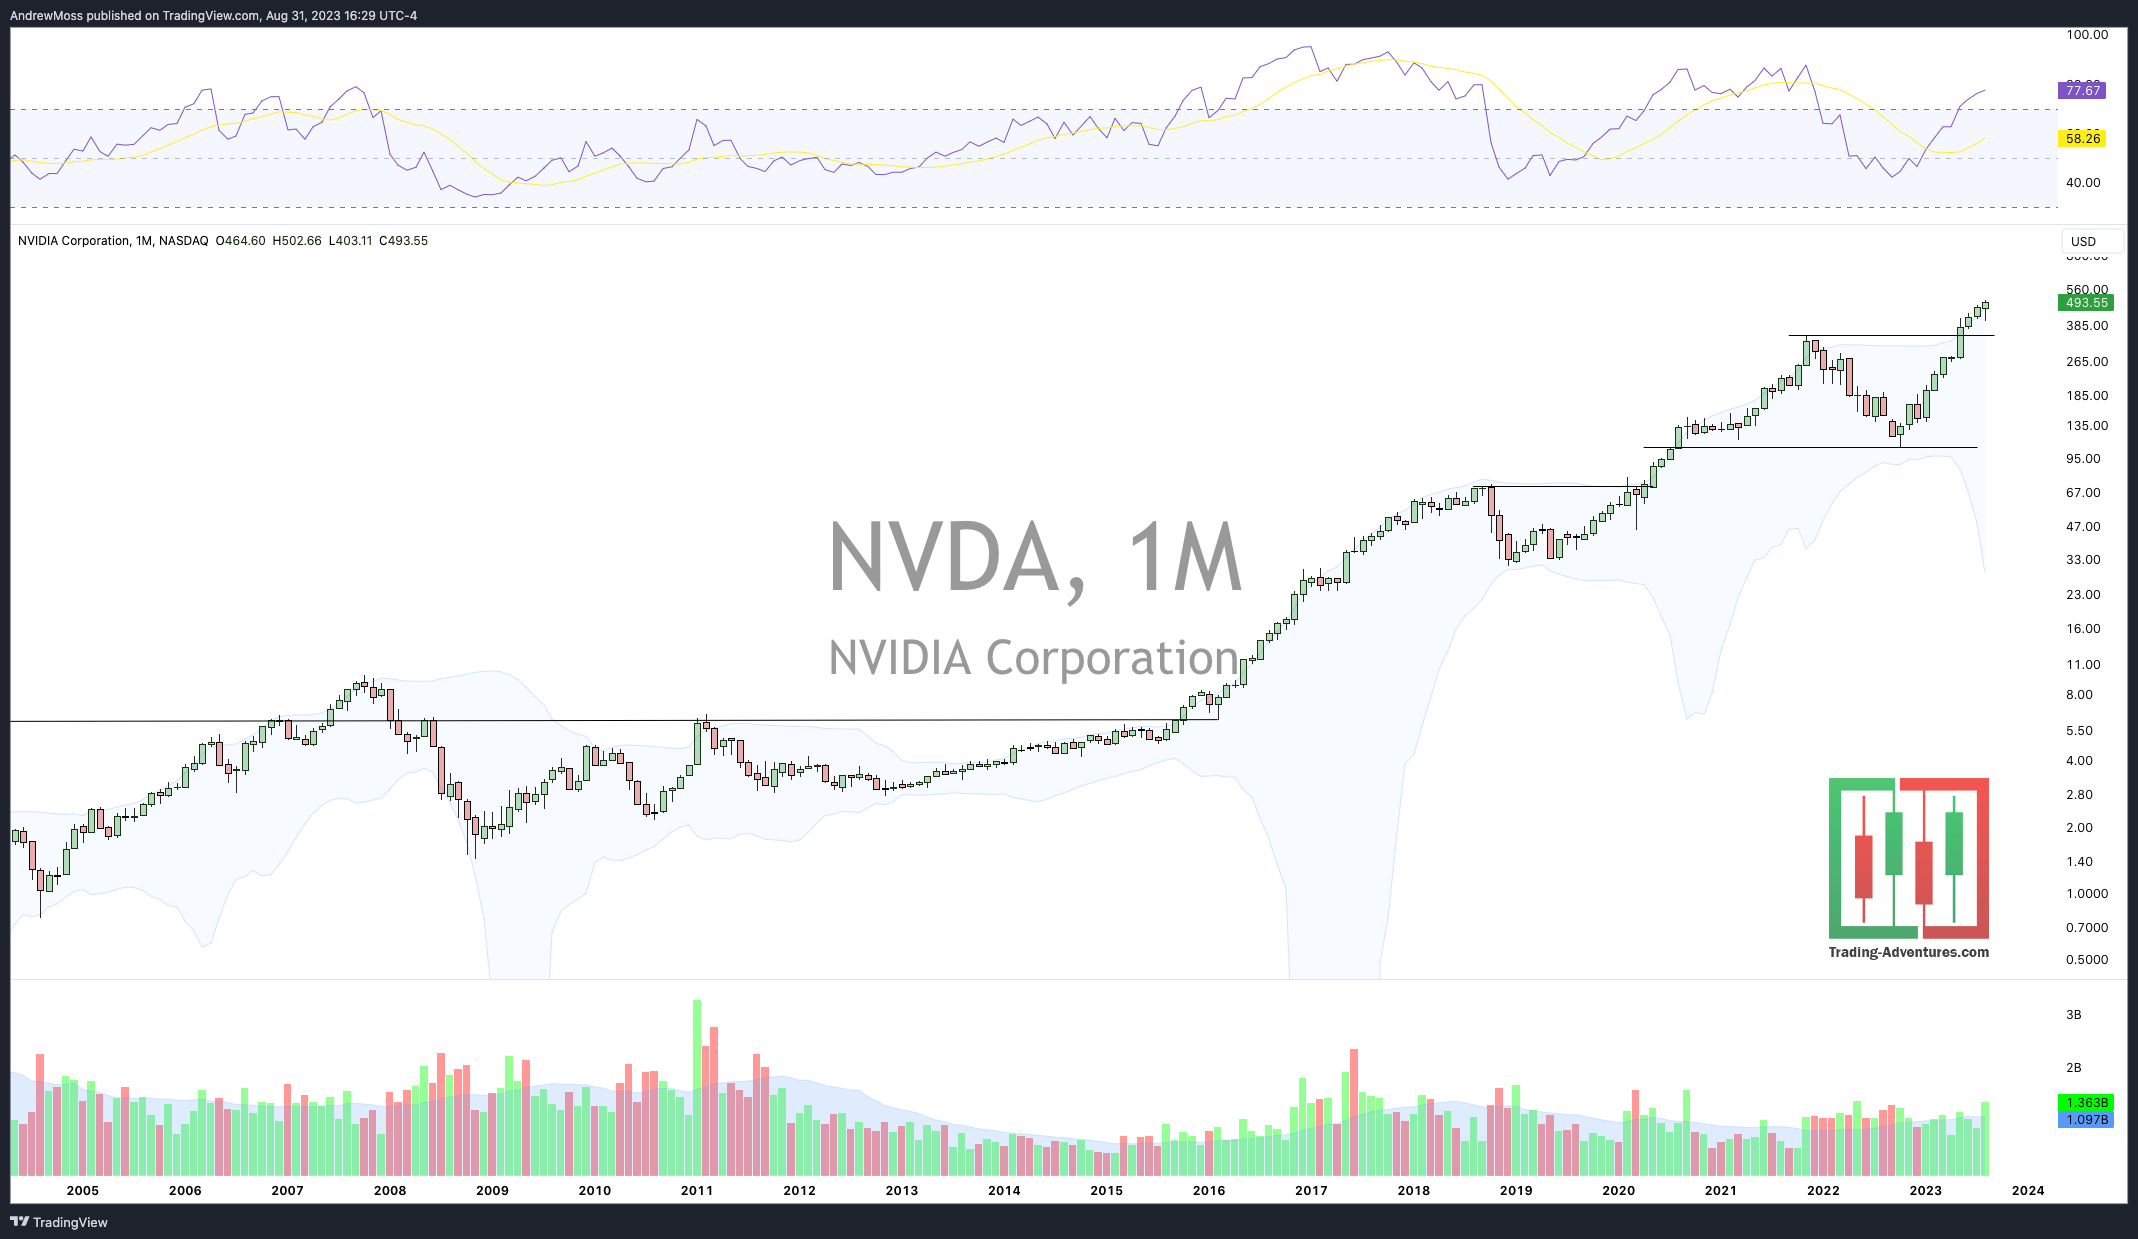
NVDA puts in another record-high monthly close.
TSLA rallied to close in the upper half of the last 3 months range.

NFLX is undecided as the closing price of the last three months is in a tight range.

The Closing Bell
Perspective helps.
The really big picture, monthly view shows many long-standing trendlines are still valid.
The short-term daily view shows SPY and QQQ indexes above all of the key moving averages, but not yet making new highs.
And the view into tomorrow morning suggests Nonfarm Payroll data that will have some effect on the market.
It’s important to view many different timeframes, observe the trends, to recognize what little impact the news, earnings, and other current events might have on the big picture.
Saturday morning we’ll scale back to the Weekly Charts on Twitter/X. And I will continue to post the daily and smaller timeframe there every trading day.
https://twitter.com/Andy__Moss
As always, reply, leave a comment, or @ me if you have questions about these charts and putting multiple timeframes together.
The Disclosures
***This is NOT financial advice. NOT a recommendation to buy, sell, or trade any security. The content presented here is intended for educational purposes only.
Andrew Moss is an associated member of T3 Trading Group, LLC (“T3TG”) a SEC registered broker/dealer and member of FINRA/SIPC. All trades placed by Mr. Moss are done through T3TG.
Statements in this article represent the opinions of that person only and do not necessarily reflect the opinions of T3TG or any other person associated with T3TG.
It is possible that Mr. Moss may hold an investment position (or may be contemplating holding an investment position) that is inconsistent with the information provided or the opinion being expressed. This may reflect the financial or other circumstances of the individual or it may reflect some other consideration. Readers of this article should take this into account when evaluating the information provided or the opinions being expressed.
All investments are subject to the risk of loss, which you should consider in making any investment decisions. Readers of this article should consult with their financial advisors, attorneys, accountants, or other qualified investors prior to making any investment decision.
POSITION DISCLOSURE
August 31, 2023, 4:00 PM
Long: AMZN, META, MSFT, QQQ, TSLA
Short:
Options symbols are denoted as follows:
Ticker, Date, Call/Put, Strike Price
Example: VXX1218C30 = VXX 12/18 Call with a $30 strike