October 7, 2022 Weekend Market Review/Preview
Ok, we bounced. Is that all we get?
Welcome to the weekend.
It’s been a busy week with lots of new readers and subscribers. Thank you for that!
And thanks to all of you that have shared this page either by forwarding an email or by linking an article in your Twitter feed. I really appreciate it.
If you’re a first-time reader and haven’t already, take a minute to subscribe now.
So, the market bounced.
But is that all we get?
It looks that way.
The bulls had a real chance to step in and take things higher after a phenomenal two-day bounce that had lots of corroborating support.
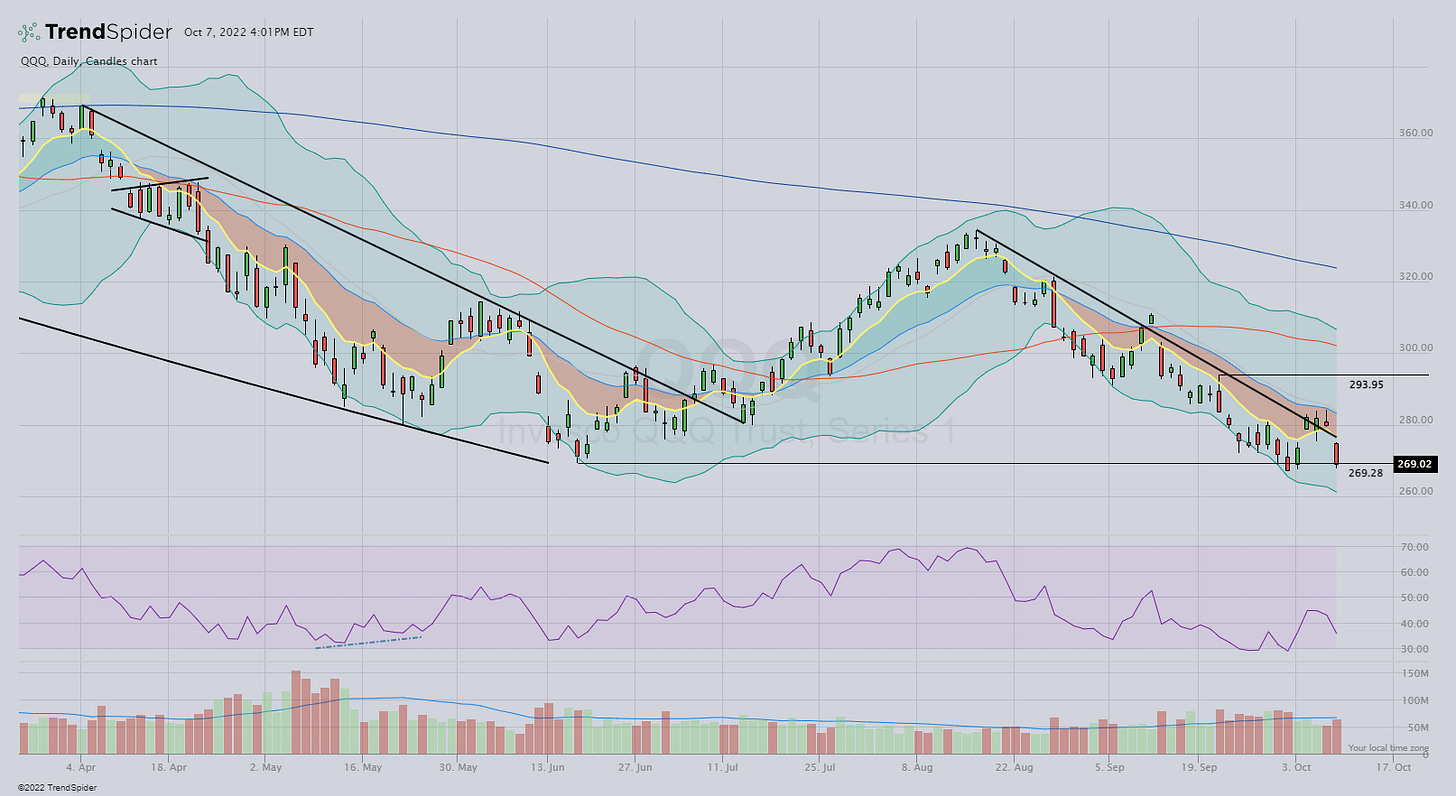
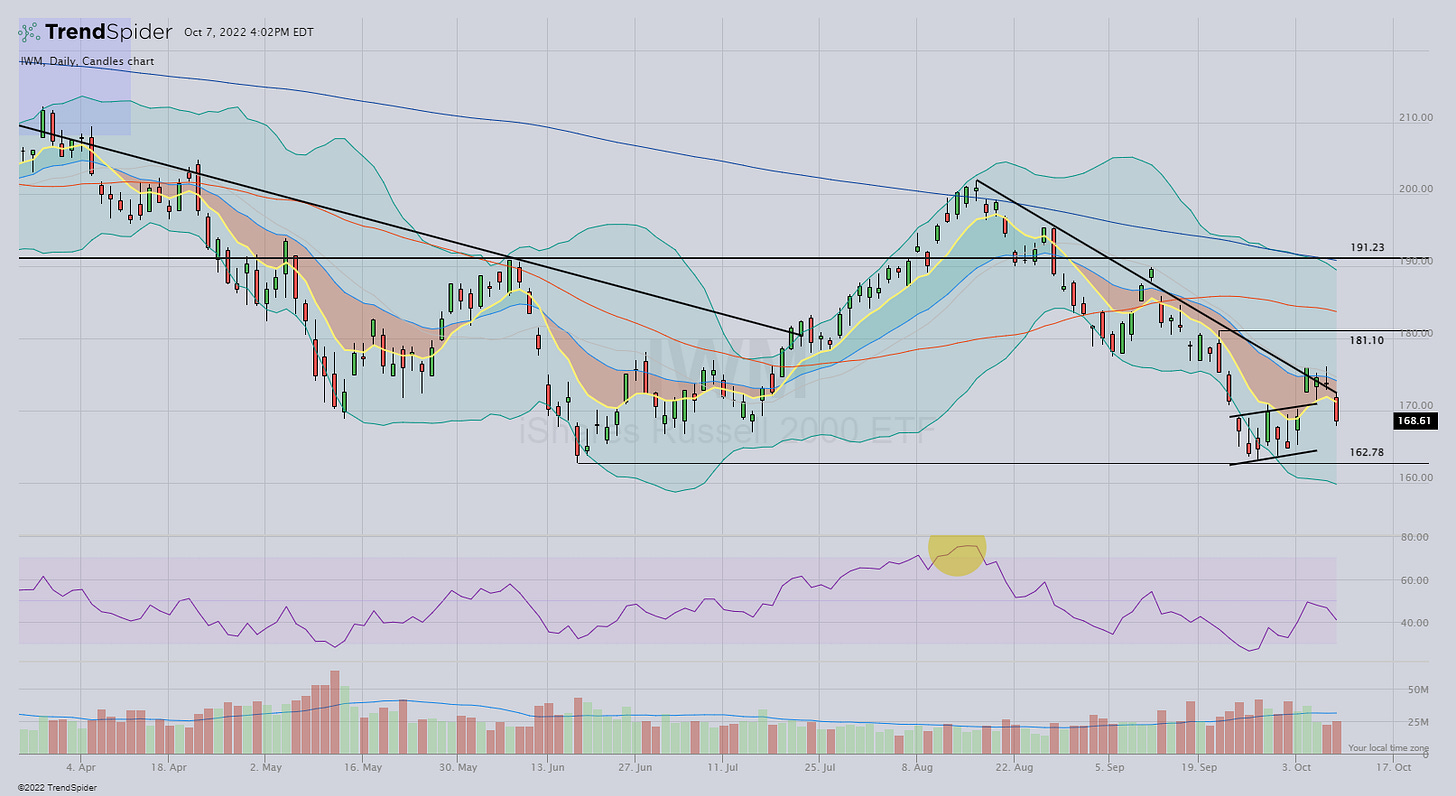
SPY QQQ and IWM charts all set up very well with three days of consolidation between the 8 and 21-day EMAs.
All we needed was a break higher from that 3-day range and traders would've been yelling, giddyup!
Now, as we close out the week with SPY and QQQ re-testing the June lows, the bounce looks to be a failure and it seems likely that new lows are coming.
As Brian Shannon likes to say,
“this market is guilty until proven innocent.”
That doesn’t change until prices are back above the key moving averages.
Until then…..
This line has been a real problem for the SP 500.
August 26 - Powell Speaks in Jackson Hole, WY
September 13 - Inflation Hot CPI report
October 7 - AMD's pre-announcement and lowered guidance instills earnings fears
The charts.
$DXY
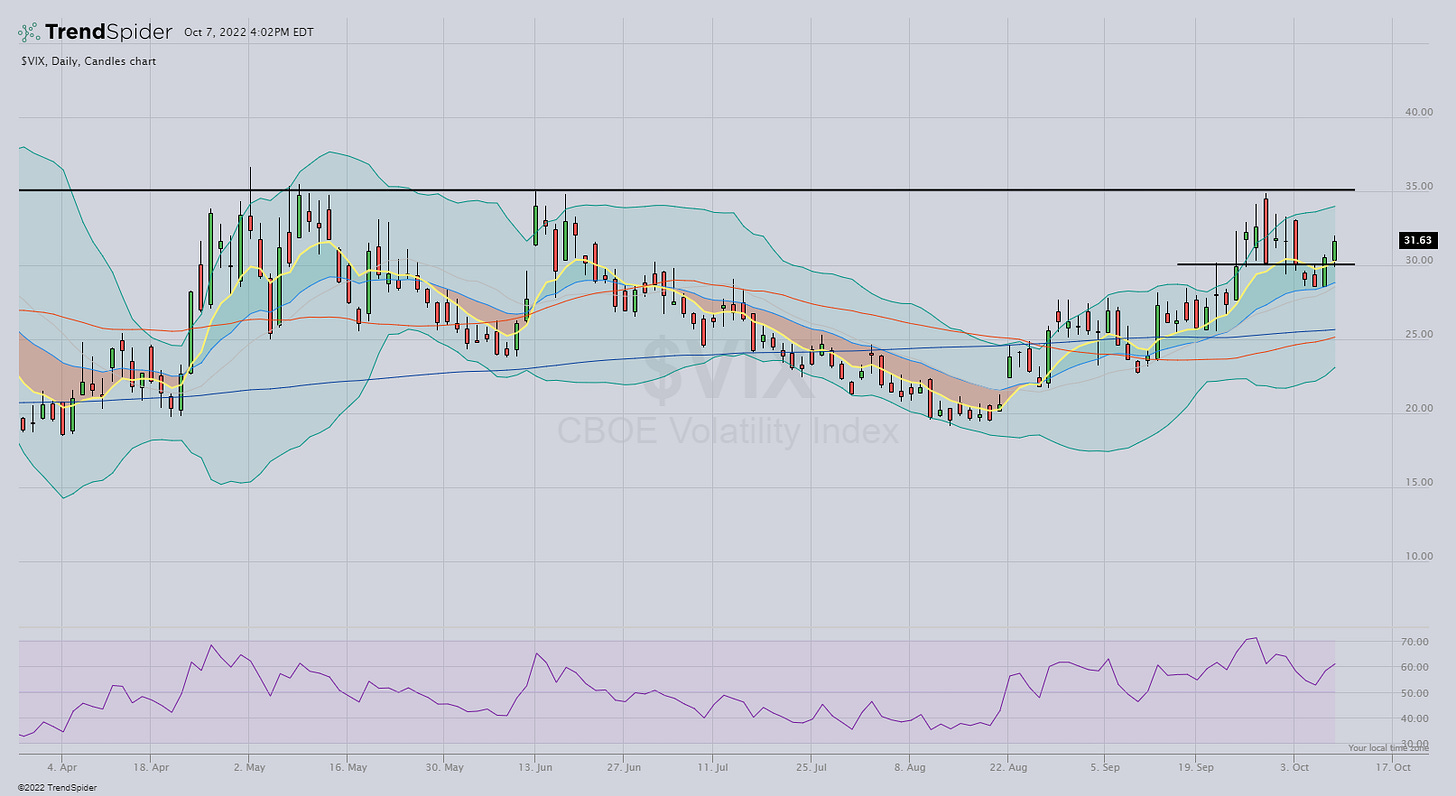
$VIX
Bull and bear case
Before we get too excited, and in advance of the bearish growls and "chicken little" calls we'll hear over the weekend, let's take a step back and make sure we're considering both sides.
The bull case still has a few main pieces.
The major indexes are still above the recent lows
Seasonality and the election cycle history are a tailwind
Moods are very dependent on The FED
While it may be difficult to imagine the Fed reversing course here, the Pivot story is still being discussed by some. Who knows what they'll do? And we don't need to debate what is or isn't the right course of action. But if they did announce a pause in rate hikes it would certainly have an effect on the markets.
from @AlmanacTrader
The bear case is more of the same.
Failed bounces
Prices below declining key moving averages
Most charts are broken, from a technical point of view
New lows in the coming days or weeks would confirm all of that and point forcefully toward even lower prices.
What I'm reading and listening to
David Perrell shares some really great ideas. This is worth a click to get to the complete list.
From Twitter
There were many eyes on $MSFT as we all looked for signs that the bounce could continue.
However, the shorter timeframe started flashing early warning signals.
And it wasn't just $MSFT. SP Futures $ES_F flashed an early warning as well.
This is how it felt at the end of last week. This is how it feels again today.
Mike Shell points out that the stock market leads.
Anything else?
That's all for now. Thanks always for reading, subscribing, and sharing with your friends and family.
Join me tomorrow morning on Twitter for a look at the weekly charts.
I hope you have a fantastic weekend.
***This is NOT financial advice. NOT a recommendation to buy, sell, or trade any security. The content presented here is intended for educational purposes only.
Andrew Moss is an associated member of T3 Trading Group, LLC (“T3TG”) a SEC registered broker/dealer and member of FINRA/SIPC. All trades placed by Mr. Moss are done through T3TG.
Statements in this article represent the opinions of that person only and do not necessarily reflect the opinions of T3TG or any other person associated with T3TG.
It is possible that Mr. Moss may hold an investment position (or may be contemplating holding an investment position) that is inconsistent with the information provided or the opinion being expressed. This may reflect the financial or other circumstances of the individual or it may reflect some other consideration. Readers of this article should take this into account when evaluating the information provided or the opinions being expressed.
All investments are subject to risk of loss, which you should consider in making any investment decisions. Readers of this article should consult with their financial advisors, attorneys, accountants or other qualified investors prior to making any investment decision.
POSITION DISCLOSURE
Long: SPY 1021P350
Short: SPY1021P330
Options symbols are denoted as follows:
Ticker, Date, Call/Put, Strike Price
Example: VXX1218C30 = VXX 12/18 Call with a $30 strike


