Off to a good start for the week, month, quarter
The bulls are building a case
In the weekend market review yesterday I wrote about the potentially dangerous-looking weekly chart patterns with $SPY and $QQQ. They both printed “shooting star” candles for the week which show that strength faded and we closed near the lows.
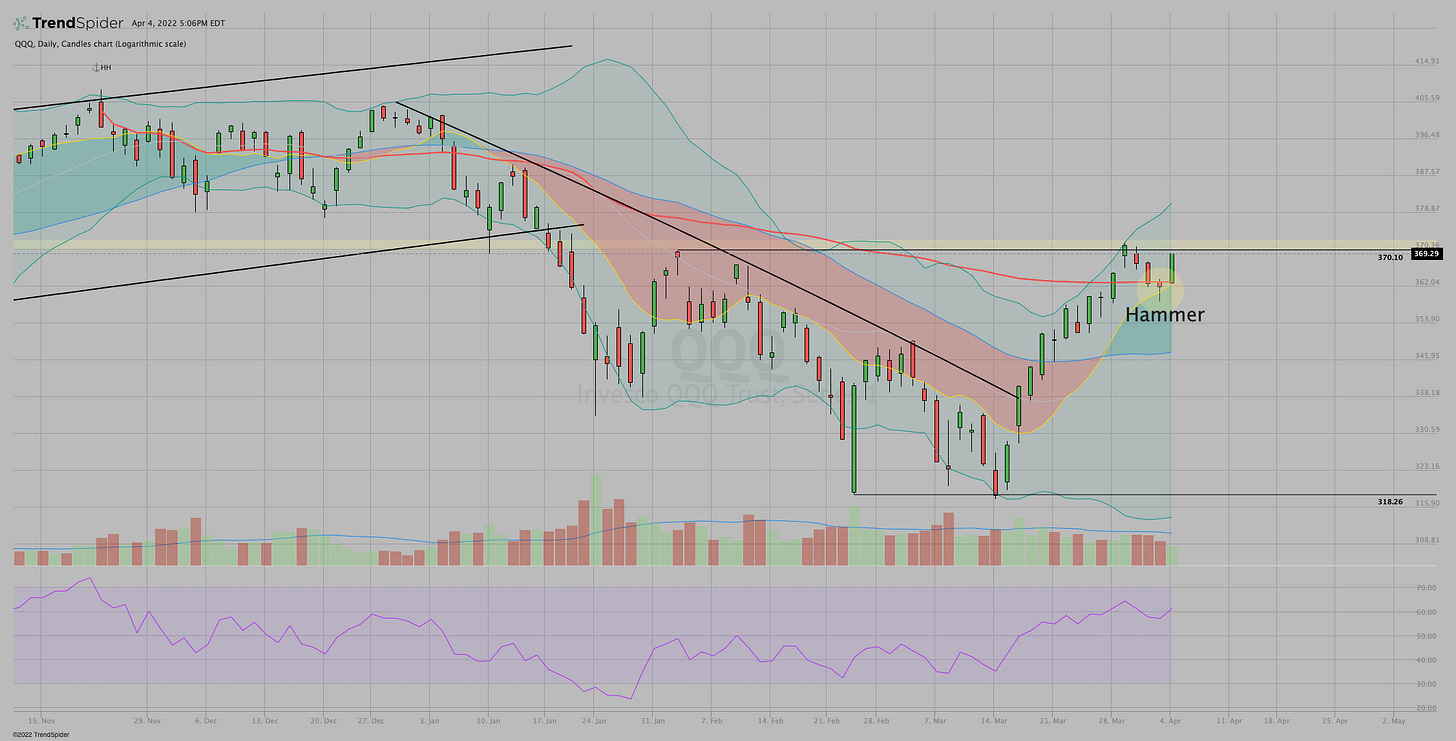
What I didn’t write about was the daily chart pattern which showed a different possibility. Friday’s daily candle for $SPY and $QQQ were hammers. Hammers, as we know, can be early indications of a reversal. They form when the price drifts lower from the open and then rebounds to close back near where it started.
Today’s positive price action confirms those hammers and signals that the reversal is real and is likely to continue. While we are technically still in neutral territory for the indexes, continued strength from here and an eventual move through last week's highs would put us more firmly in bullish territory.
It’s also worth noting that while $QQQ fell below the all-time-high anchored VWAP on Friday it got strongly back above that level today. The “anchored volume-weighted average price” introduced by Brian Shannon continues to fascinate me and proves to be a useful indicator. I will share examples of that in another article.
From here I’ll be watching to see how we handle potential resistance overhead at $SPY $458, then $462 and $QQQ $370, then $371.80.
Adding seasonality into the mix Jeff Hirsch, editor of the Stock Trader’s Almanac, points out that April is usually a strong month. He writes:
Since 2006, DJIA has been up in April sixteen years in a row with an average gain of 2.9%. S&P 500 has been up 15 of the last 16 with an average gain of 3.1%. April is the #1 month of the year for DJIA and S&P 500 since 1950 and third best for NASDAQ (since 1971).
Another layer of probability.
I’ll be back with another market update on Wednesday to see how it’s going.


