Oil-Up. Yields-Up. Dollar-Up. Stocks-??
Monday Market Update
Straight to the charts today.
The Charts
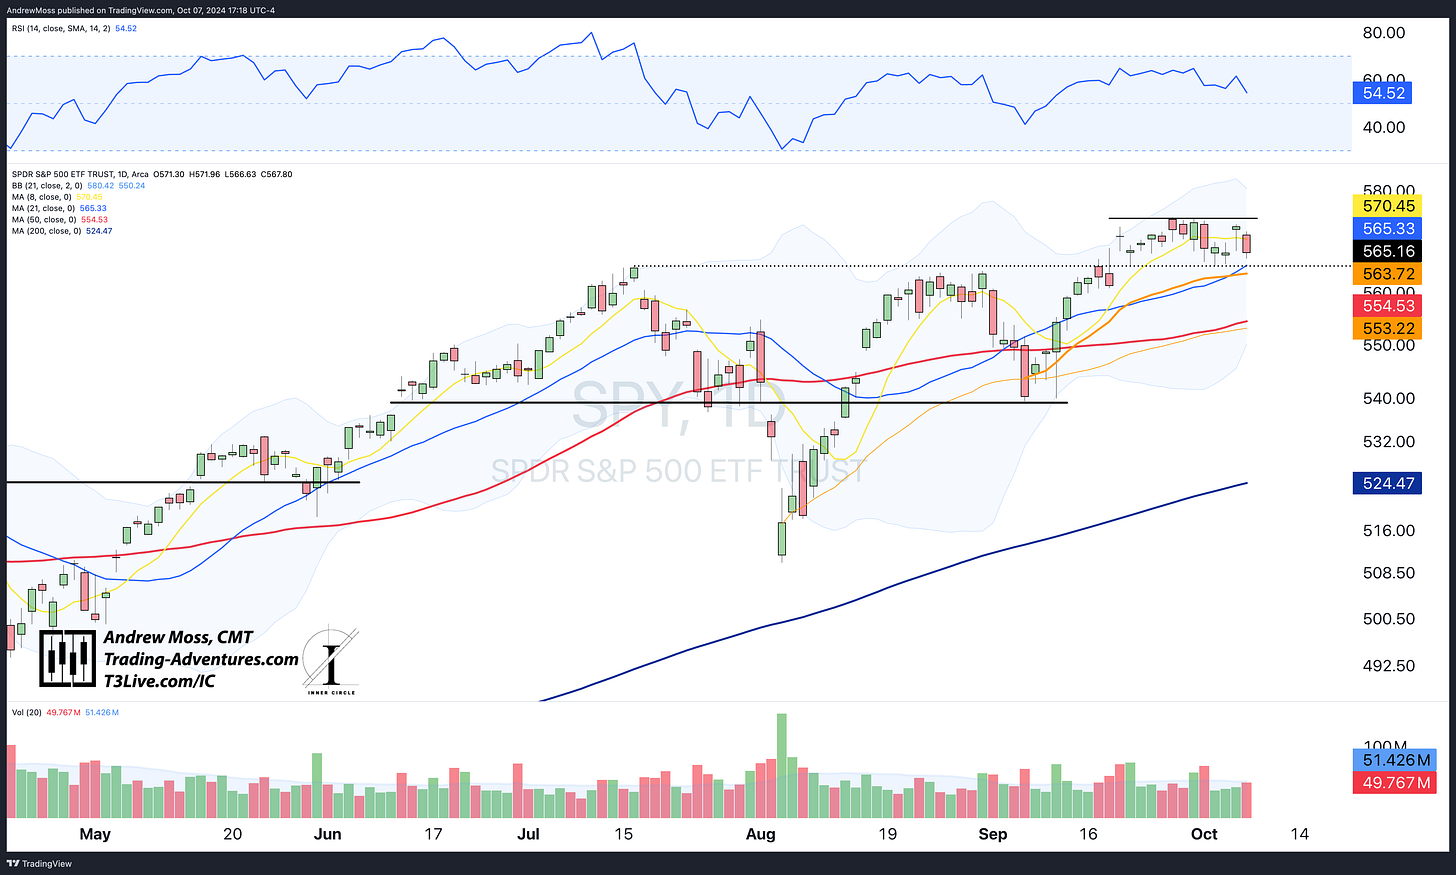
SPY continues in the range bounded by the recent highs above and the 21-day MA and pivot low AVWAP below. Consolidation continues.
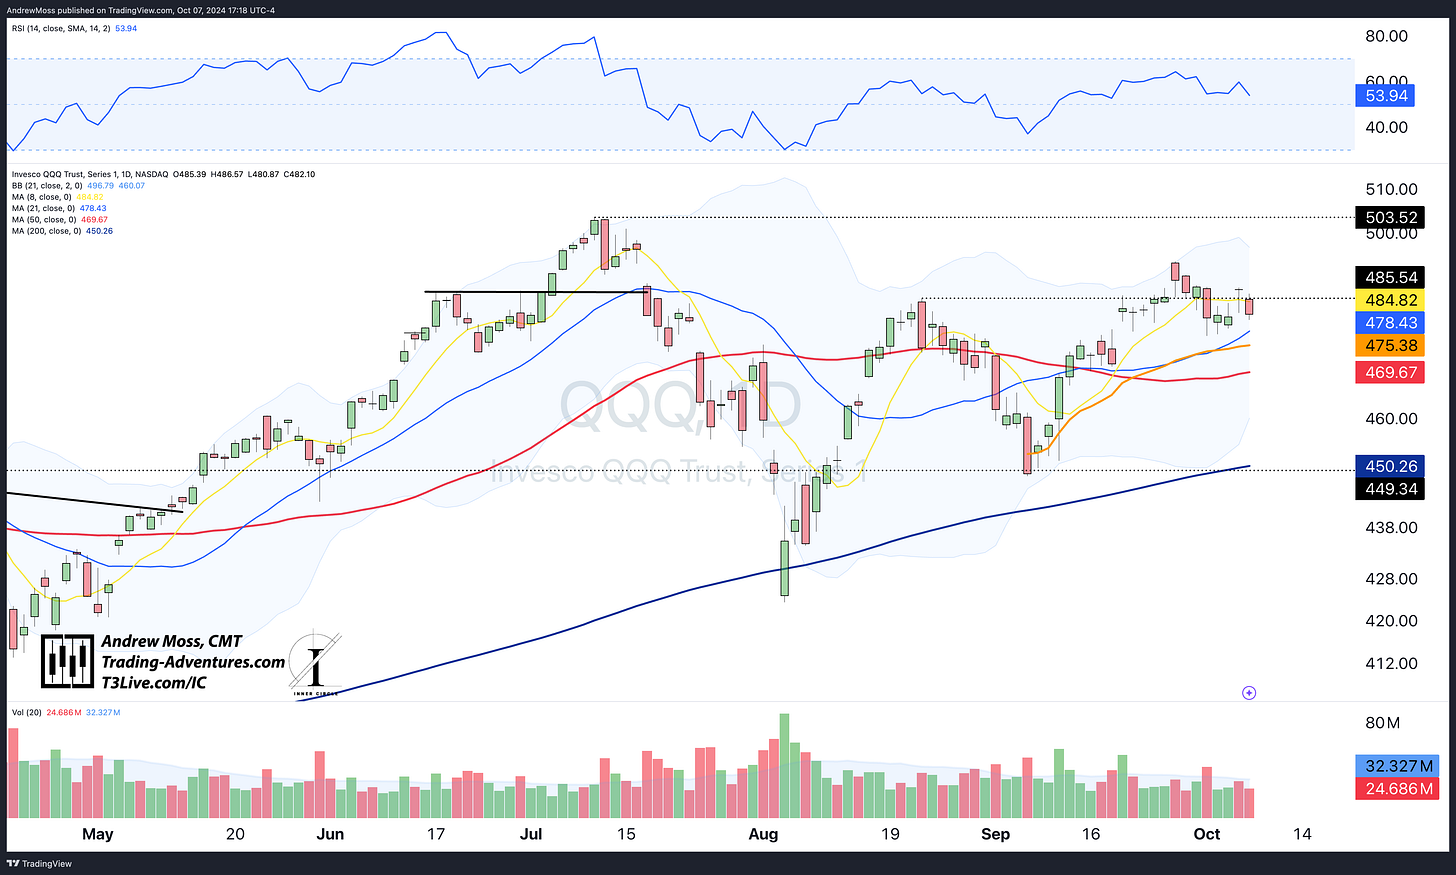
QQQ remains close to the August pivot highs but cannot gain any real traction in one direction. It is also still above the 21-day MA and AVWAP from the pivot lows of September.
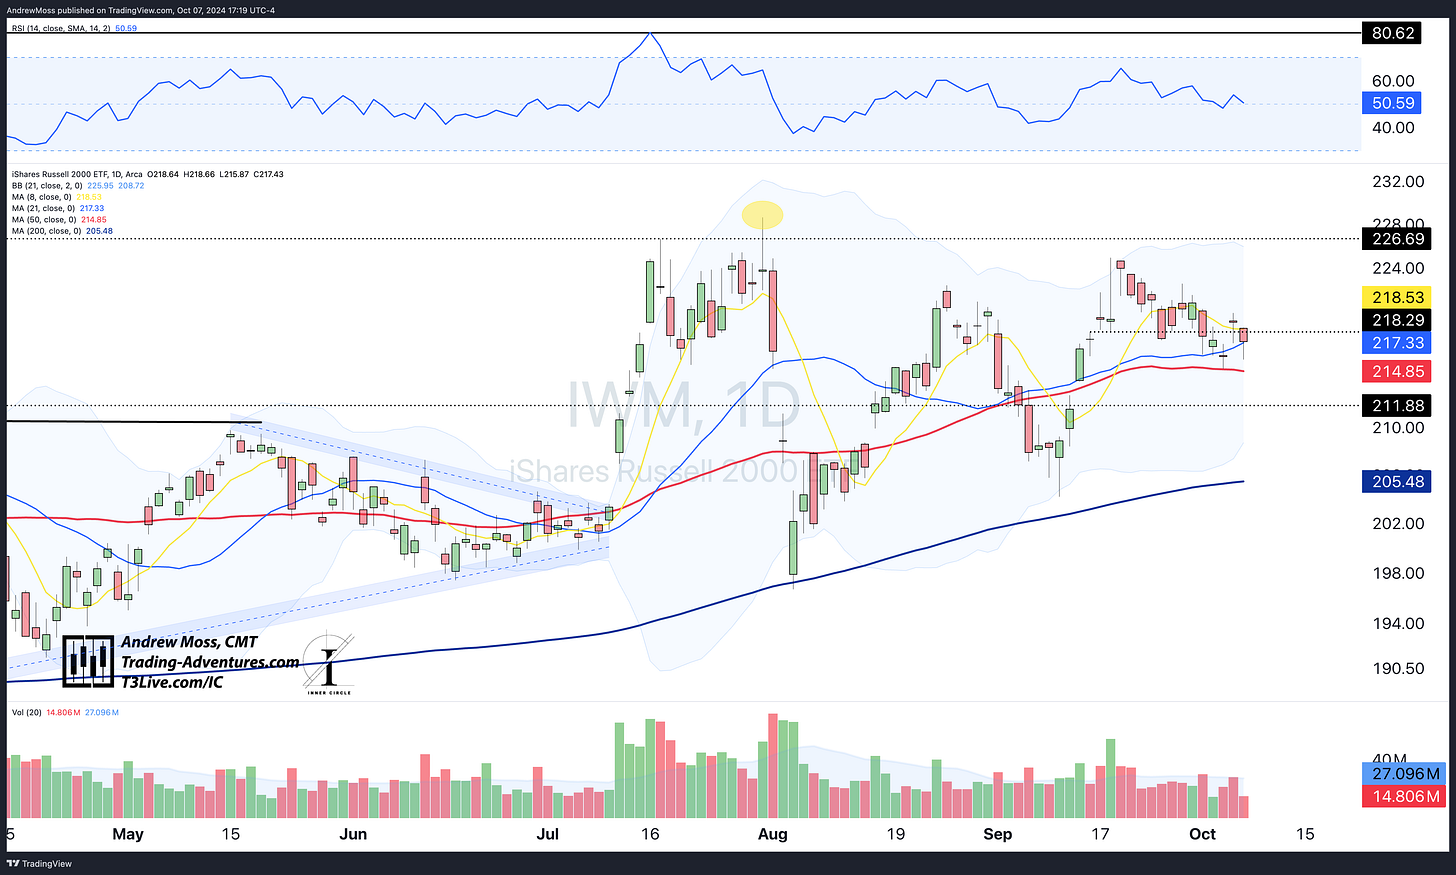
IWM is testing its 21-day MA, managing to close just above there today. The consolidation pattern appears to have a bullish tendency. But as much as small-caps have been prone to misdirection, we’ll have to wait and see how this resolves.
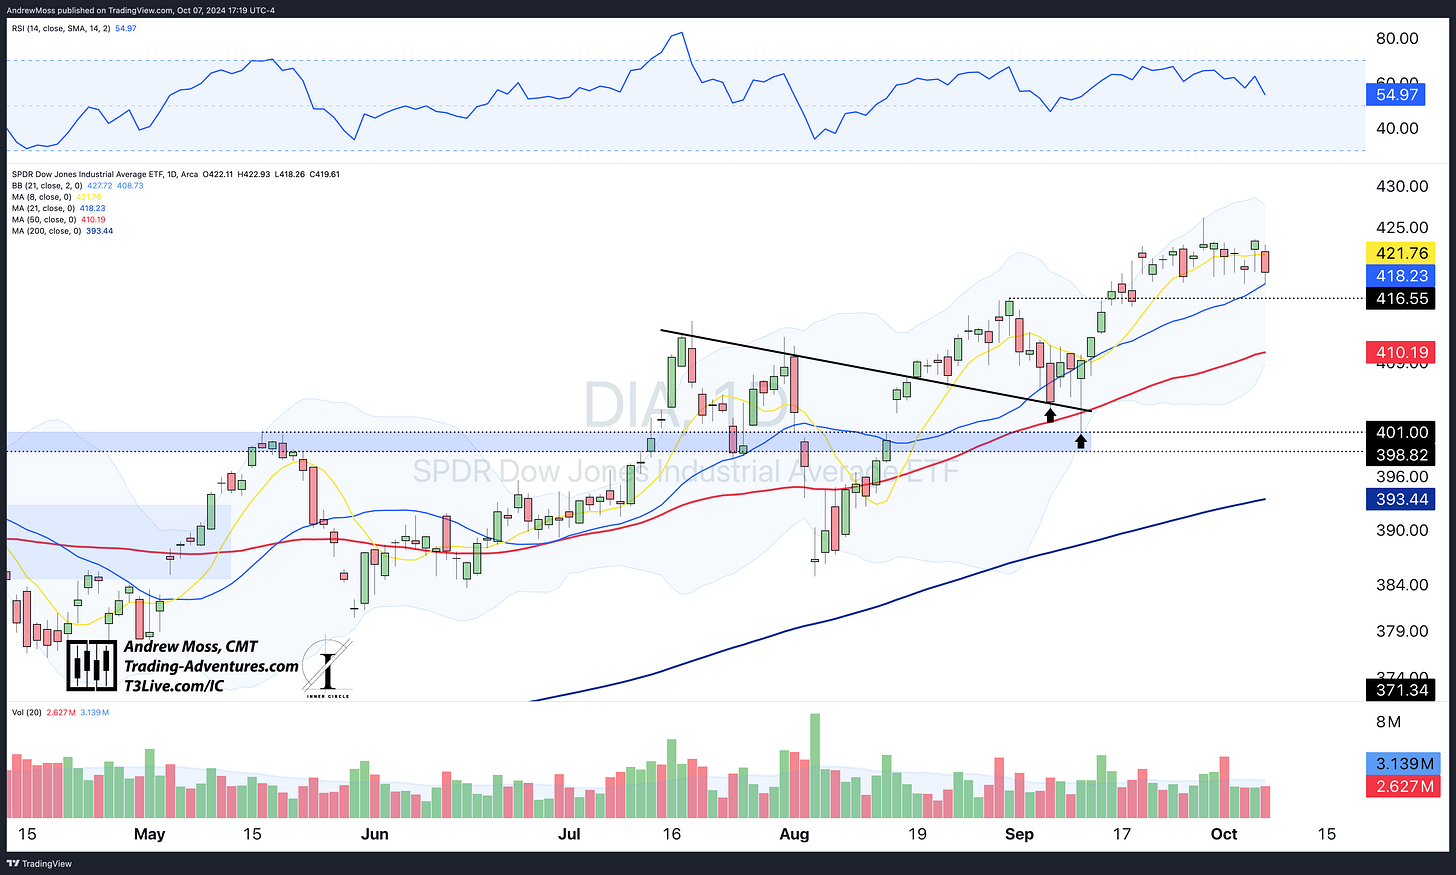
DIA, like the others, is testing its 21-day MA and trying to maintain momentum.
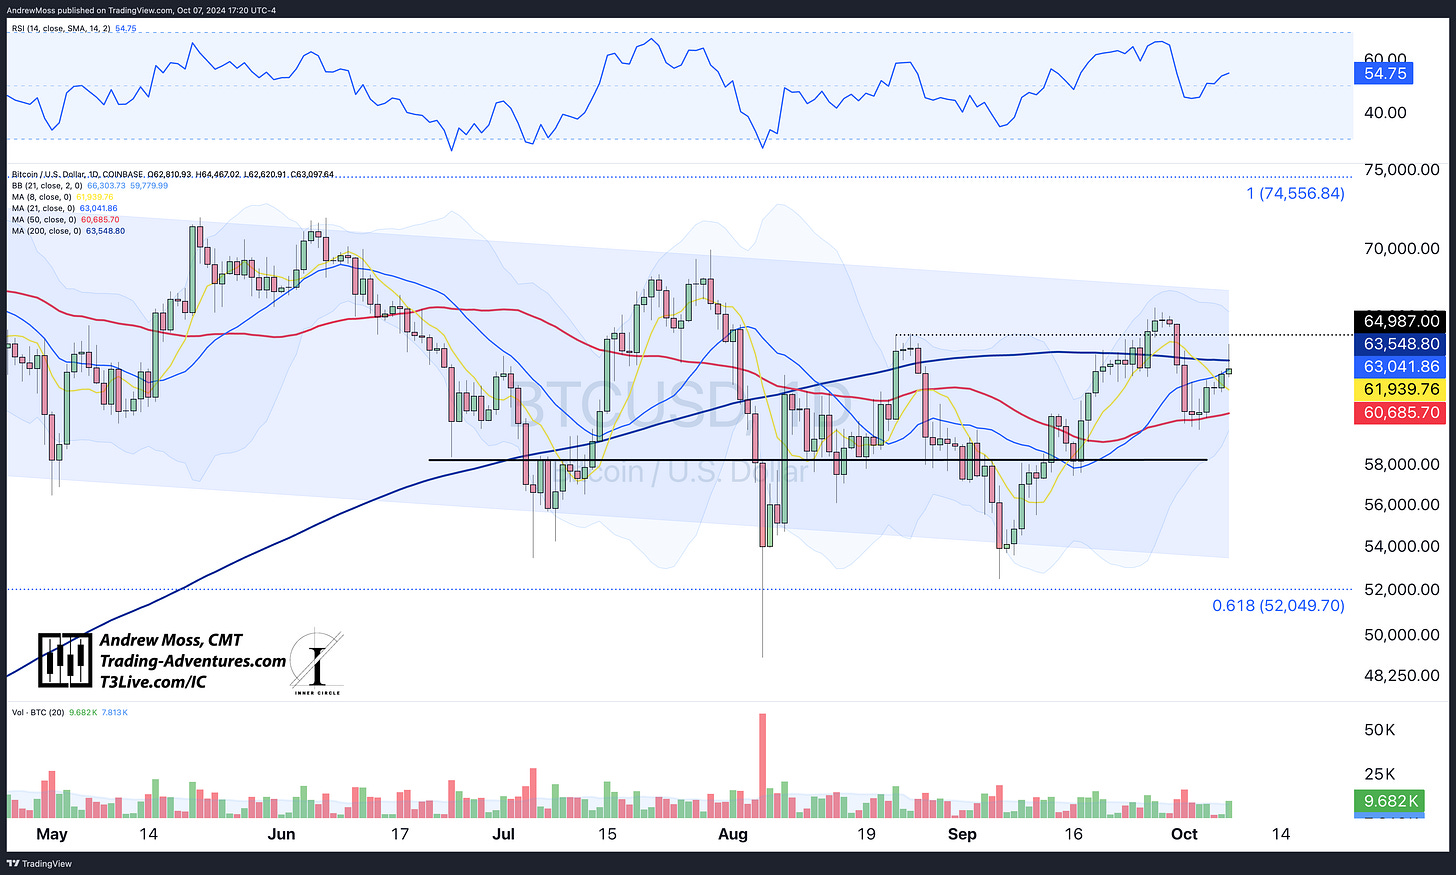
BTCUSD was above its 200-day MA again for a brief time today. Watching for a higher high to follow the recent higher low as an indication of renewed strength and increased potential for a bigger-picture breakout of the long channel.
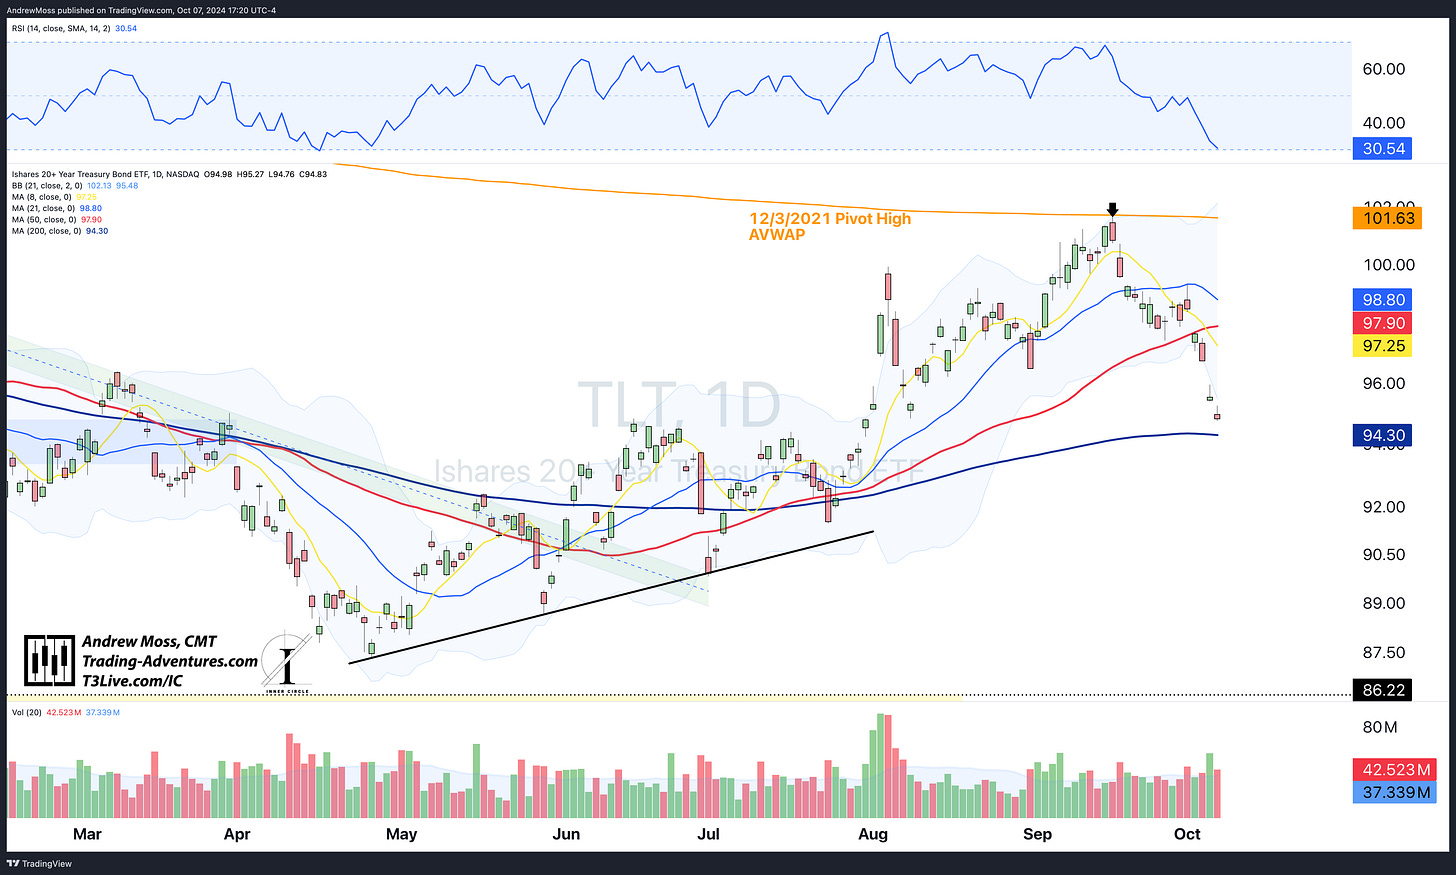
TLT continues to fall, barely able to find support on this recent dip. The 200-day MA is very close now at $94.30.
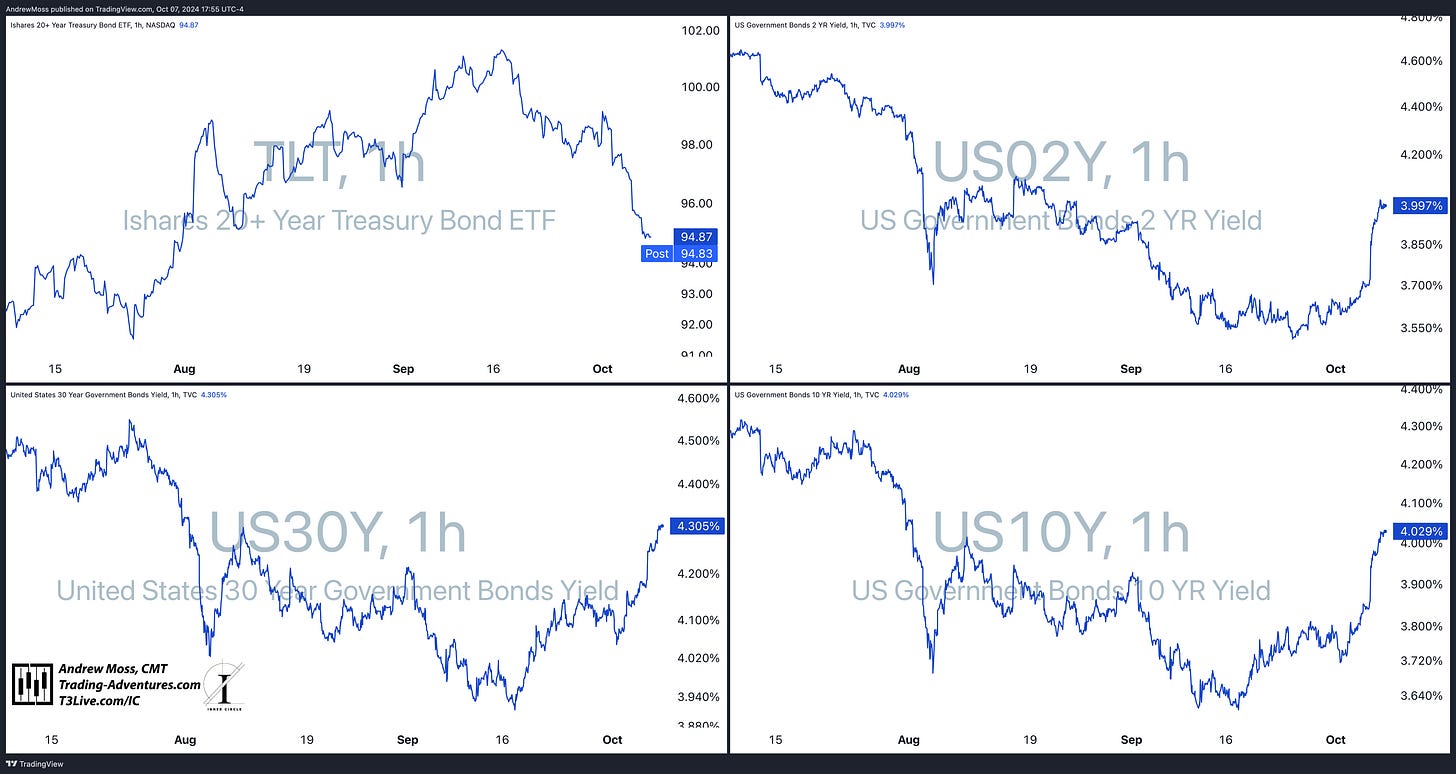
Reminder — bond prices 📉 = bond yields 📈. This chart shows the relationship and recent action of TLT and the 2, 10, and 30-year government bond yields.
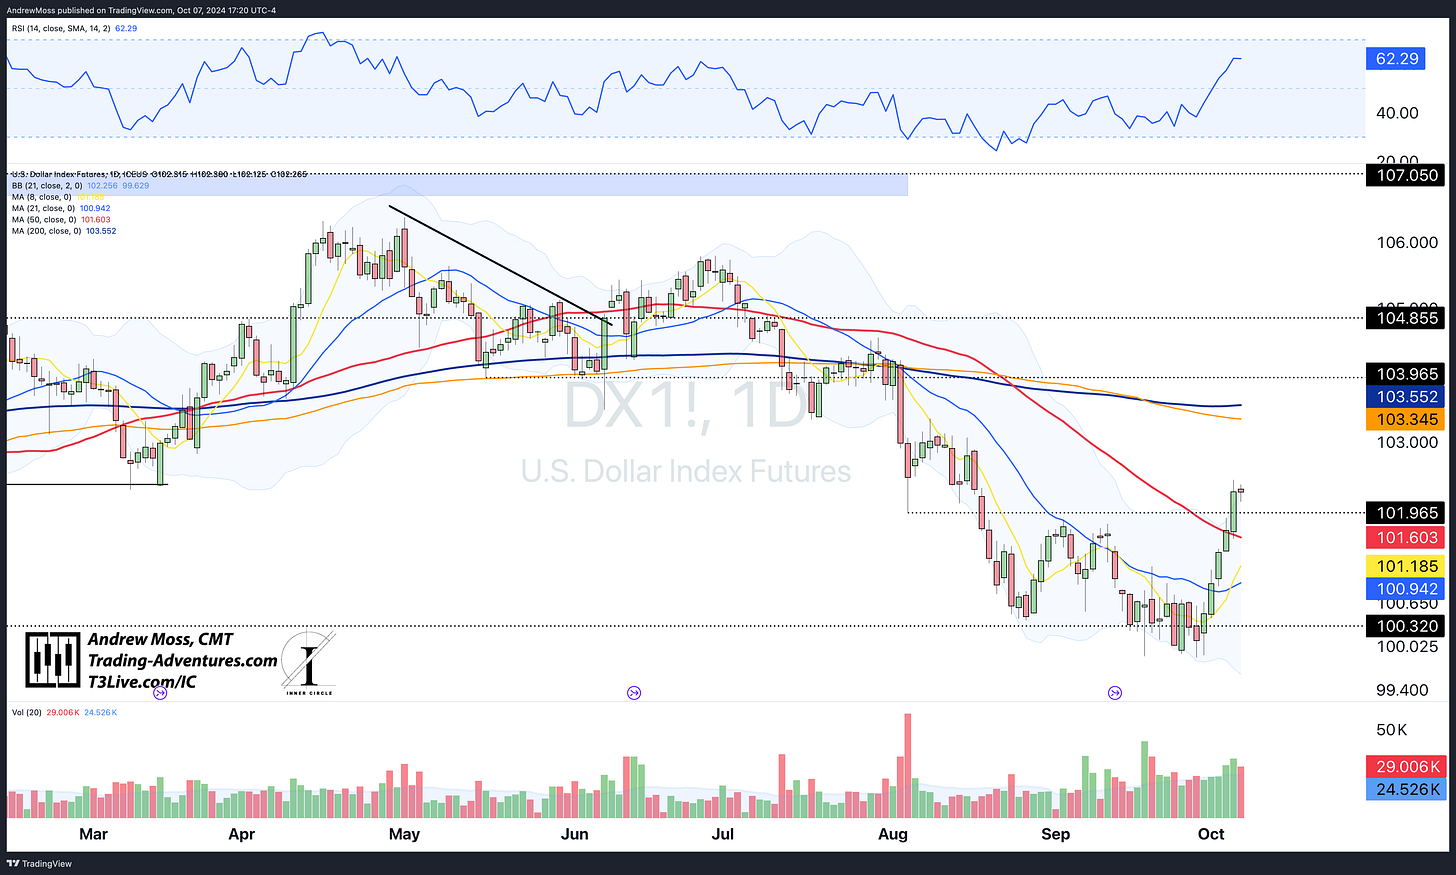
DXY has not provided the tailwind we were watching for, with a dip below the $100.32 pivot. Instead, it has climbed 2.6% in five trading days and is back above the 8, 21, and 50-day MAs.
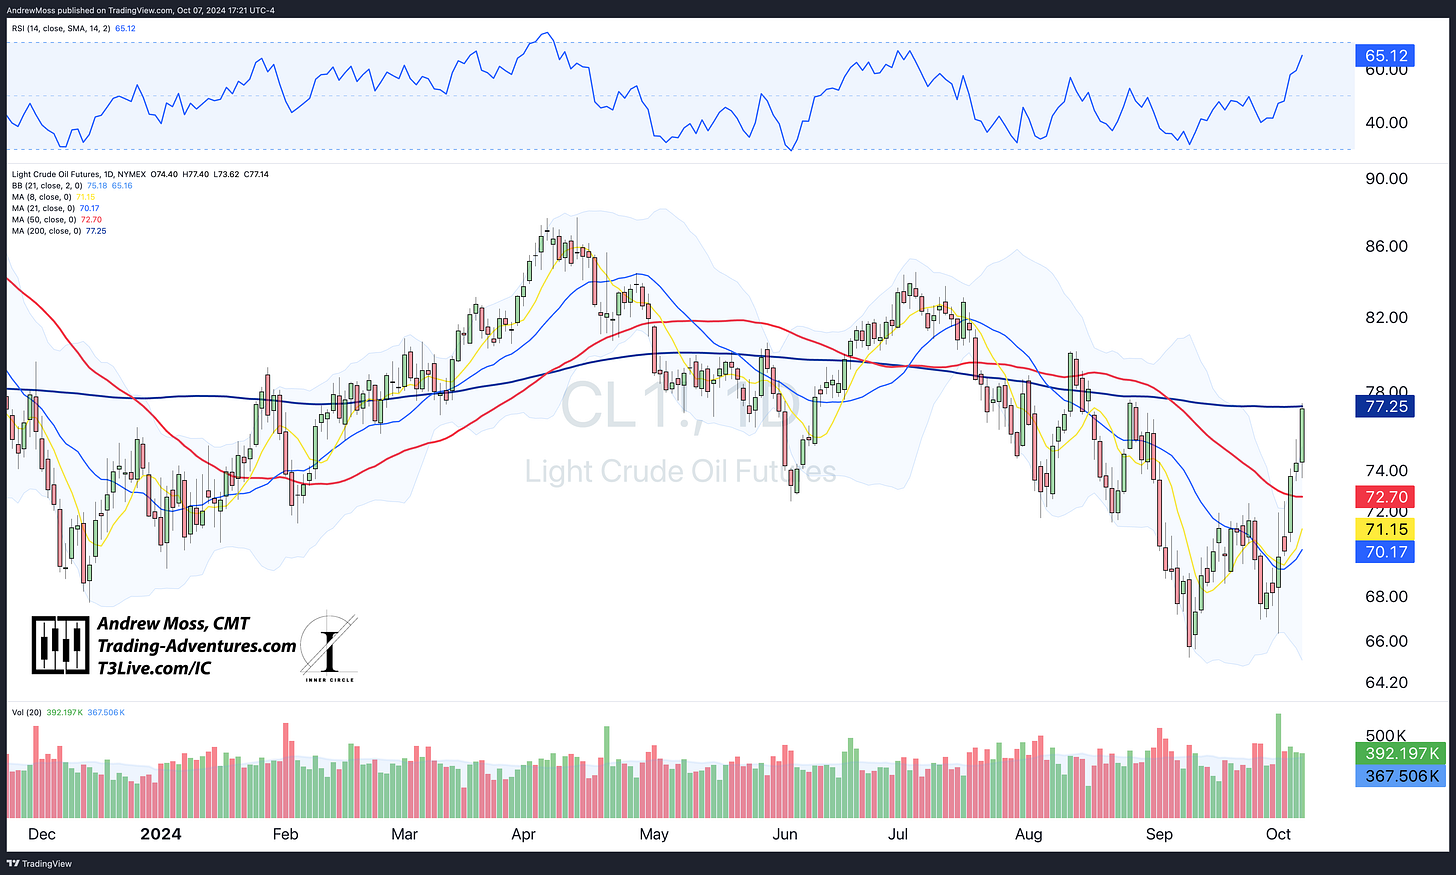
CL/ is worth adding today as some feel its jump is likewise pressuring stocks. Crude oil futures are up almost 20% on this recent move and today touched the 200-day MA. This is a logical spot to watch for resistance, with that moving average and a previous pivot high nearby. Otherwise, we may see a change in character for this commodity.
As the title indicates — Oil is up, Yields are up, and The Dollar is up. Meanwhile, stocks are flat and unable to rise materially beyond the consolidation areas.
What we need to know —
Is this a run-of-the-mill rotation with buying power that would’ve been otherwise used in stocks being soaked up by these other assets?
Or is the market trying to tell us something?
The charts show potential levels of support (in stocks) and resistance (in oil, yields, and the dollar) that could lead to a reversal of these recent moves. If so, great. It’s back to business as usual in the bull market.
If these levels are breached, we’ll need to stay on the lookout for bigger changes.
To be determined.
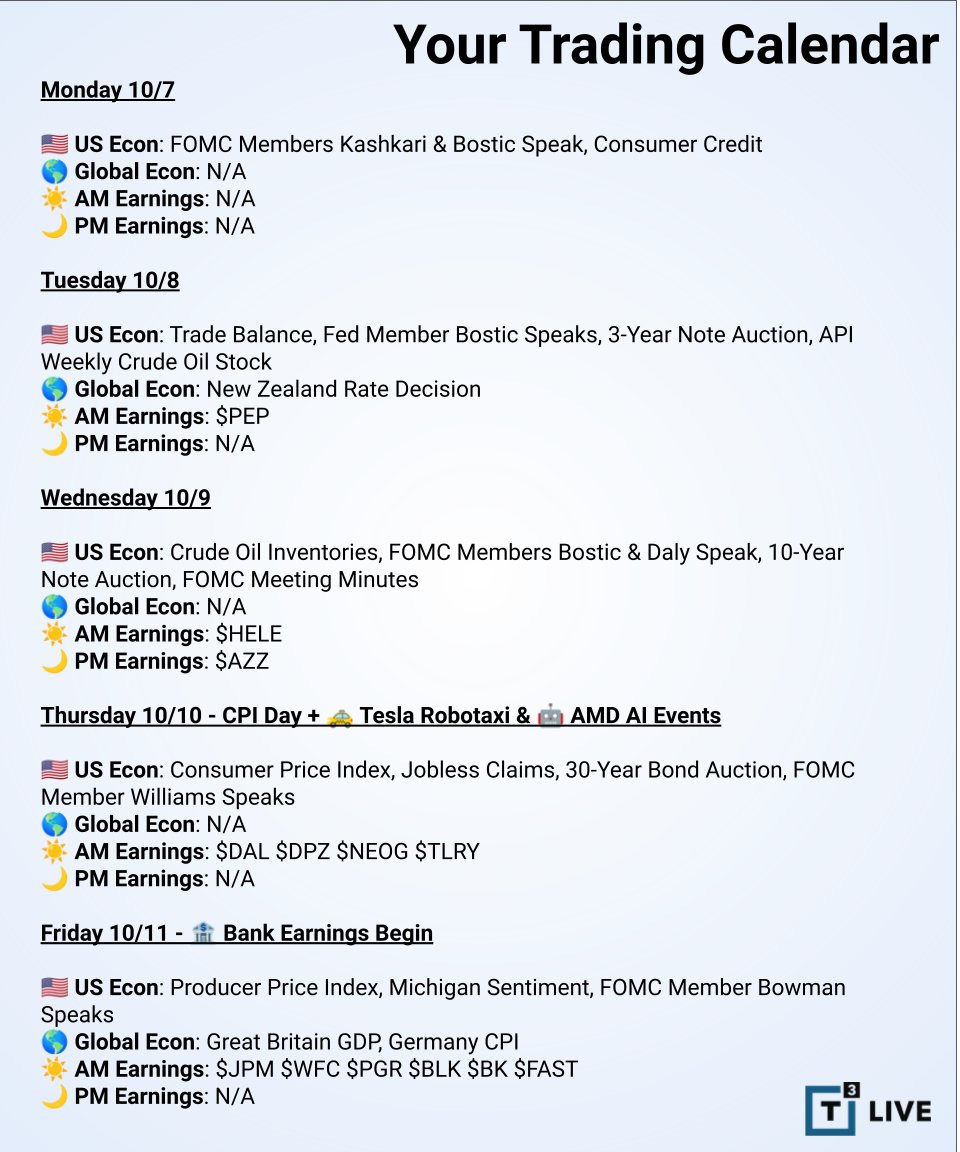
As a reminder, we have many potential market-moving events on the calendar this week: Fed speakers, CPI, PPI, and banks will kick off the earnings season.
Stocks are in a short/medium-term middle ground, and we’ll keep the shopping lists fresh to seize any attractive dip-buying opportunities.
Be patient but alert.
Elevate Your Trading
Education, training, and support for your Trading Adventure.
Options Trades - Weekly trade ideas are delivered to your email or text messages in language you can easily understand.
Check out EpicTrades from David Prince and T3 Live. Epic Trades from David Prince
Community - Are you an experienced trader seeking a community of professionals sharing ideas and tactics? Visit The Inner Circle, T3 Live’s most exclusive trading room - designed for elite, experienced traders.
The Inner Circle at T3 Live
Prop Trading - Or perhaps you are tested and ready to explore a career as a professional proprietary trader? 3 Trading Group has the technology and resources you need.
Click here to start the conversation:
T3TradingGroup.com
The Disclosures
***This is NOT financial advice. This is NOT a recommendation to buy, sell, or trade any security. The content presented here is intended for educational purposes only.


