

One Down, One To Go
Market Update August 24, 2023
The Markets
NVDA wins again! Earnings and guidance beat expectations and the stock soared after hours before profit-taking sent it lower mid-day.
The rest of the market moved lower as well and a ‘risk-off’ mood spread throughout the day. That is likely due to apprehension about what Jerome Powell may say tomorrow in Jackson Hole. Last year his comments sent the SP 500 lower by more than 3%.
Is he hawkish, stern, and cautionary? Or does he lighten his tone on inflation a bit and suggest that we’re closer to the end of the rate hike cycle?
He is scheduled to speak at 10:05 a.m. Eastern tomorrow. So we will know soon enough.
On to the bigger picture.
The Charts
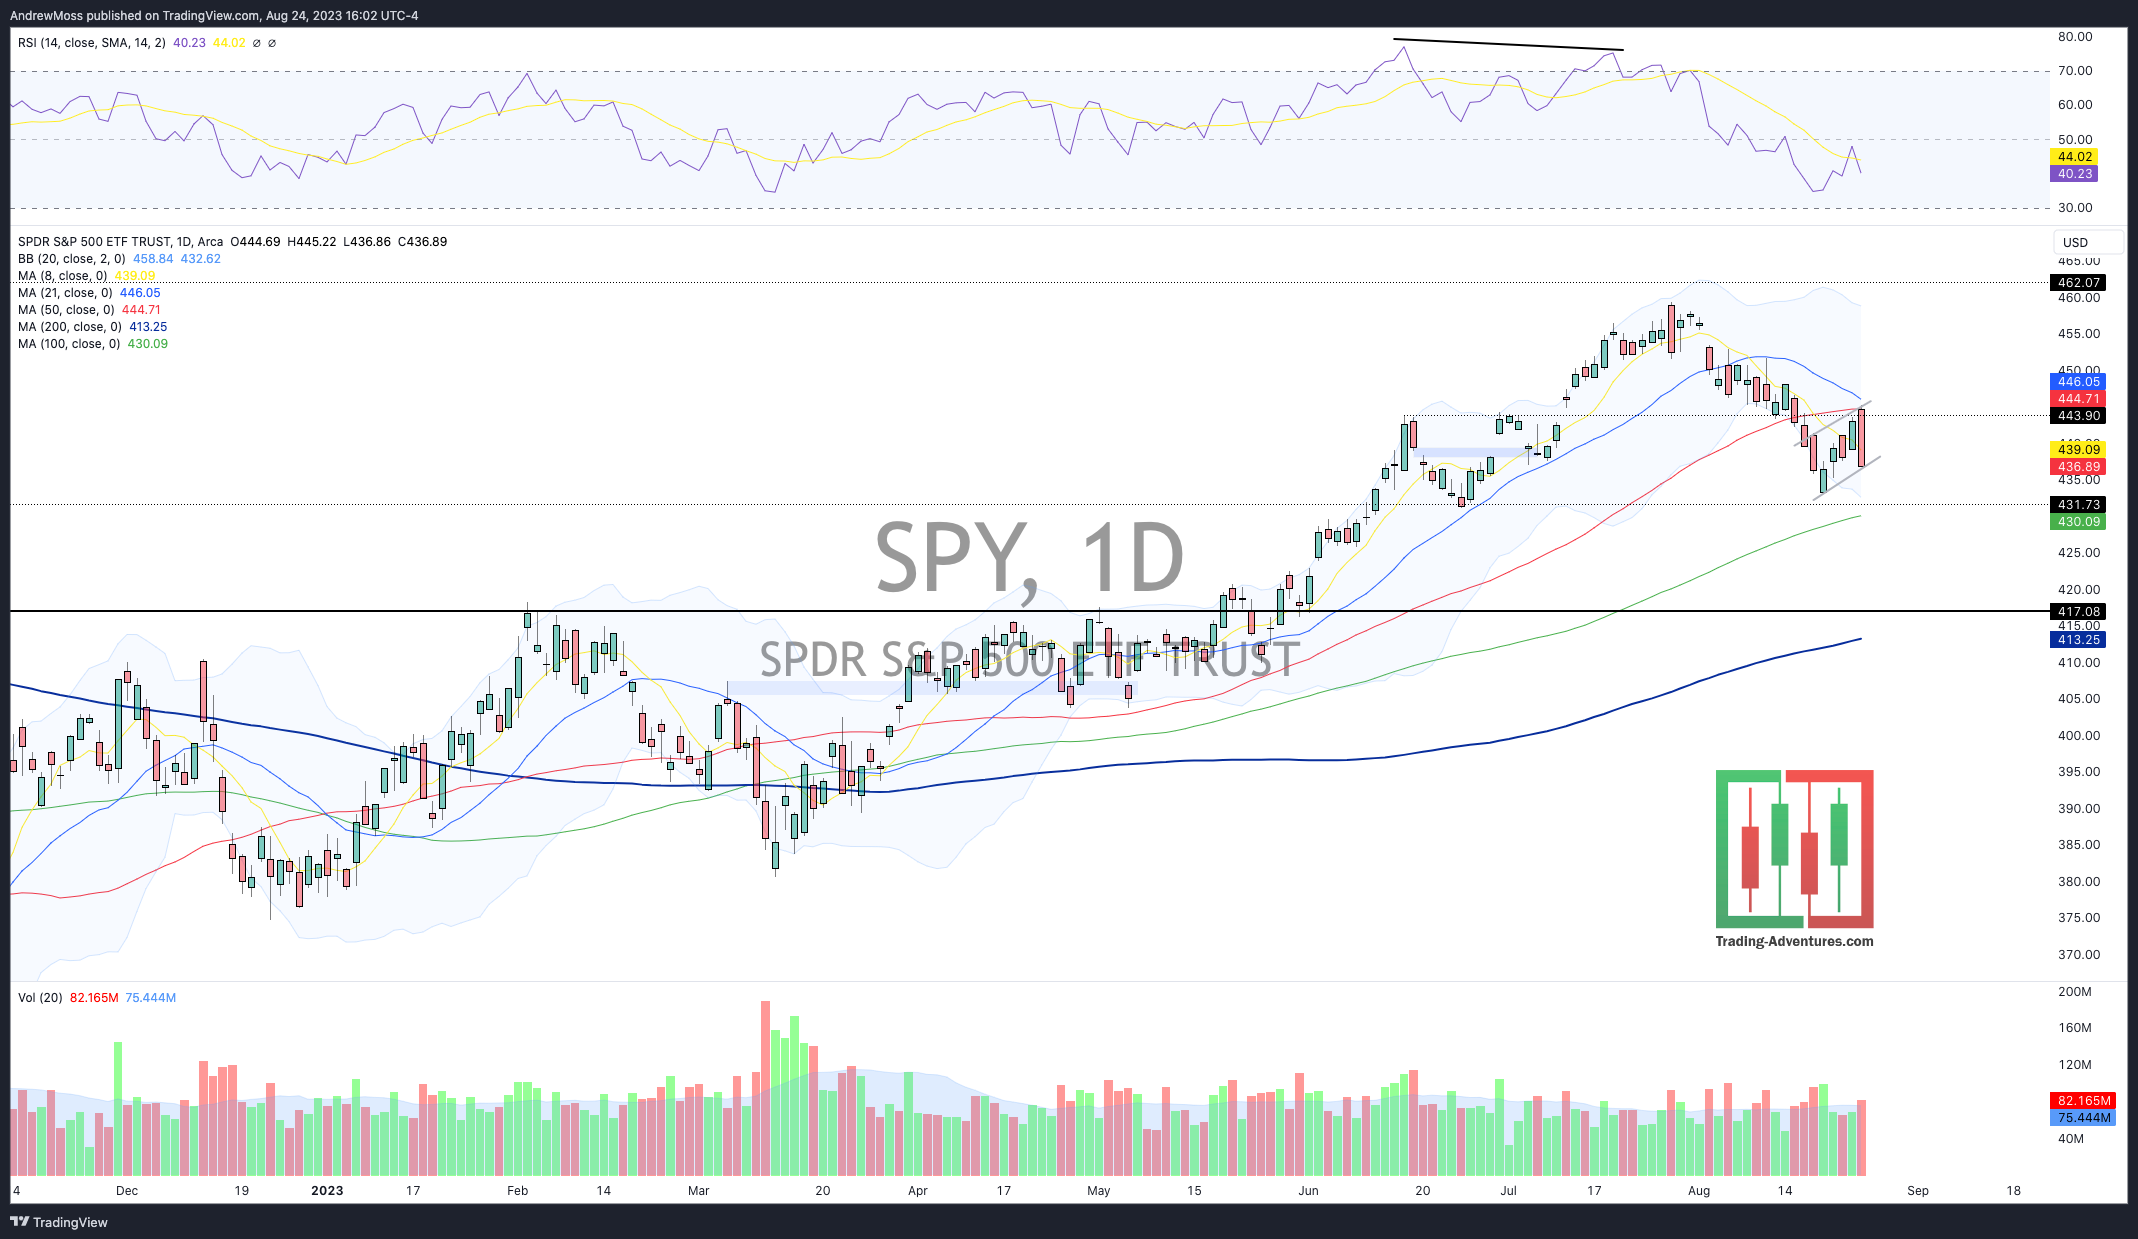
SPY put in a nasty red candle after opening at the 50-day MA. It hasn’t yet definitively signaled that this bounce is over. But there is a potential bear flag forming. If that pattern is confirmed then a move down to the 100-day MA, and lower could be likely.
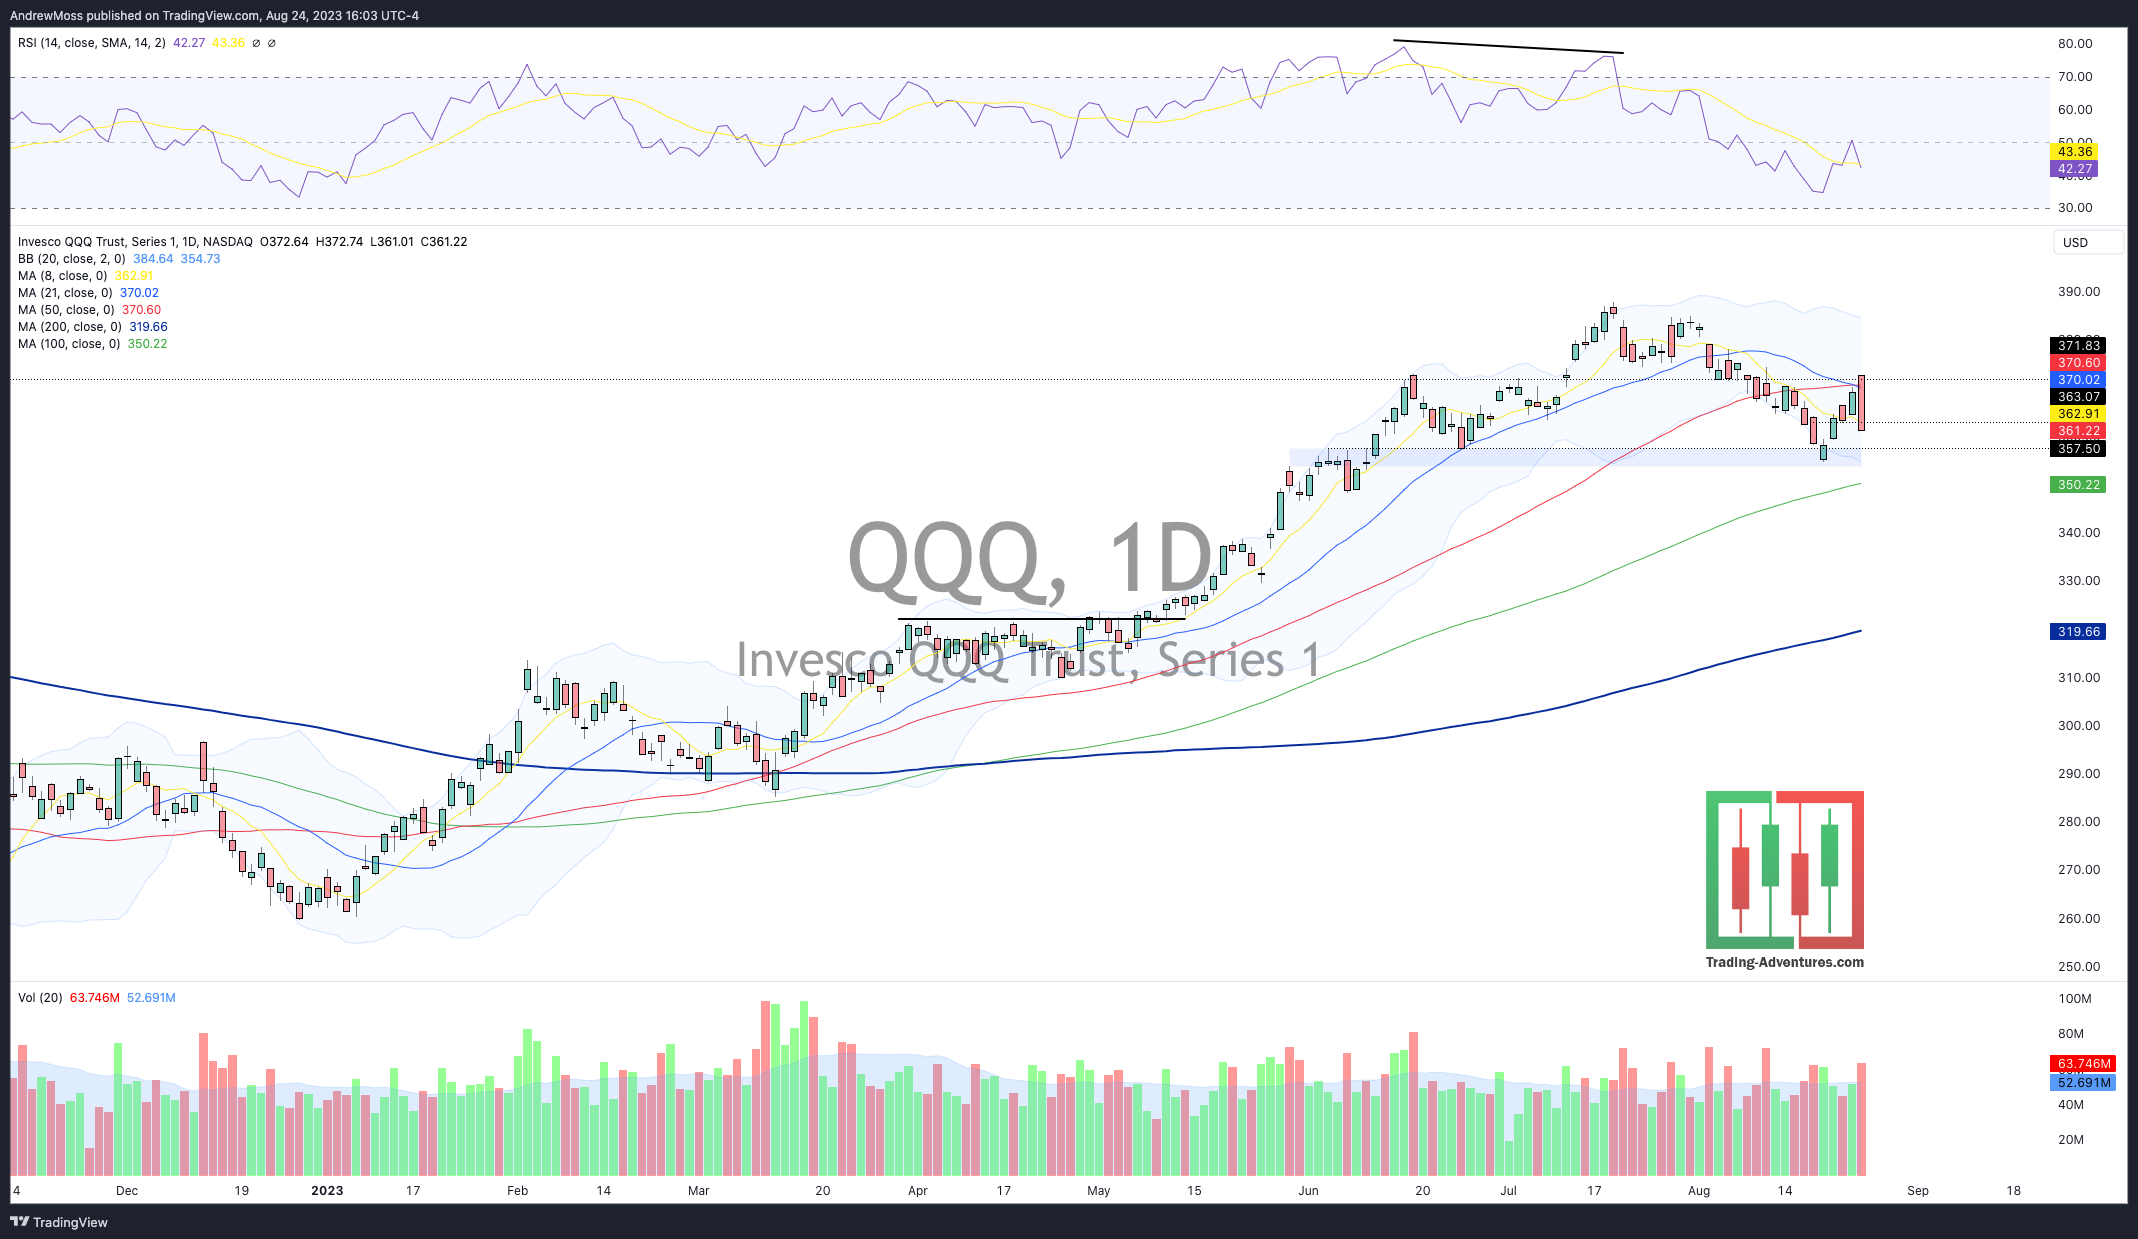
QQQ price action and chart are essentially the same as SPY with the exception that it opened above the 21 and 50-day MAs. A potential bear flag pattern is evident here as well, which if confirmed, would likely send prices much lower. There is a potential support zone at $354-357.
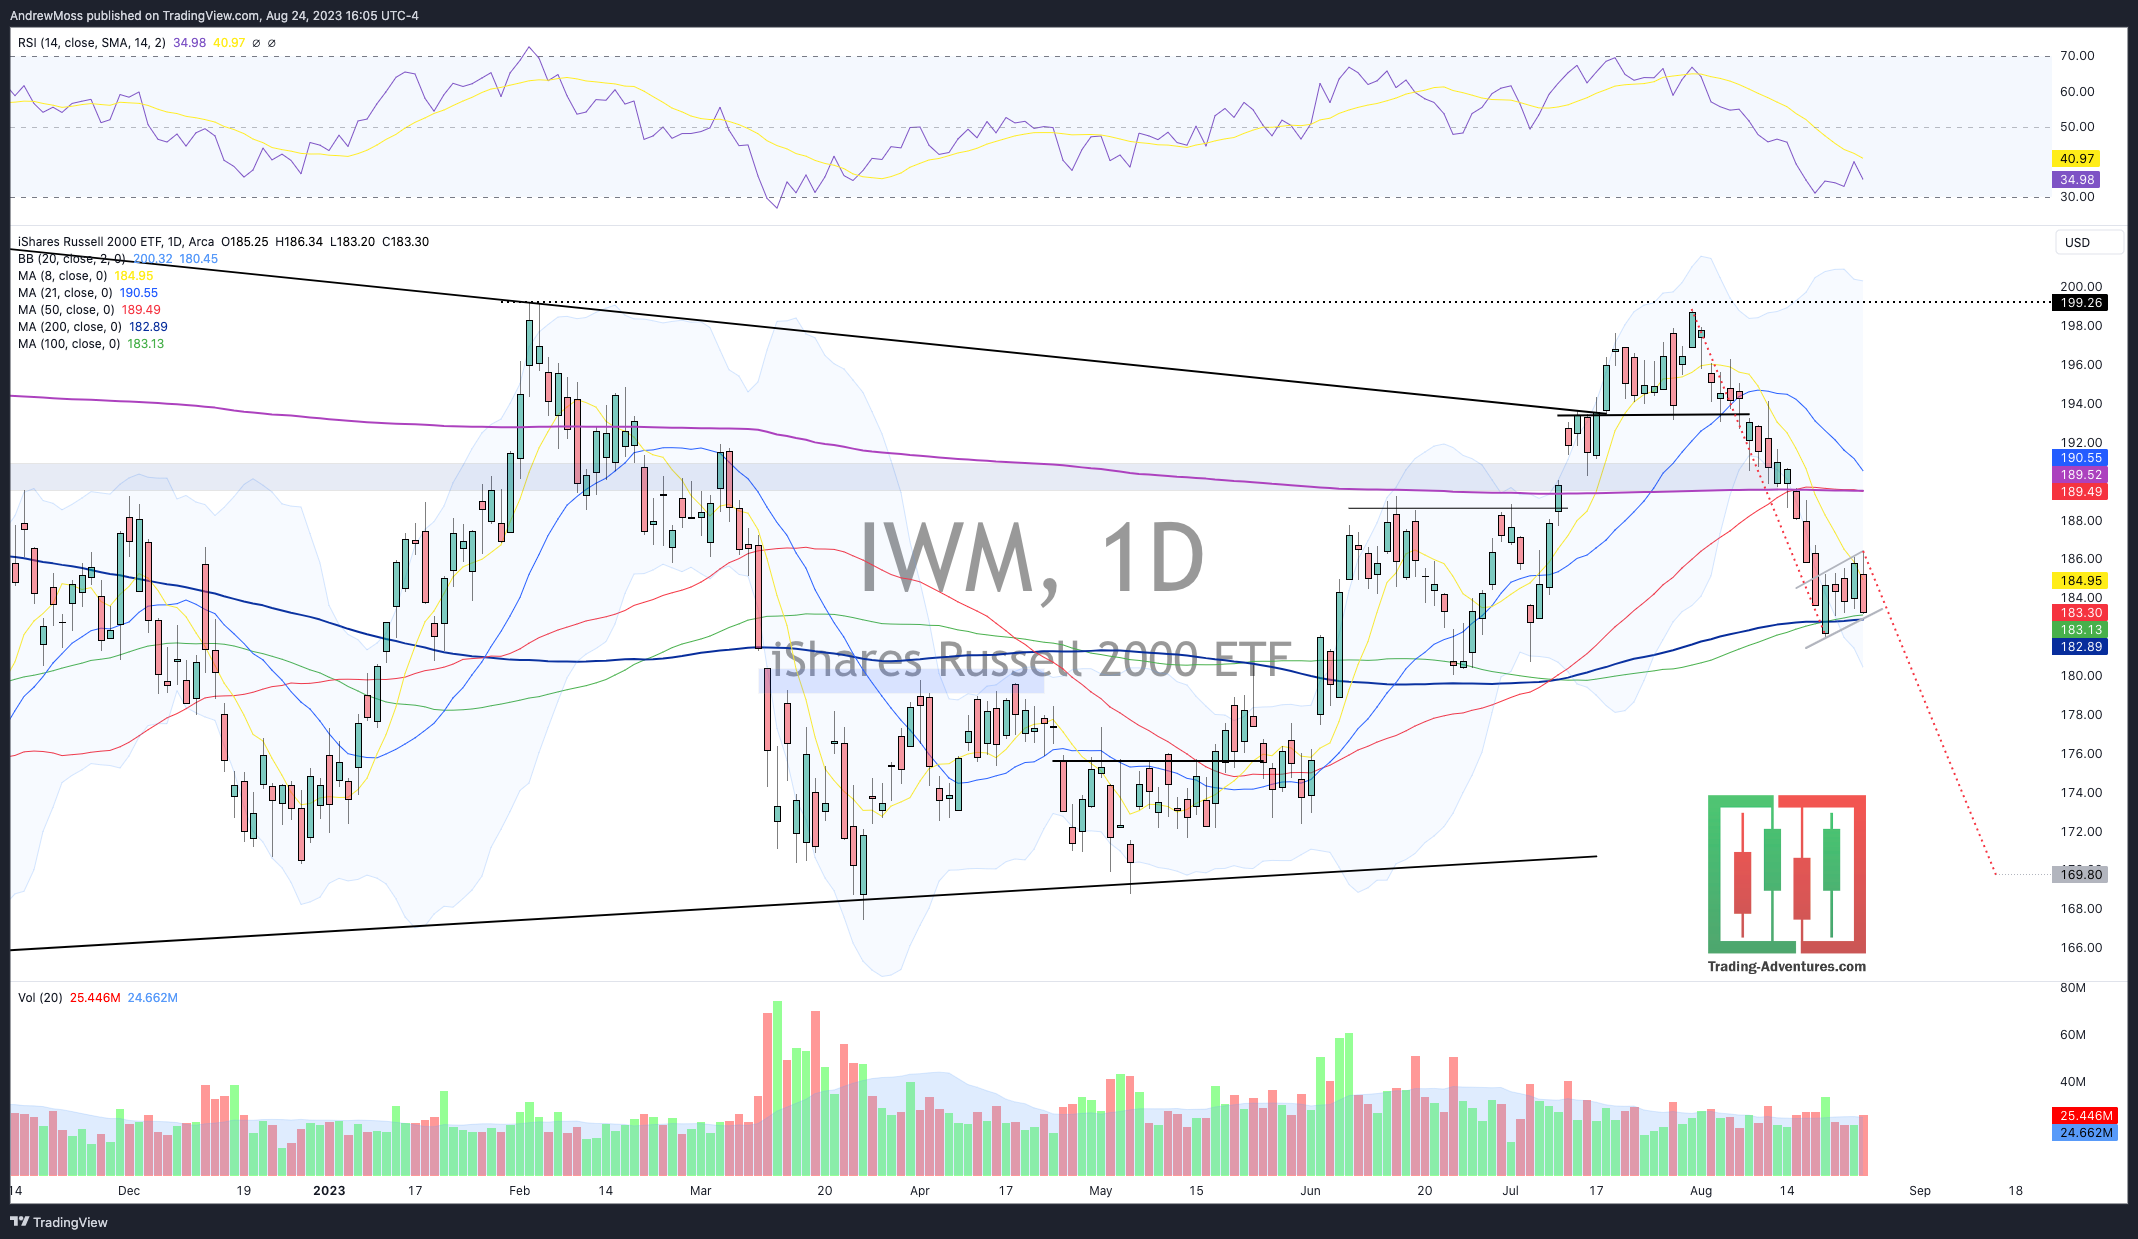
IWM is trying very hard to remain above the 100 and 200-day MAs. Once again, a bear flag pattern is forming. A break lower would have a measured move price objective near $170.
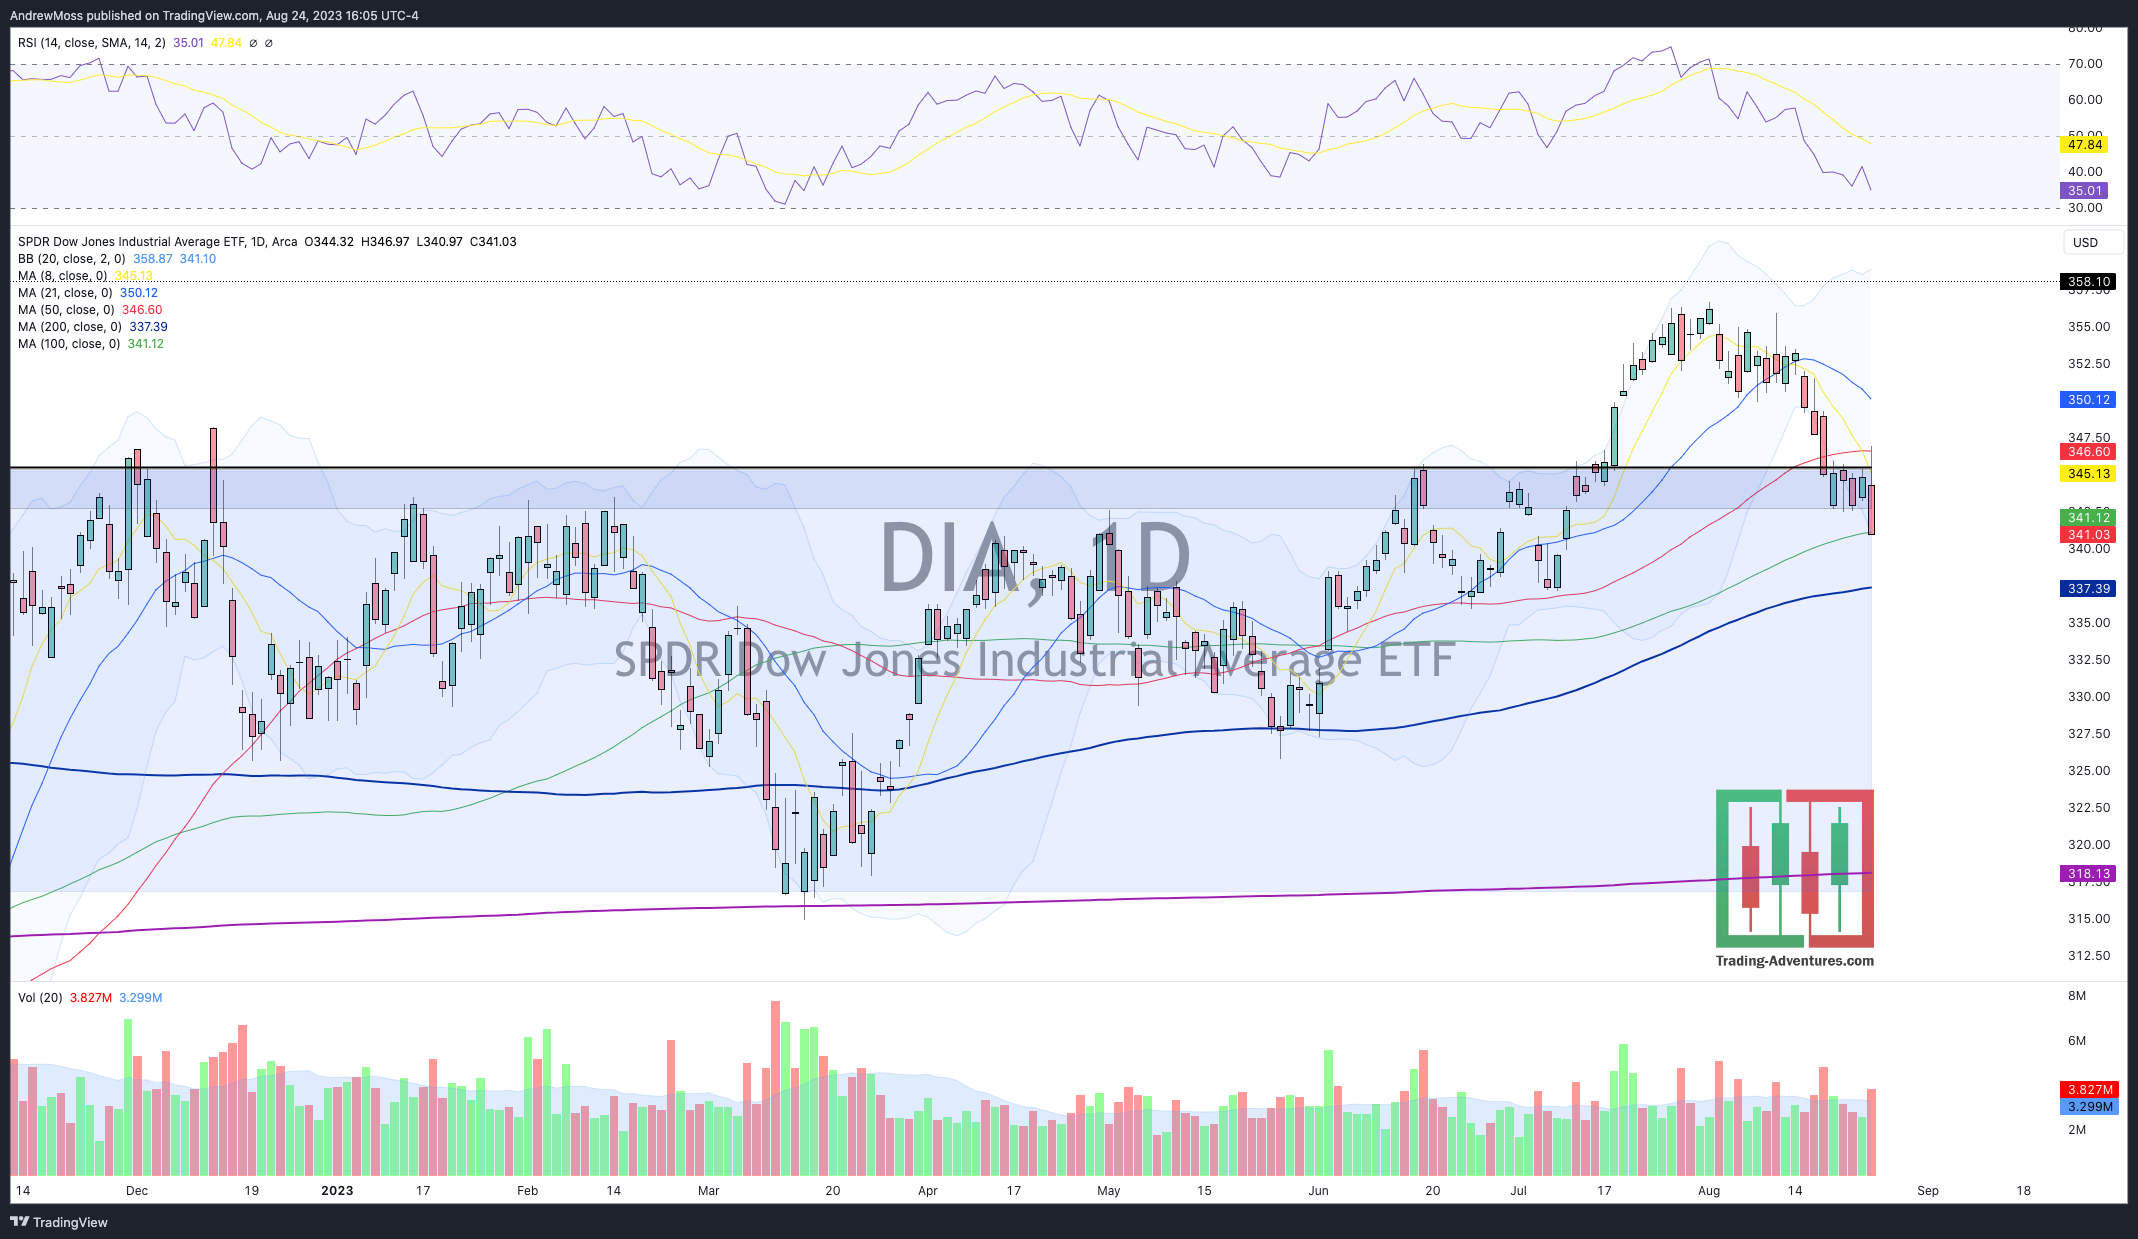
DIA is back in the wide, yearly range, below recent lows, and looking more and more like the mid-July to mid-August rally was a failed breakout. It closed just beneath the 100-day MA and has a bear flag in play. Caution.
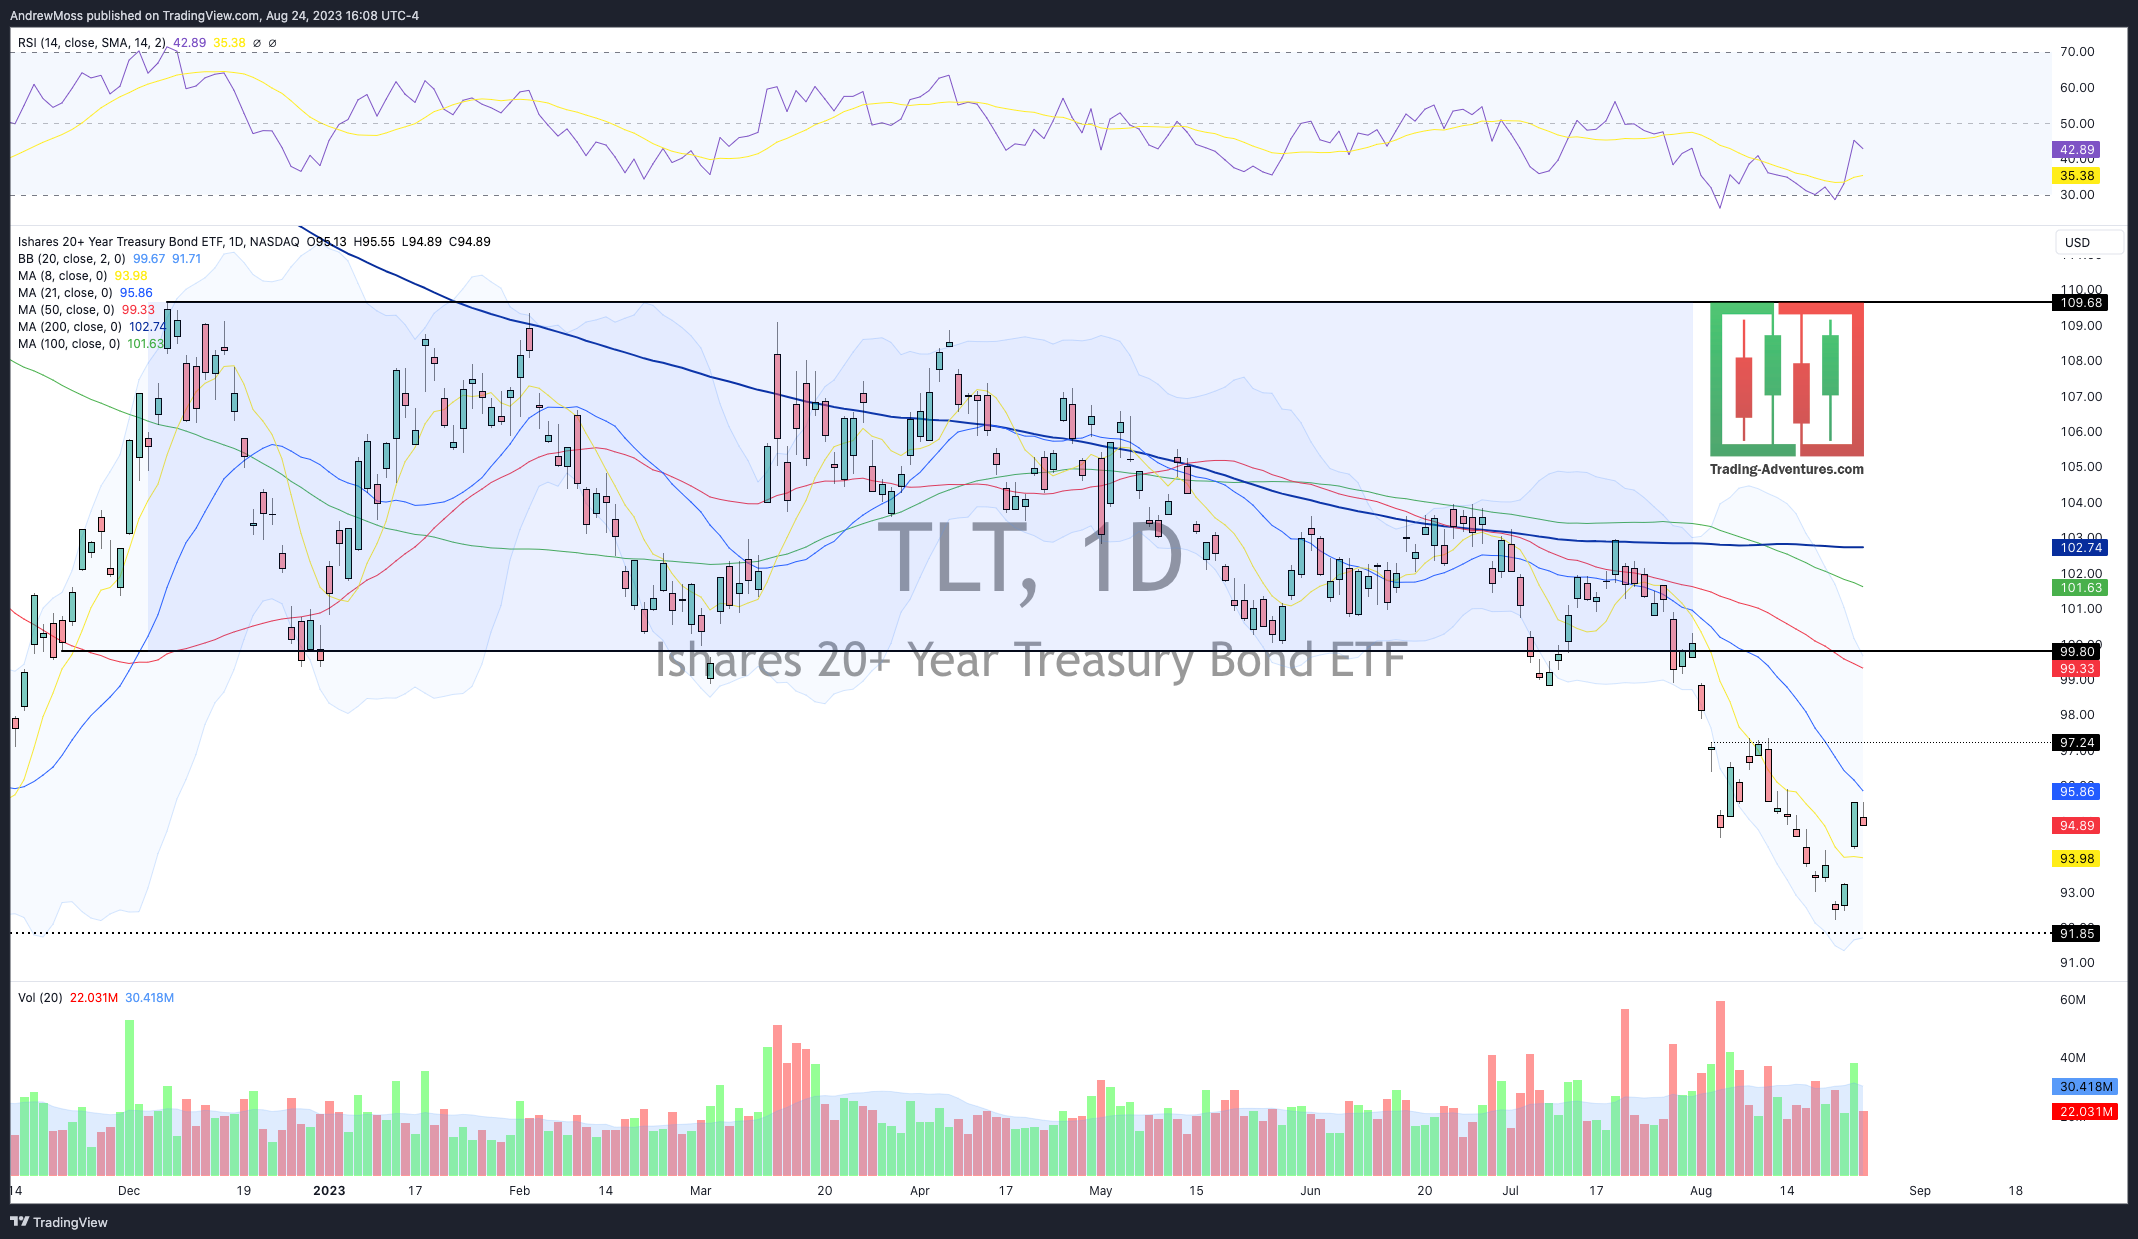
TLT Bonds were able to bounce from weekly support and, while lower today, appear to be holding up okay. Next overhead is the 21-day MA at $95.86 and a pivot level near $97.
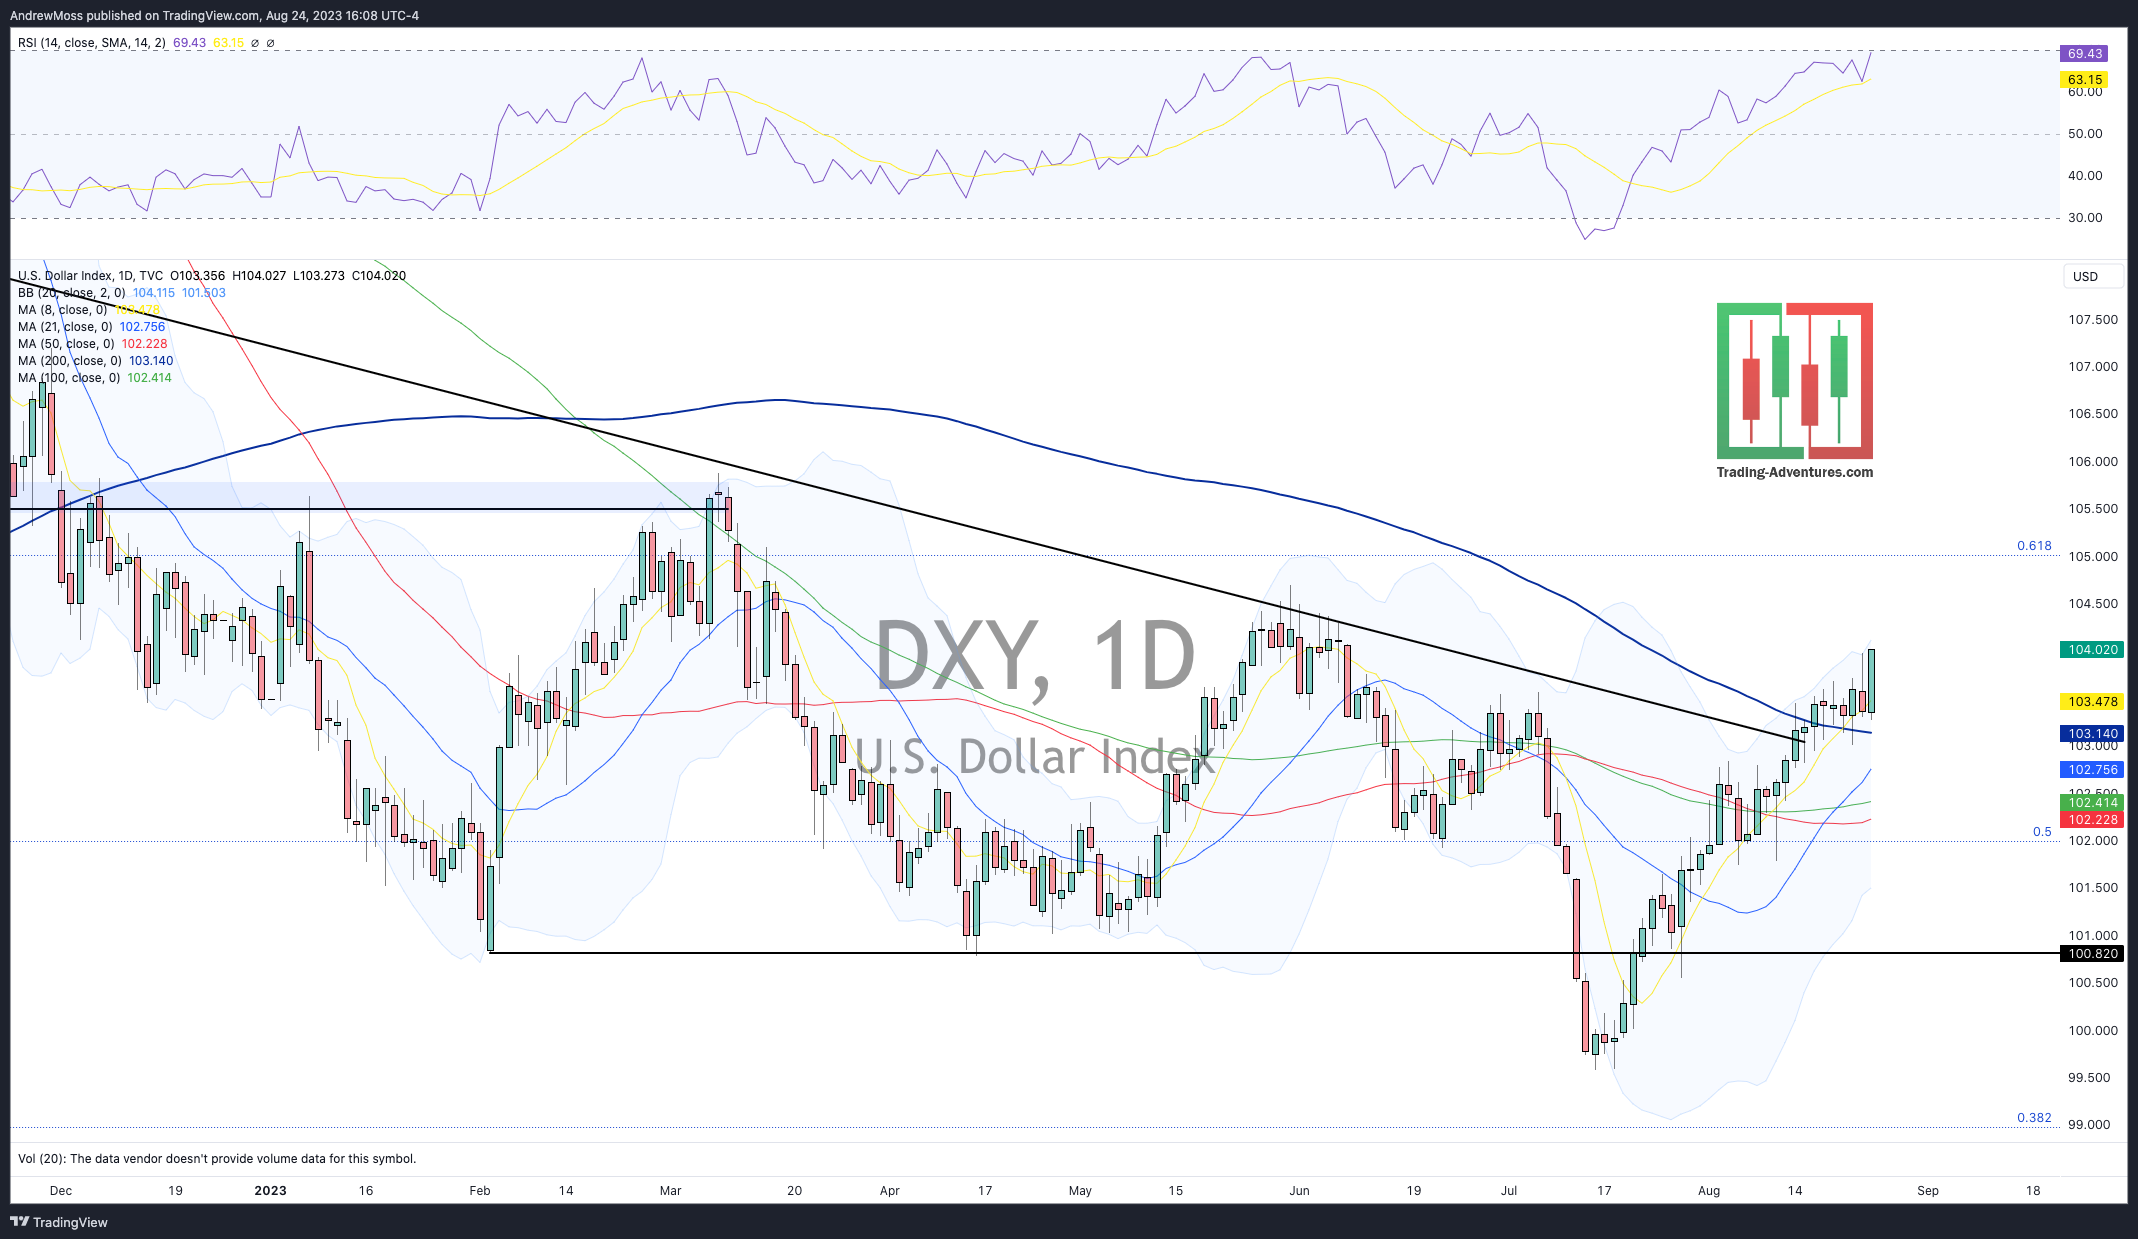
DXY The Dollar continues to move higher after spending a few days consolidating above the trendline and 200-day MA. Continued headwind for stocks.
The Closing Bell
One more bonus chart.
One of the shorter-term indicators mentioned here is the 5-day MA.
After a failed attempt on Tuesday SPY moved higher again on Wednesday and above the 5-day MA. A potential indicator that the turn could persist.
Now today’s action has both SPY and QQQ back below that level. Tricky environment.
Near-term caution is still warranted.
30m chart. 5-day MA is the blue line
Last thing.
I hope you are adjusting well to the new schedule. Saturday Morning Weekly Charts will stay the same. If you have questions or comments, hit the button, or simply reply if you’re reading this in email.
Weekly Charts Here https://twitter.com/Andy__Moss
Tell a friend.
The Disclosures
***This is NOT financial advice. NOT a recommendation to buy, sell, or trade any security. The content presented here is intended for educational purposes only.
Andrew Moss is an associated member of T3 Trading Group, LLC (“T3TG”) a SEC registered broker/dealer and member of FINRA/SIPC. All trades placed by Mr. Moss are done through T3TG.
Statements in this article represent the opinions of that person only and do not necessarily reflect the opinions of T3TG or any other person associated with T3TG.
It is possible that Mr. Moss may hold an investment position (or may be contemplating holding an investment position) that is inconsistent with the information provided or the opinion being expressed. This may reflect the financial or other circumstances of the individual or it may reflect some other consideration. Readers of this article should take this into account when evaluating the information provided or the opinions being expressed.
All investments are subject to the risk of loss, which you should consider in making any investment decisions. Readers of this article should consult with their financial advisors, attorneys, accountants, or other qualified investors prior to making any investment decision.
POSITION DISCLOSURE
August 24, 2023, 4:00 PM
Long:
Short:
Options symbols are denoted as follows:
Ticker, Date, Call/Put, Strike Price
Example: VXX1218C30 = VXX 12/18 Call with a $30 strike