The Markets
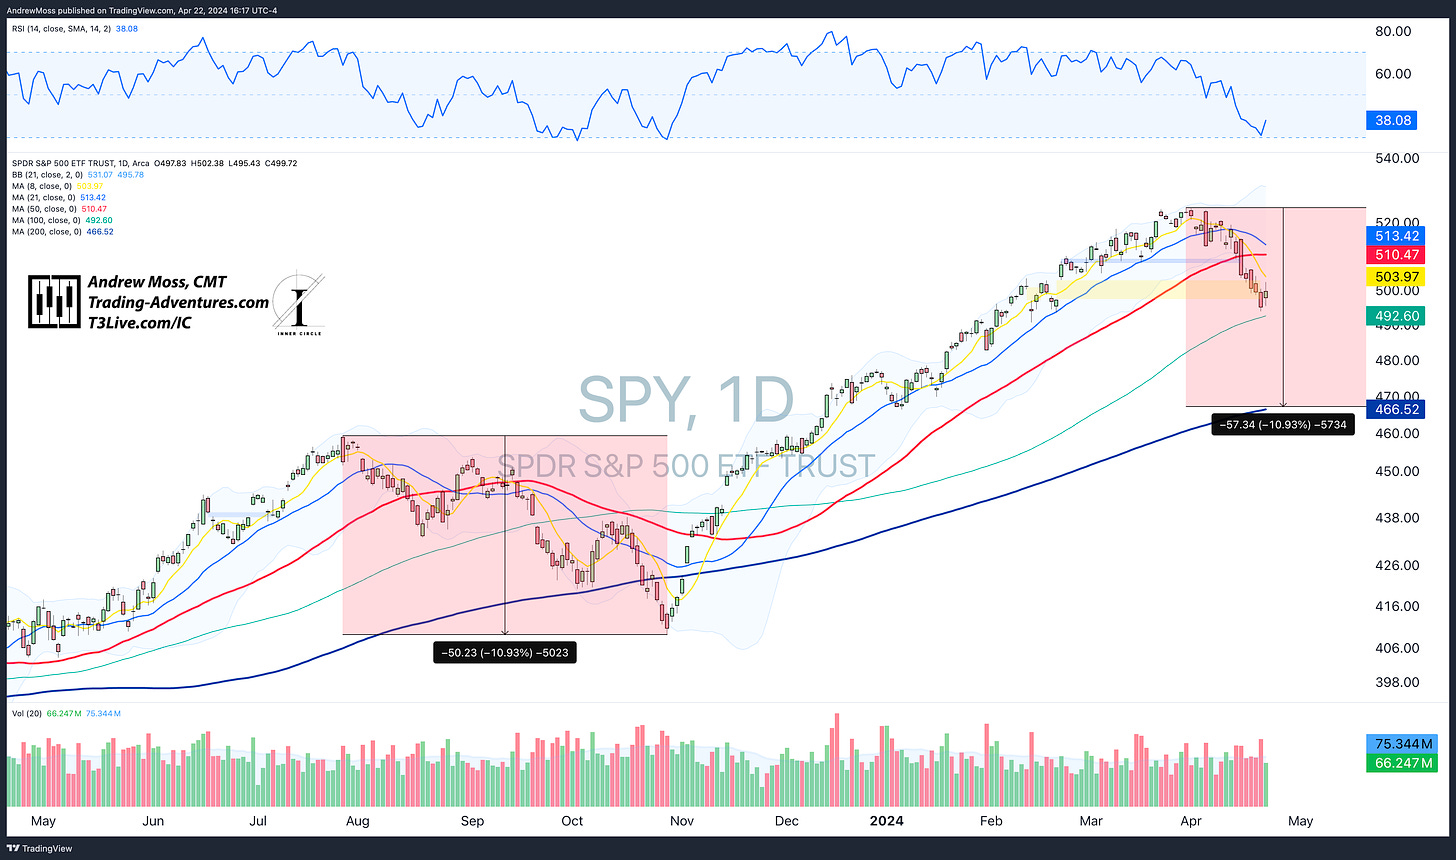
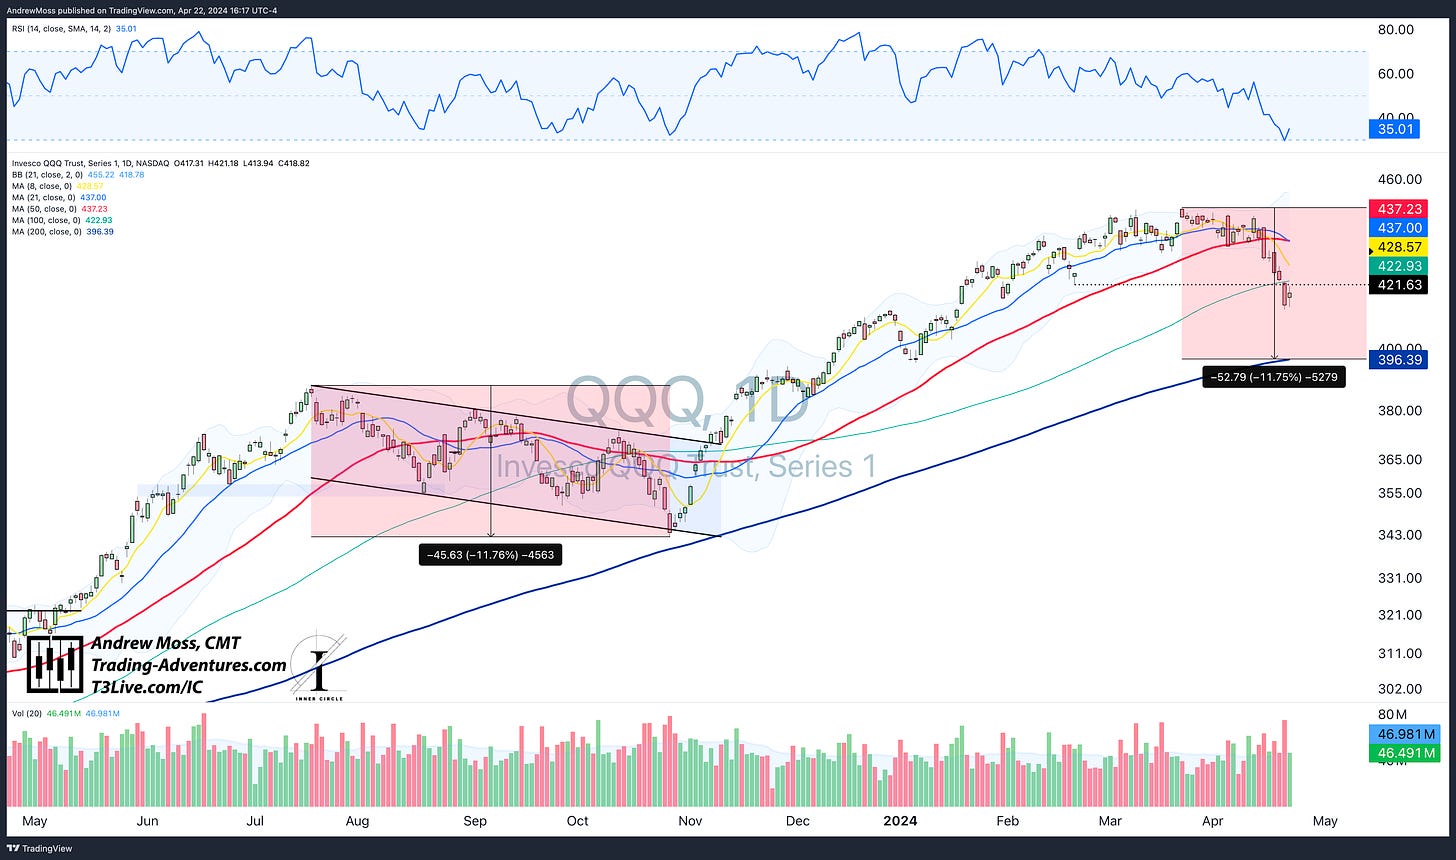
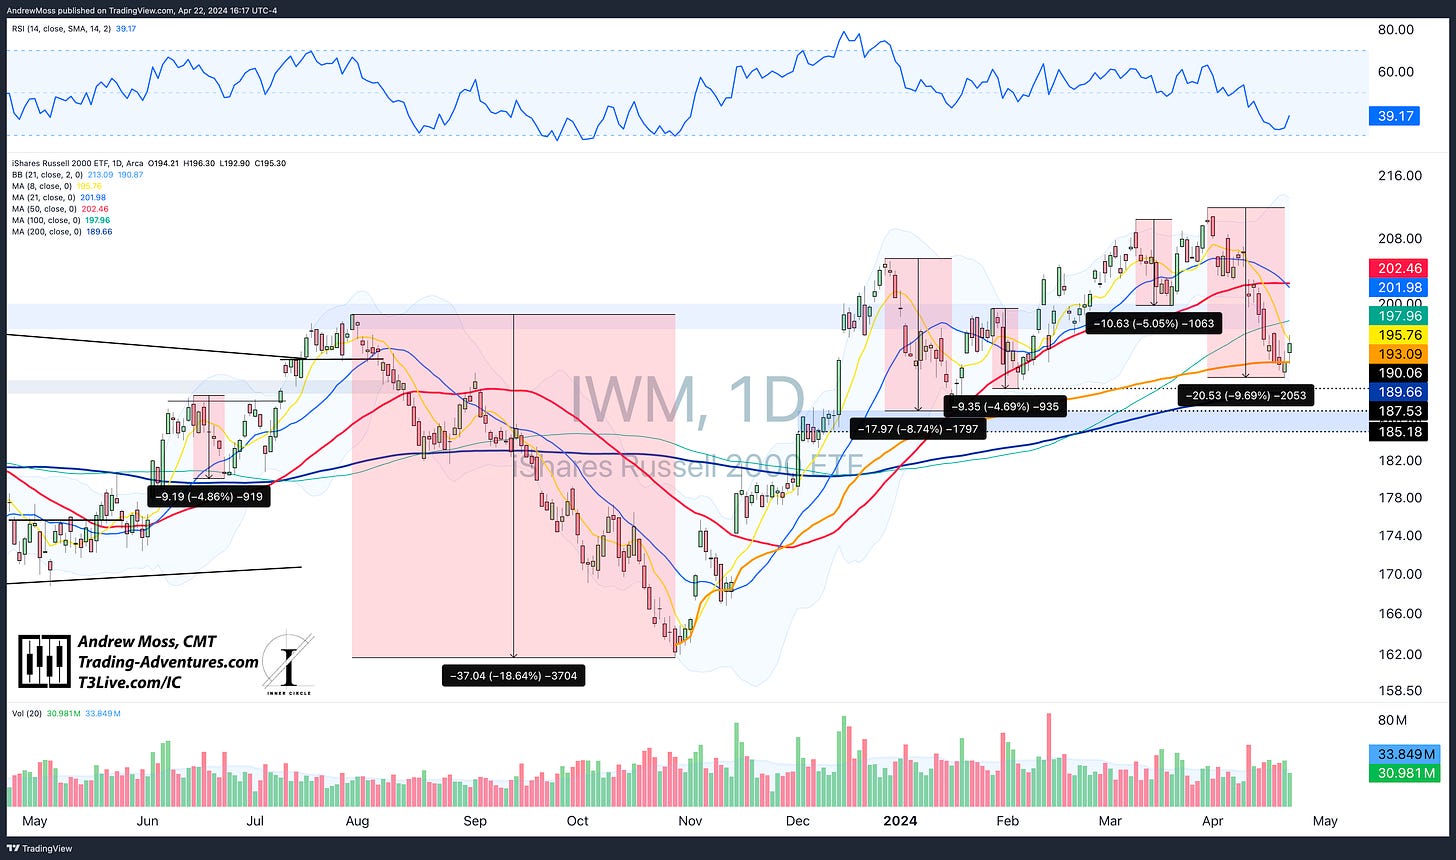
In Thursday’s article, we looked at various support levels the index ETFs were testing. SPY was into the gap. QQQ was at a pivot level and the 100-day MA. IWM was on the AVWAP from the October ‘23 low.
Potential areas of support were identified. Then, on Friday, they all flushed.
Reminder: price action (and reaction) at chart levels isn’t always exact.
There is nothing out there to suggest that markets and prices absolutely care about what we see on the charts.
Sometimes, the action is precise. It’s also common to see pivot levels, moving averages and other instances of support/resistance lost and then quickly regained. Age-old advice: use a think pencil when drawing lines on charts.
It’s more about the area than the precise level.
After Friday’s flush, we are now seeing some prices back into, or above, the area. There may even be some failed breakdowns. As it always is, true support or resistance is only known after the fact.
For now, dip buyers have a new level to measure risk against (Friday’s low). Now, we can see how things develop from here.
Another reminder: market sell-offs are perfectly normal.
I don’t know if you’re scared. And I don’t know if you’ve lost money trading the recent action. But I do know that the world (especially the digital world (X, 24-hour news, etc.) is full of doom-and-gloomers, top callers, and obnoxious I-told-you-so’s.
“The stock market has predicted nine out of the last five recessions.”
―Paul A. Samuelson
The old adage, “If it bleeds, it leads,” works for financial news, too. So when the market sells off, they cue up the red graphics and scary headlines and run them on repeat.
Here, we just follow the charts and the history. And history shows that, on average, the stock market has 3.4 -5% selloffs and 1.1 -10% selloffs per year.
The SPY and QQQ both declined by slightly more than 10% last year. And they may very well do it again this year.
Don’t be surprised.
Q & A
Can even a mild selloff still hurt?
Absolutely.
Can an ill-prepared trader still lose a ton of money?
You bet.
Don’t be caught off guard.
That’s not to say anyone flips the defensive switch precisely at the top every time. However, there are often signs that the situation may change.
Having a solid risk management plan in place at all times is just good trading.
So, from here, nothing changes. We’ll continue to monitor the levels and indicators on the charts, look for solid reward/risk trade setups, and execute as they appear.
The Charts
SPY declined -10.93% from July to November last year and dipped slightly below the 200-day MA. An equal move this year would look very similar.
QQQ dropped by -11.76% during the same time frame. The same move at this time would hit the 200-day almost exactly.
IWM has been more susceptible to sell-offs and drawdowns than the large-cap indexes. Small caps nearly had a ‘bear market’ last year while bigger stocks corrected. The chart shows several other 5-10% downward moves over the last year. That is completely normal, too.
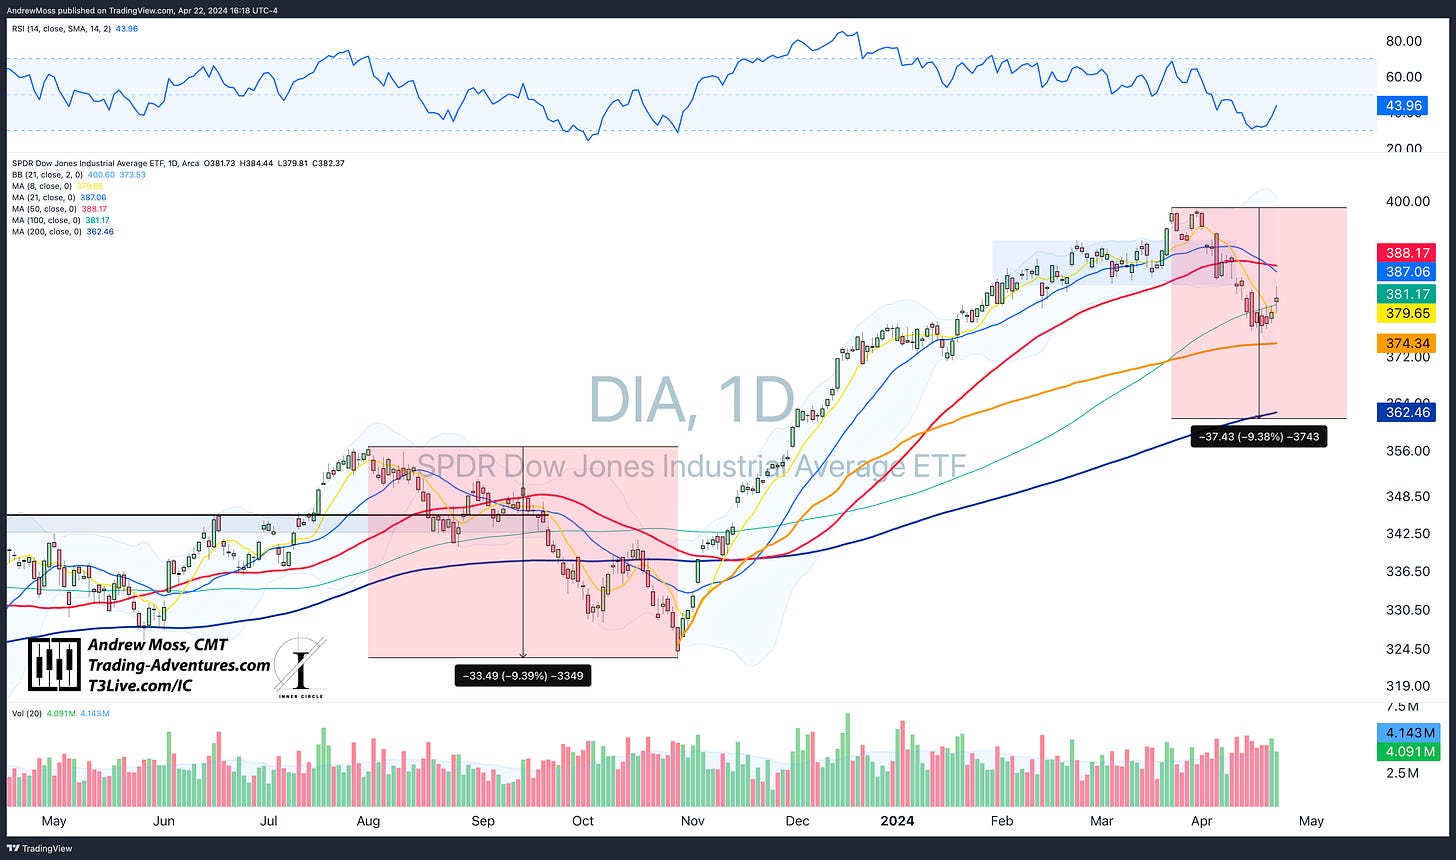
DIA has only sold off about half of last year’s corrective move. Today, it has regained the 8 and 100-day MAs.
TLT caused lots of heartburn last week as the potential for rising rates kept everyone second-guessing the market’s strength.
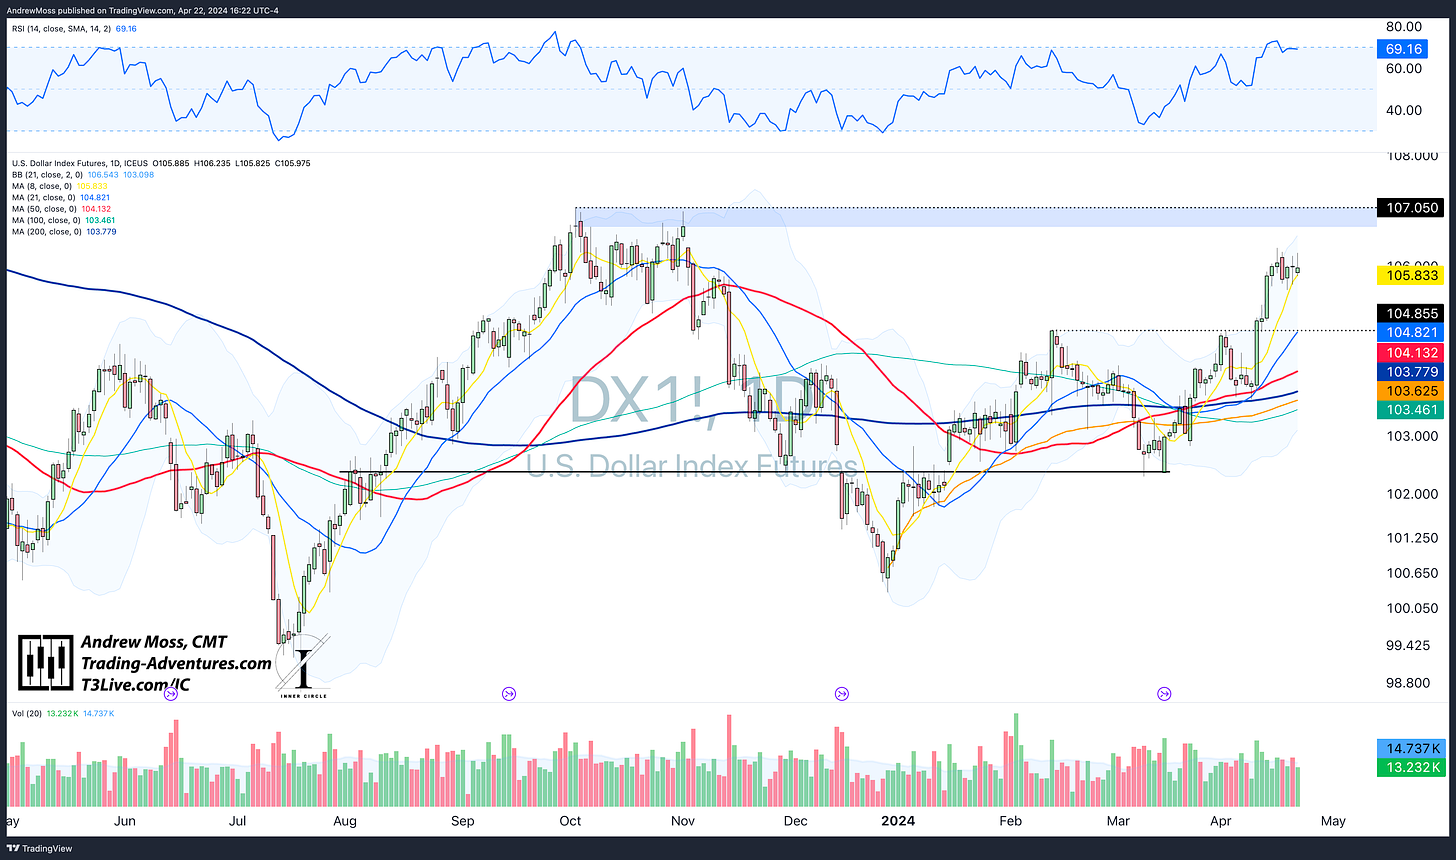
DXY is forming a bull flag pattern with the 8-day MA catching up to price. A breakout higher would move it into the $107 pivot area.
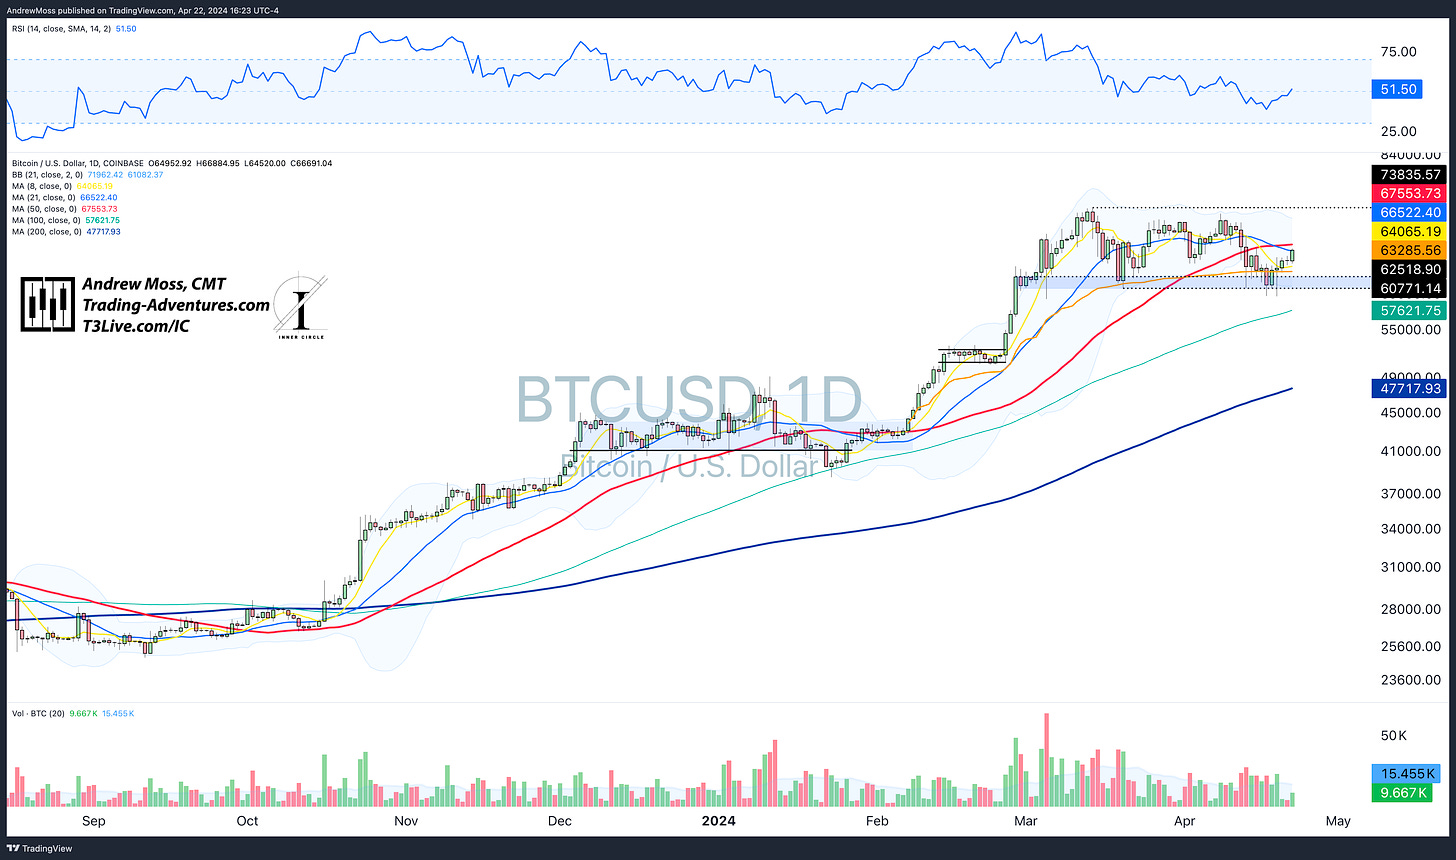
BTCUSD appears to have passed the test. Pivot support has held, and the price is quickly moving back over the key moving averages. Only the 50-day remains now.
The Trade
Be on alert for enhanced reward/risk setups.
Dips create opportunities. Many stocks have bounced nicely today, giving the chance for some cash flow trades. Now, we can watch and see if they develop into something more.
Otherwise, the trade is the same. Watch levels overhead for potential resistance and an opportunity to take some profit and reduce risk.
Underneath, keep an eye on the risk management levels (areas) for open positions that may get stopped out.
Elevate Your Trading
Education, training, and support for your Trading Adventure.
Options Trades - Weekly trade ideas are delivered to your email or text messages in language you can easily understand.
Check out EpicTrades from David Prince and T3 Live. Epic Trades from David Prince
Community - Are you an experienced trader seeking a community of professionals sharing ideas and tactics? Visit The Inner Circle, T3 Live’s most exclusive trading room - designed for elite, experienced traders.
The Inner Circle at T3 Live
Prop Trading - Or perhaps you are tested and ready to explore a career as a professional proprietary trader? 3 Trading Group has the technology and resources you need.
Click here to start the conversation:
T3TradingGroup.com
The Disclosures
***This is NOT financial advice. This is NOT a recommendation to buy, sell, or trade any security. The content presented here is intended for educational purposes only.
Andrew Moss is an associated member of T3 Trading Group, LLC (“T3TG”), an SEC-registered broker/dealer and member of FINRA/SIPC. All trades placed by Mr. Moss are done through T3TG.
Statements in this article represent that person’s opinions only and do not necessarily reflect those of T3TG or any other person associated with T3TG.
Mr. Moss may hold an investment position (or may be contemplating holding an investment position) that is inconsistent with the information provided or the opinion being expressed. This may reflect the financial or other circumstances of the individual, or it may reflect some other consideration. Readers of this article should consider this when evaluating the information provided or the opinions being expressed.
All investments are subject to the risk of loss, which you should consider in making any investment decisions. Readers of this article should consult with their financial advisors, attorneys, accountants, or other qualified investors before making any investment decision.
POSITION DISCLOSURE
April 15, 2024, 4:00 PM
Long: IMNM, VKTX0419C80
Short:
Options symbols are denoted as follows:
Ticker, Date, Call/Put, Strike Price
Example: VXX1218C30 = VXX 12/18 Call with a $30 strike




Love these. Gonna grab a strawberry Dr Pepper and sit with this. The mighty moss!