Relative Strength — What Is It? (Really)
Ratio charts. RSI. Ranking systems. Observation. Here’s how traders actually use relative strength — and why the differences matter.
What Is Relative Strength?
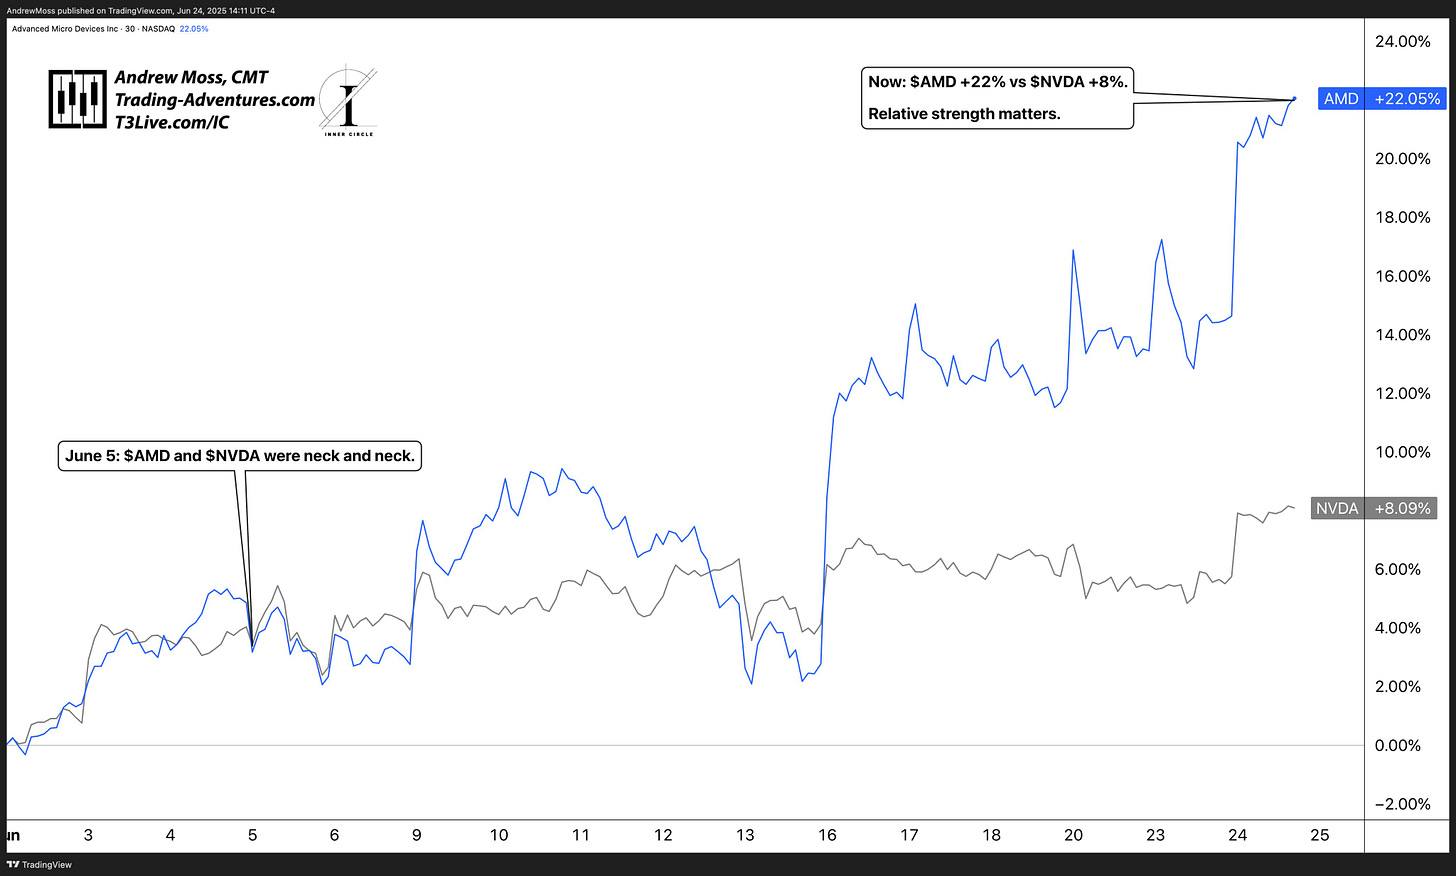
Earlier this week, a colleague at T3 Live highlighted a recent call from David Prince (@epictrades1), who had flagged AMD as the better risk/reward AI trade versus NVDA. The comment was from a video recorded back on June 5, when AMD was trading around 117. Fast forward 20 days — the stock had pushed through $138.
I followed up with a side-by-side chart showing month-to-date performance:
💪 $AMD +22%
😐 $NVDA +8%
And the caption: “Relative strength matters.”
My friend Brian Shannon (@alphatrends) pinged me to point out a useful nuance:
“Interesting that Relative Strength for AMD is 41 and NVDA at 86, according to Investor’s Business Daily.”
He made a very good point — It all depends on what you’re comparing and over what timeframe. The conversation got me thinking that this is a great opportunity to explain the different types of relative strength traders use every day. Because while the phrase “RS” gets thrown around constantly, it can mean very different things depending on the context.
So let’s take a deeper dive.
Price-vs-Price Relative Strength (Ratio Charts)
This is the most intuitive form of relative strength. Take two ETFs (or stocks), plot them against each other, and see which one is winning.
For example, in my Weekly Charts thread each Saturday, I often compare:
XLY vs XLP – discretionary vs staples
SPY vs ACWX – U.S. vs global equities
When XLY is outperforming XLP, it signals risk-on behavior: investors are favoring growth and consumer spending. When XLP leads, it suggests caution or rotation into safety.
These ratio charts don’t just show which area is “stronger” — they help identify turning points, divergences, and rotation as they happen.
RSI: Relative Strength vs. Itself
One of the most commonly used — and commonly confused — indicators in trading is the Relative Strength Index, or RSI. Despite the name, RSI doesn’t compare one stock to another. Instead, it measures the stock’s strength relative to its own past performance over a specific time period — typically 14 days.
The RSI oscillates between 0 and 100. Traditional interpretation suggests:
Overbought above 70
Oversold below 30
But context matters. In strong trends, stocks can stay “overbought” for days or weeks — and still keep climbing. In weak downtrends, “oversold” can linger without triggering a meaningful bounce.
That’s why I treat RSI as a secondary measure — useful for confirming price action or spotting momentum extremes, but not a standalone trigger.
So while RSI and relative strength ratios share a name, they measure very different things. One is about internal stretch. The other is about leadership.
Dorsey Wright: Relative Strength Matrix
At Dorsey Wright & Associates, relative strength takes on a more structured, quantitative form.
They construct what’s known as a relative strength matrix, often using Point & Figure charts to compare each stock in an index — say, the S&P 500 — against every other stock in that same index. Each “matchup” assigns a winner based on price performance over a defined lookback period, typically between 3 and 12 months.
Once complete, the matrix ranks every stock by how often it ‘wins’ in head-to-head comparisons — a bit like round-robin standings in a sports league. The result is a momentum-weighted leaderboard that shows which names are truly outperforming across the board.
These rankings are useful for:
Portfolio construction
Sector rotation
Staying aligned with long-term leadership
It’s a more institutional approach (one I leaned on often during my time as a Senior Portfolio Manager at Morgan Stanley) that emphasizes sustained strength over short-term pops.
Learn more at: Nasdaq Dorsey Wright
Investor’s Business Daily: Relative Strength Score
Another take on relative strength comes from Investor’s Business Daily (IBD). Their system assigns each stock a Relative Strength (RS) Rating — a number from 1 to 99 that reflects how a stock has performed over the past 12 months relative to the entire market.
A stock with an RS Rating of 90, for example, has outperformed 90% of all other stocks during that period.
This approach is straightforward and useful for:
Screening: Quickly spotting top-performing names
Trend confirmation: Strong RS scores often accompany strong price structures
Momentum trading: IBD’s system favors stocks with consistent relative leadership
It’s important to note that this is a proprietary formula, so the exact weighting and mechanics are not public — but the concept is familiar and intuitive.
More info: Investors.com
Real-Time Relative Strength: Observation Over Calculation
Not every relative strength insight comes from a ratio chart or technical indicator. In fact, some of the most valuable signals come from simple observation.
Inside the Inner Circle and EpicTrades, we point this out all the time. For example, we might hear,
“Look at AAPL compared to the QQQ.”
The index might gap up, hold a pullback, and push to new highs — while the stock mentioned stays stuck near the lows of the day. No chart overlay needed. That’s relative weakness, clearly and visibly.
These observational RS reads are a key part of how we trade real-time flow:
Which names are leading the move?
Which names can’t get out of their own way?
Who’s confirming the index? Who’s diverging?
This kind of relative strength is less about math — and more about presence. It’s about watching the tape, staying engaged, and noticing what’s lagging when the market is lifting.
Over time, these simple RS reads become instinctive. And they often give a clearer edge than any indicator can.
📌 Applying structure in real trades…
This week in the EpicTrades Options newsletter, we shifted our bias on CRCL from short (a quick extension trade) to long — and came in with a clear plan.
As the price dipped below $200, we stepped in with $210 calls. Within 30 minutes, we were trimming for a ~25% gain.
The final piece? Closed the next morning near +80%.
It wasn’t about predicting the move — it was about being prepared and positioned when it mattered.
➤ Want alerts like this? t3live.com/et
Why It Matters
Whether you’re comparing two ETFs on a ratio chart, scanning for IBD’s top RS scorers, or reviewing a Point & Figure matrix from Dorsey Wright, the core idea remains the same: find what’s working — and stay with it.
Relative strength isn’t just a technical concept. It’s a way to stay aligned with the market’s internal rotation. It helps identify leadership early, avoid laggards, and keep your trades in sync with prevailing momentum.
But it only works when you understand what kind of relative strength you’re looking at.
Some tools compare stocks to each other. Some measure momentum internally. Others aggregate multiple contests into ranked lists. They’re all useful — but only if you use them with the right expectations.
In my own process, I rely most on ratio charts, observational cues, and breadth-based RS comparisons each weekend, alongside classic technical structure. That gives me a feel for where strength is moving — and where it might go next.
So when someone asks, “What’s showing relative strength?” the real answer is,
“Compared to what — and over what time frame?”
Looking For More?
Elevate Your Trading Adventure Even Further With These Offerings.
EpicTrades Options Newsletter
Real-time trade ideas and insights, providing actionable trading insights focusing on options trades with short-term horizons, aiming to capitalize on weekly market movements.
The approach includes detailed reasoning for trades, specific options, and profit targets. It focuses on quick gains with a minimal time commitment from subscribers.
The Inner Circle
The Inner Circle is a Virtual Trading Floor (VTF) at T3 Live. I’ve been working and trading with this group since 2022. You may have noticed the logo in the watermarks on my charts.
Founded by David Prince and led by him, Rick March, and Kira Turner, the Inner Circle is a community of elite traders, including hedge fund managers, family office heads, corporate executives, financial advisors, and even professional poker players.
Fundamental, Macro, and Technical Analysis all combine to find and discuss the best opportunities in current markets.
The Disclosures
***This is NOT financial advice. This is NOT a recommendation to buy, sell, or trade any security. The content presented here is intended for educational purposes only.


Well done, thank you!
Amigo que artículo tan bueno. Me gustó muchísimo. Gracias por tomarte el tiempo de escribirlo y explicarlo con tanta claridad. En hora buena! Gracias