Relentlessly Rising Rates
Monday Market Update October 2, 2023
The Markets
Stocks struggled to start the week as yields and the dollar continued their relentless advances.
TYX - Yields on 30-year Treasury Bonds hit another new 2023 high of 4.819%.
The price of Treasury Bonds continues to make new lows while the US dollar made new highs.
(DXY and TLT chart in the next section)
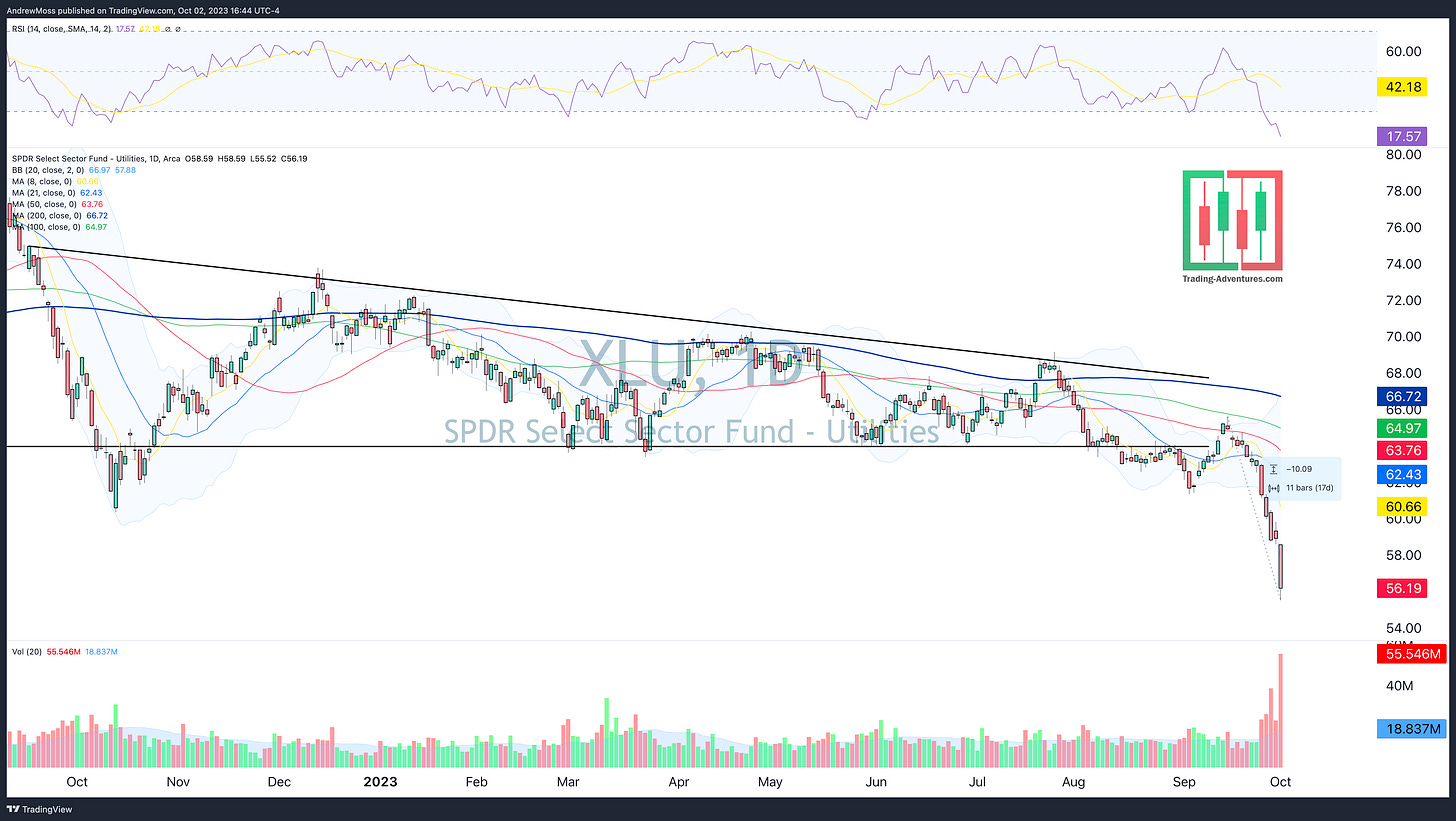
Meanwhile, the utility sector looks broken and has fallen 10% in 11 trading days. The daily RSI today reached low levels not seen since July 2002.
Indications of economic weakness?
Or simply casualties of the rapidly rising rate environment?
That remains to be seen. Whatever the case, the charts are not healthy and don’t convey confidence.
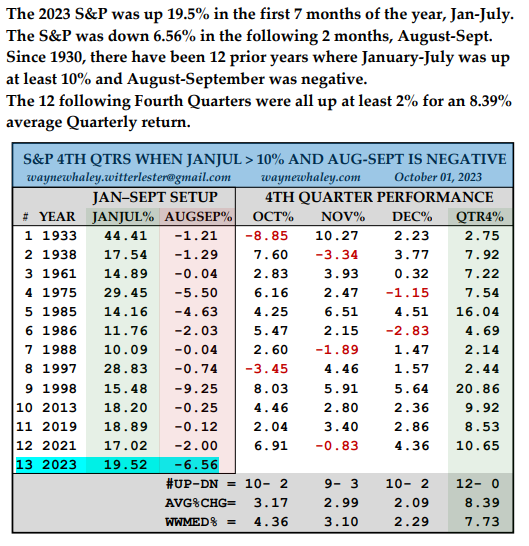
On the other hand, we’re out of September and moving into the seasonally strong months for stocks. Wayne Whaley shared these stats (give him a follow on X) showing that when the SP 500 is up at least 10% through Jan. - July, then down in Aug. and Sept., the fourth quarter of the year is up 12 out of 12 times. A perfect record.
Source: https://twitter.com/WayneWhaley1136/status/1708701639836573772
That doesn’t mean it happens that way again. But it is another interesting piece of the seasonal data.
The Charts
click to enlarge
SPY is still fighting to stay above the March low AVWAP while the 8-day MA kept a lid on today's attempt higher.
QQQ shows an inside day between the 8 and 100-day MAs w/ the April low anchored VWAP also nearby.
IWM looks terrible as Friday’s selling continues into today, taking prices to new recent lows.
DIA also looks ill but did catch a bid into the close resulting in a hammer candle. Now we’ll see if tomorrow’s action can confirm the pattern.
TLT has no bond buyers in sight.
DXY The US Dollar moves relentlessly higher.
The Closing Bell
So the tug-of-war rages on.
Stocks (which normally rise during this time of year) versus higher rates and a rising Dollar.
Who’s gonna win?
The Disclosures
***This is NOT financial advice. NOT a recommendation to buy, sell, or trade any security. The content presented here is intended for educational purposes only.
Andrew Moss is an associated member of T3 Trading Group, LLC (“T3TG”) a SEC registered broker/dealer and member of FINRA/SIPC. All trades placed by Mr. Moss are done through T3TG.
Statements in this article represent the opinions of that person only and do not necessarily reflect the opinions of T3TG or any other person associated with T3TG.
It is possible that Mr. Moss may hold an investment position (or may be contemplating holding an investment position) that is inconsistent with the information provided or the opinion being expressed. This may reflect the financial or other circumstances of the individual or it may reflect some other consideration. Readers of this article should take this into account when evaluating the information provided or the opinions being expressed.
All investments are subject to the risk of loss, which you should consider in making any investment decisions. Readers of this article should consult with their financial advisors, attorneys, accountants, or other qualified investors prior to making any investment decision.
POSITION DISCLOSURE
October 2, 2023, 4:00 PM
Long: AMZN, MSFT, SPY, QQQ, XLU1006C56
Short:
Options symbols are denoted as follows:
Ticker, Date, Call/Put, Strike Price
Example: VXX1218C30 = VXX 12/18 Call with a $30 strike


