

Rotation Rotation Rotation
Market Update for Thursday November 30, 2023
Quick Note for email viewers - Many extra charts are included today, which may cause the article to be cut off prematurely.
If so, please click on the Title directly above or the “View in browser” link above the header image to read the complete article on the webpage.
The Markets
Much was written here over the last few months about stock market seasonality. And for good reason. We needed to be ready for the incredible move that just happened. I hope you were all able to participate and profit.
We’ve looked at:
November is, repeatedly the strongest month of the year for the SPY and IWM (#2 for QQQ and DIA).1 So it should be no surprise that performance has been fantastic over the last 30 days.
Nothing goes straight up forever, though—especially not the stock market. There are pauses or corrections along the way.
We’ve looked at the two main types of market correction: time and price.
Now, let’s consider another key component of healthy markets. It often shows up during times of consolidation or correction. We’re seeing it now.
Rotation
Rotation is the lifeblood of a bull market.
Today, the Large-cap stocks are selling off while the Small-caps are moving higher — SPY and QQQ are down while IWM is up.
Note: a substantial late-day rally did take SPY into positive territory for the day. However, it does not change the impact or the message.
Let’s take a deeper look.
Consider the Magnificent 7 - AAPL, AMZN, GOOGL, META, MSFT, NVDA, & TSLA
Each was sold today, and at the close, five of the seven are below the 8-day moving average. (MSFT and TSLA rallied back to close above)
Meanwhile, Banks KRE, Biotechs XBI, Financials XLF, Healthcare XLV, Industrials XLI, and Materials XLB all enjoyed positive action. And each is above its 8 and 21-day MAs, showing strong momentum.
charts included below
This is precisely what the bulls want to see.
Rather than buyers disappearing altogether, they’ve shifted focus to other areas, presumably rounding out their portfolios by adding exposure to the recently underserved sectors. As this buying continues and these sectors become extended, it will be more and more difficult to feel good about adding exposure.
Nobody wants to be the sucker that buys the top.
At the same time, the leading sectors will likely come back down to more favorable buying areas. Perhaps they test the short-term moving averages and recent pivot levels. Then traders, investors, and money managers will feel better about buying the dip, and things will cycle back around.
Rotation.
This is how bull markets continue. This is their lifeblood.
Let’s see if it keeps up.
The Charts
click to enlarge
SPY spent most of the day in the red before a late-day rally sent stocks sharply higher. Time correction continues while selling is quickly overpowered.

QQQ also rallied to close above the pivot level—a display of strength.

IWM didn’t run away. And the 200-day MA did keep a lid on it for the day. But it did lead stocks higher for most of the session—continued time correction with an upward grind.

DIA got a substantial jump at the close. It finishes the day above the pivot level and at a new high for the year. That’s not the kind of thing you see in a bear market.

DXY The Dollar rallied back to the resistance level mentioned here. This is another area or rotation that we must pay attention to. A rising dollar has been a headwind for stocks.
Over $103.40 and stocks pullback
Below $103.40 and stocks stay sideways or higher
It could be that simple.

TNX Treasury yields are in the same boat as the Dollar. Today’s rally confirms yesterday’s reversal candle.
Now, does it find resistance and head lower?
Or will it continue higher and be a stressor to stocks?

KRE Regional banks have done much repair work since the crisis. They’re over the 200-day MA and showing a potential breakout pattern.

XBI Biotech keeps moving higher, one step at a time. Today’s run was sharply reversed, though. We’ll see if this is the beginning of some rotation back to the leaders.

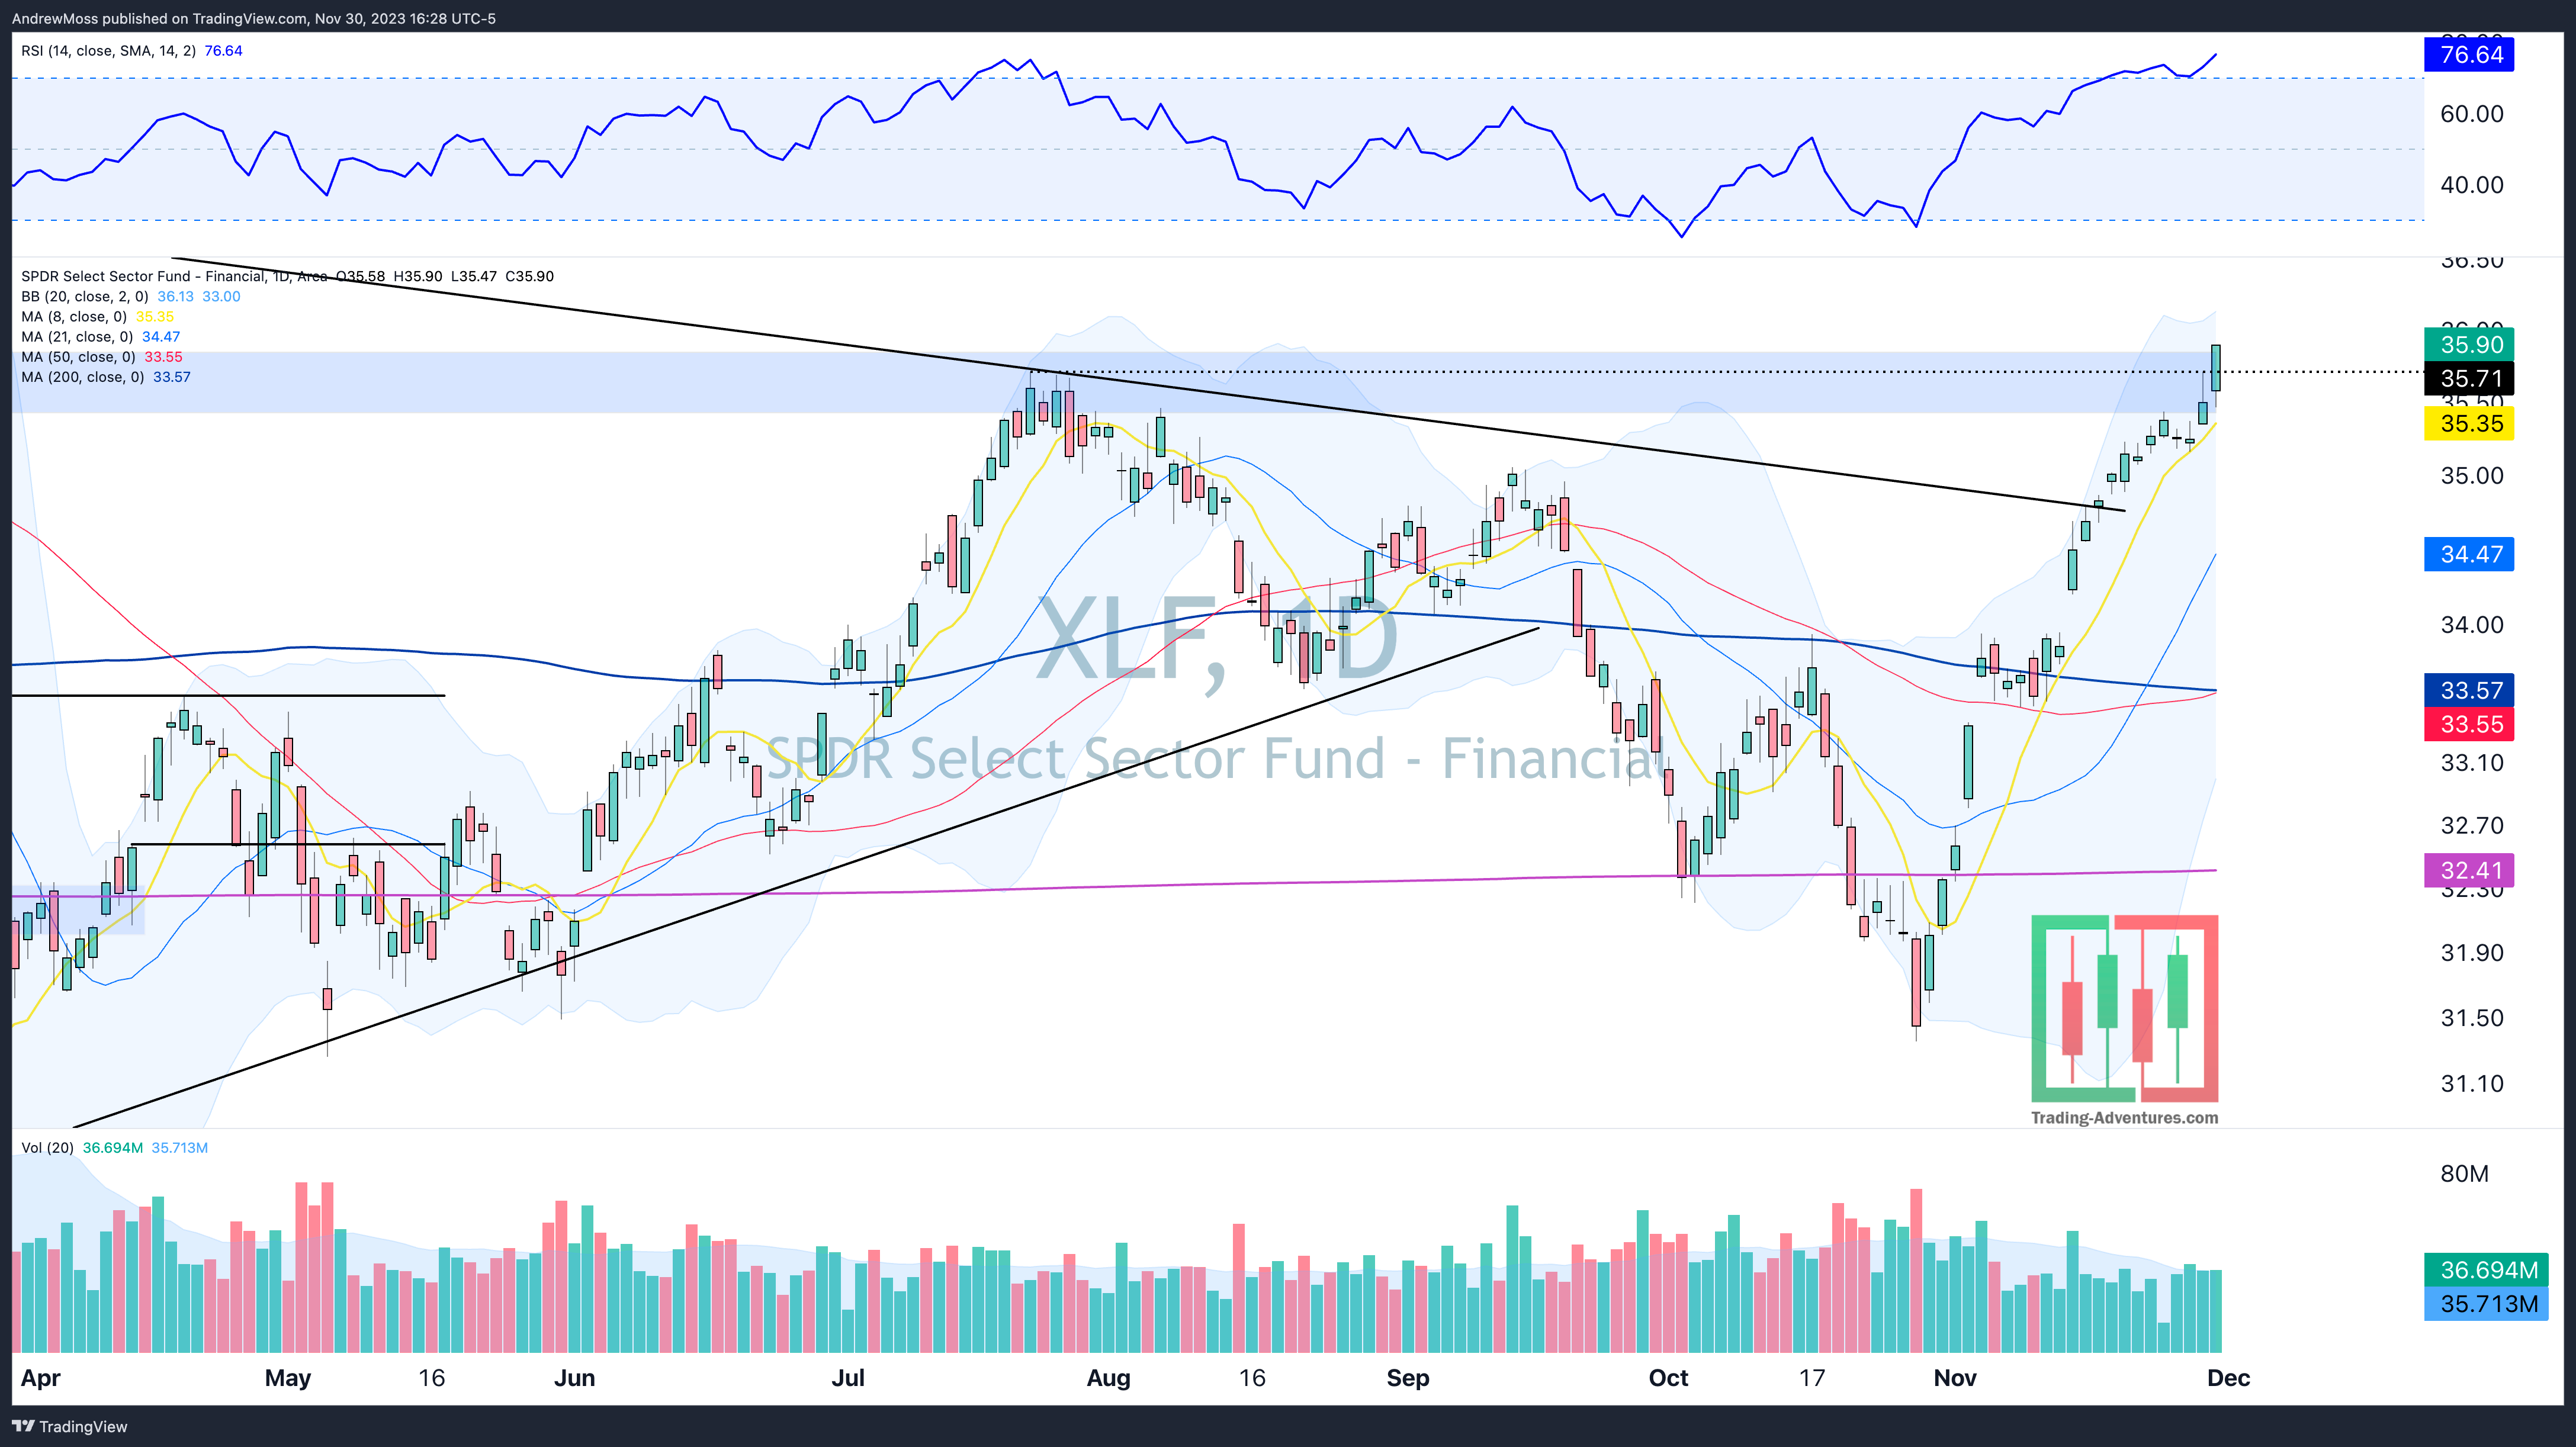
XLF The Financial sector is up and over the pivot high from July and a support/resistance zone that dates back to March 2021.
XLV Healthcare stocks have moved back over the 200-day MA after a failed breakdown late last month. Now there is breakout potential if they can carry over $132

XLI Industrials are over all key MAs and moving into clean air.

XLB Materials look much the same.

Rotation.
The Closing Bell
This weekend means an on-the-road soccer match with my daughter. So, the Weekly and Monthly charts will be added to X sporadically.
Make sure you’re following me there - Andy Moss on X.
Hit the bell 🔔 to turn on notifications so you never miss one of my charts.
See you there.
The Disclosures
***This is NOT financial advice. NOT a recommendation to buy, sell, or trade any security. The content presented here is intended for educational purposes only.
Andrew Moss is an associated member of T3 Trading Group, LLC (“T3TG”), an SEC-registered broker/dealer and member of FINRA/SIPC. All trades placed by Mr. Moss are done through T3TG.
Statements in this article represent the opinions of that person only and do not necessarily reflect the opinions of T3TG or any other person associated with T3TG.
It is possible that Mr. Moss may hold an investment position (or may be contemplating holding an investment position) that is inconsistent with the information provided or the opinion being expressed. This may reflect the financial or other circumstances of the individual, or it may reflect some other consideration. Readers of this article should take this into account when evaluating the information provided or the opinions being expressed.
All investments are subject to the risk of loss, which you should consider in making any investment decisions. Readers of this article should consult with their financial advisors, attorneys, accountants, or other qualified investors prior to making any investment decision.
POSITION DISCLOSURE
November 30, 2023, 4:00 PM
Long:
Short:
Options symbols are denoted as follows:
Ticker, Date, Call/Put, Strike Price
Example: VXX1218C30 = VXX 12/18 Call with a $30 strike
https://jeffhirsch.tumblr.com/post/731648701192421376/november-almanac-historically-a-top-month-but