Sideways. Then up. Then ...
Market Update June 13, 2024
The Markets
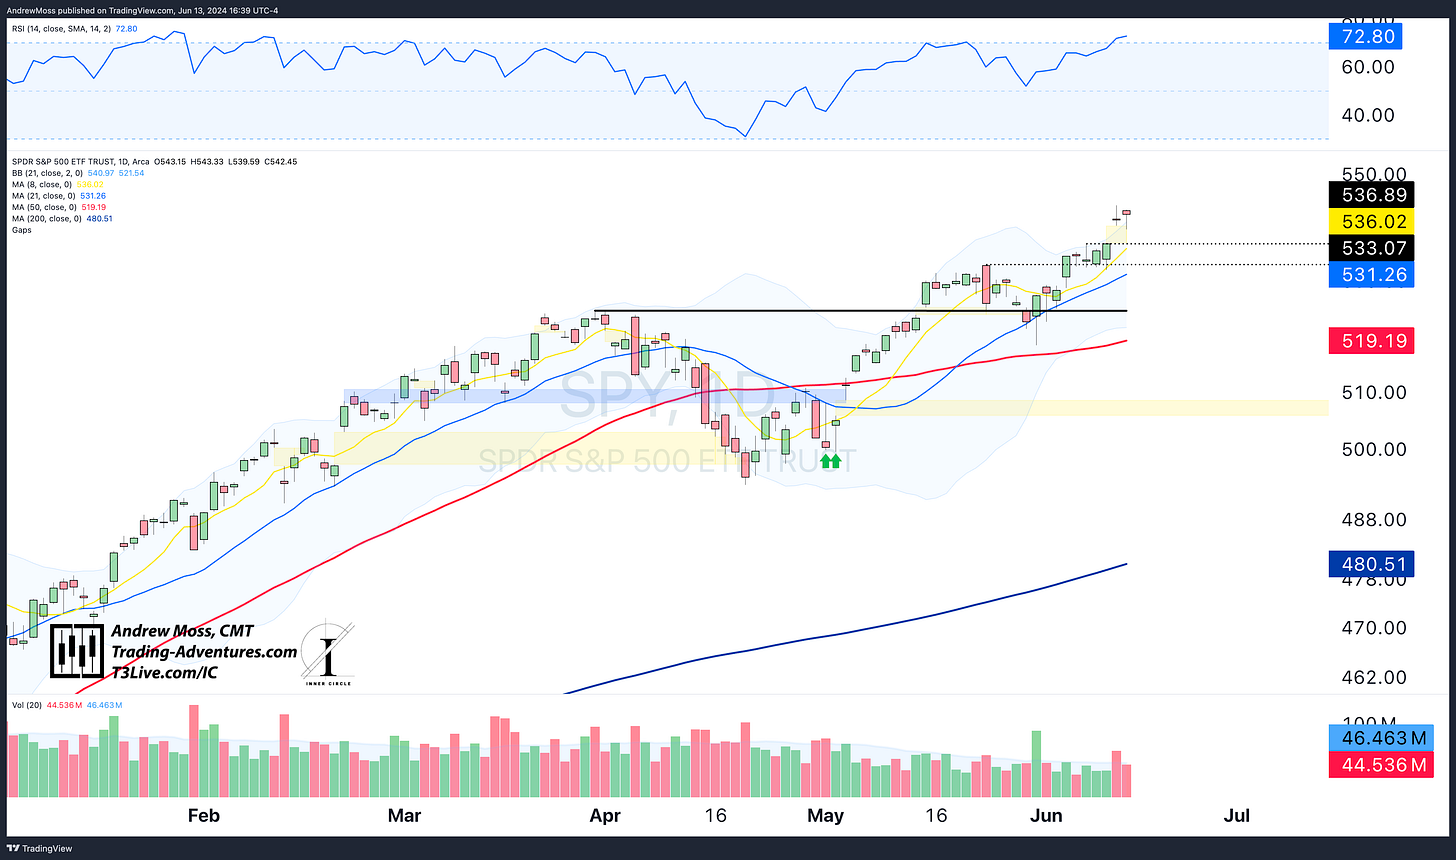
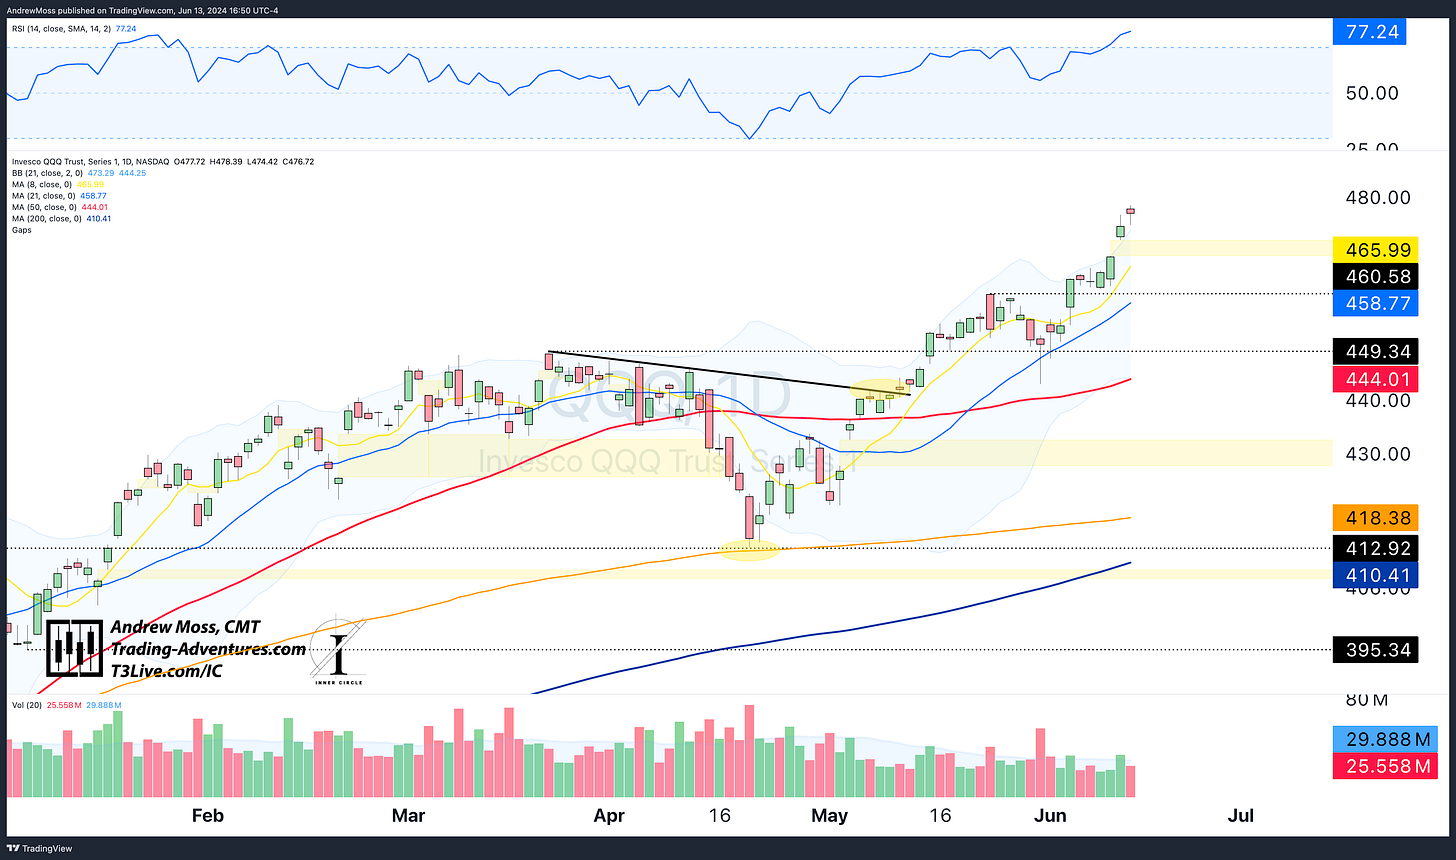
Monday, we looked at SPY and QQQ moving sideways, holding the pivot highs from late May. What comes after sideways in an uptrend? That’s right, up.
sideways > up
Apologies if that sounds too simple, but there isn’t any reason to complicate it. That’s where the market is right now. The uptrend continues.
However, one thing is missing, even though it was mentioned briefly in Monday’s article.
We have sideways.
We have up.
We’re missing down.
Yes, markets can and will go down, even in uptrends.
Corrections happen in one of two ways — By time or by price.
Last week, we saw a slight time correction as the prices of SPY and QQQ moved sideways while the moving averages continued higher. After a period, the price and the short-term MAs converged. This often leads to a springboard that can then propel prices higher again. That’s exactly what happened over the last three days.
We saw a price correction after the May 23 pivot high. In that instance, prices moved sharply lower — nearly 5% lower in 5 days — dipped below the 21-day MA and then rebounded.
Which will it be this time?
Let’s look at the charts for some clues.
The Charts
SPY makes another new closing high after a slight dip earlier in the day. Yesterday’s candle was a doji — indecision. What followed today had the potential to be a bearish engulfing candle. That would’ve signaled to be on watch for a decline in the coming days. But another late-day rally took us back up.
However, with FOMC, CPI, and PPI behind us, it could be time for a bit of rest and a breather. RSI did reach overbought status today at 72.80. That’s not bearish. And this isn’t a call for the top.
Just pointing out that it’s possible, perhaps even likely, that we will see a gap fill and test of the 8-day MA again in the coming days.
QQQ is more extended above the 8-day, and the RSI clocks in at 77.24 today. A gap fill and 8-day MA retest is a potential here as well.
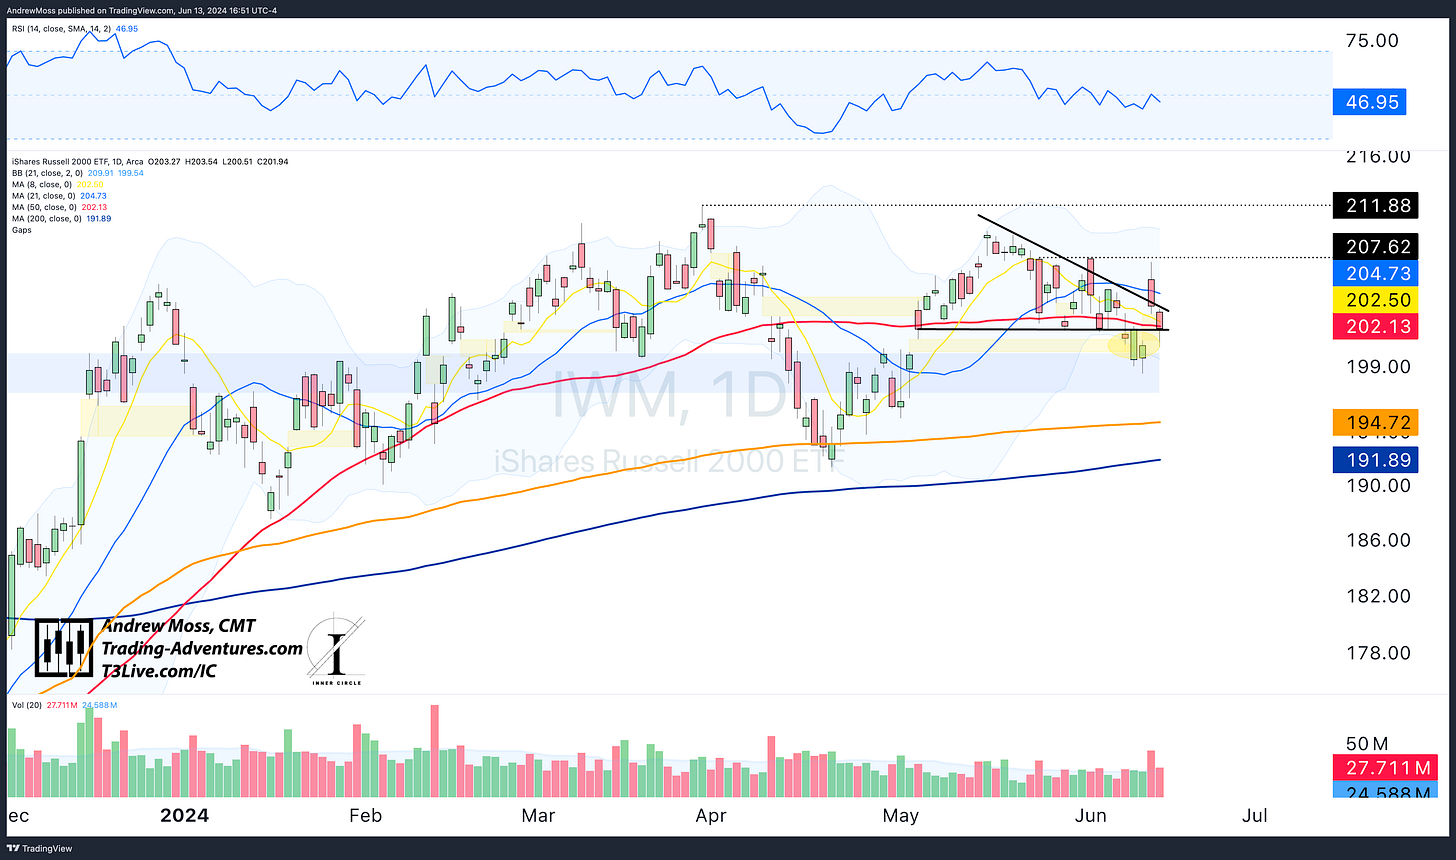
IWM is still a mess. Breakdowns don’t hold, and breakouts do not. The low $200s simply will not let go. It did manage to close above the support line and near the 50-day MA.
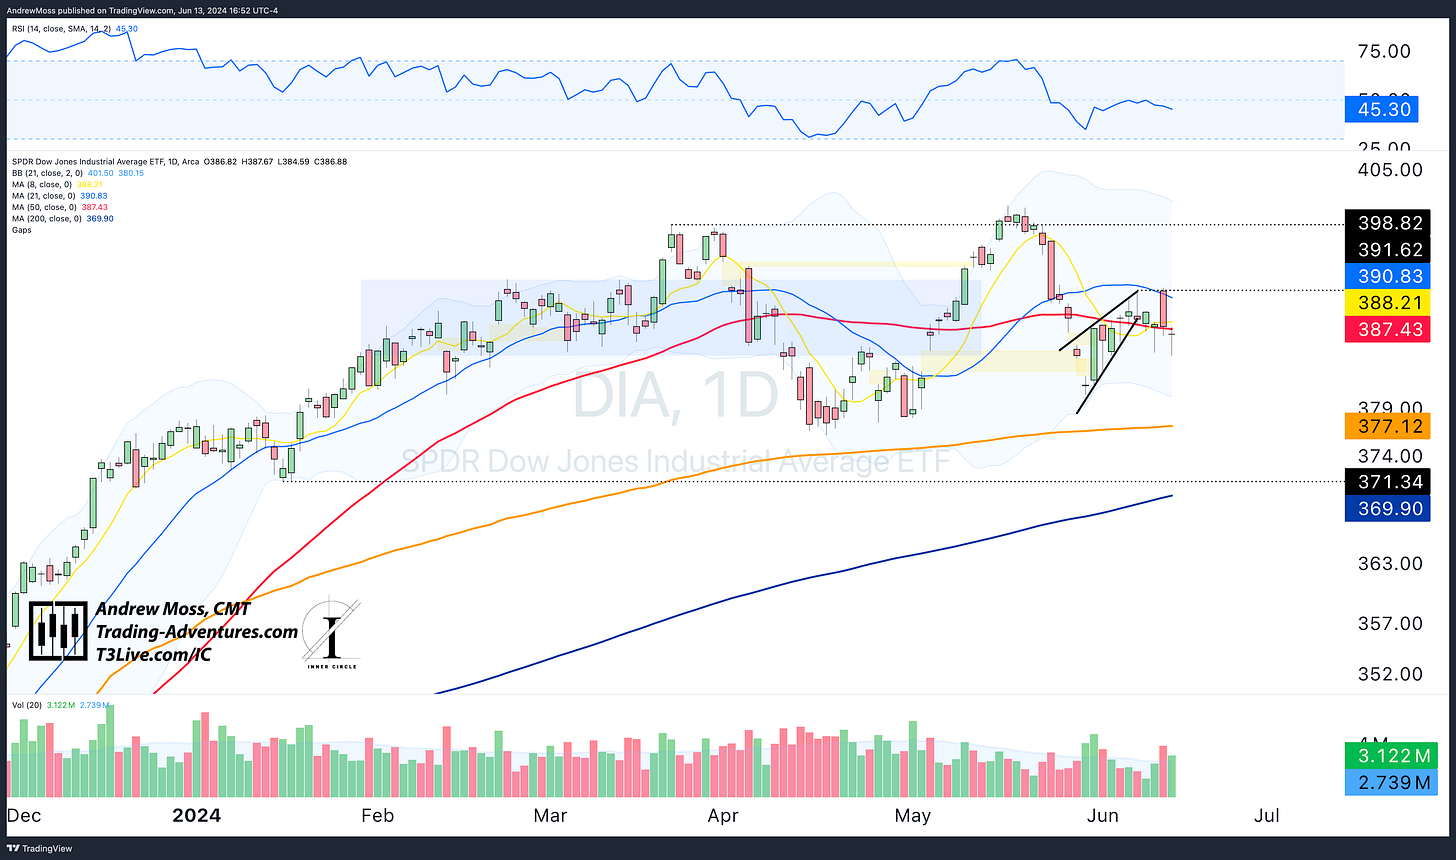
DIA was rejected squarely at the 21-day MA, and now the bearish rising wedge pattern has more merit. If it doesn’t recapture the $391.62 pivot fairly soon, a trip to $377-$378 is very possible for the Dow 30.
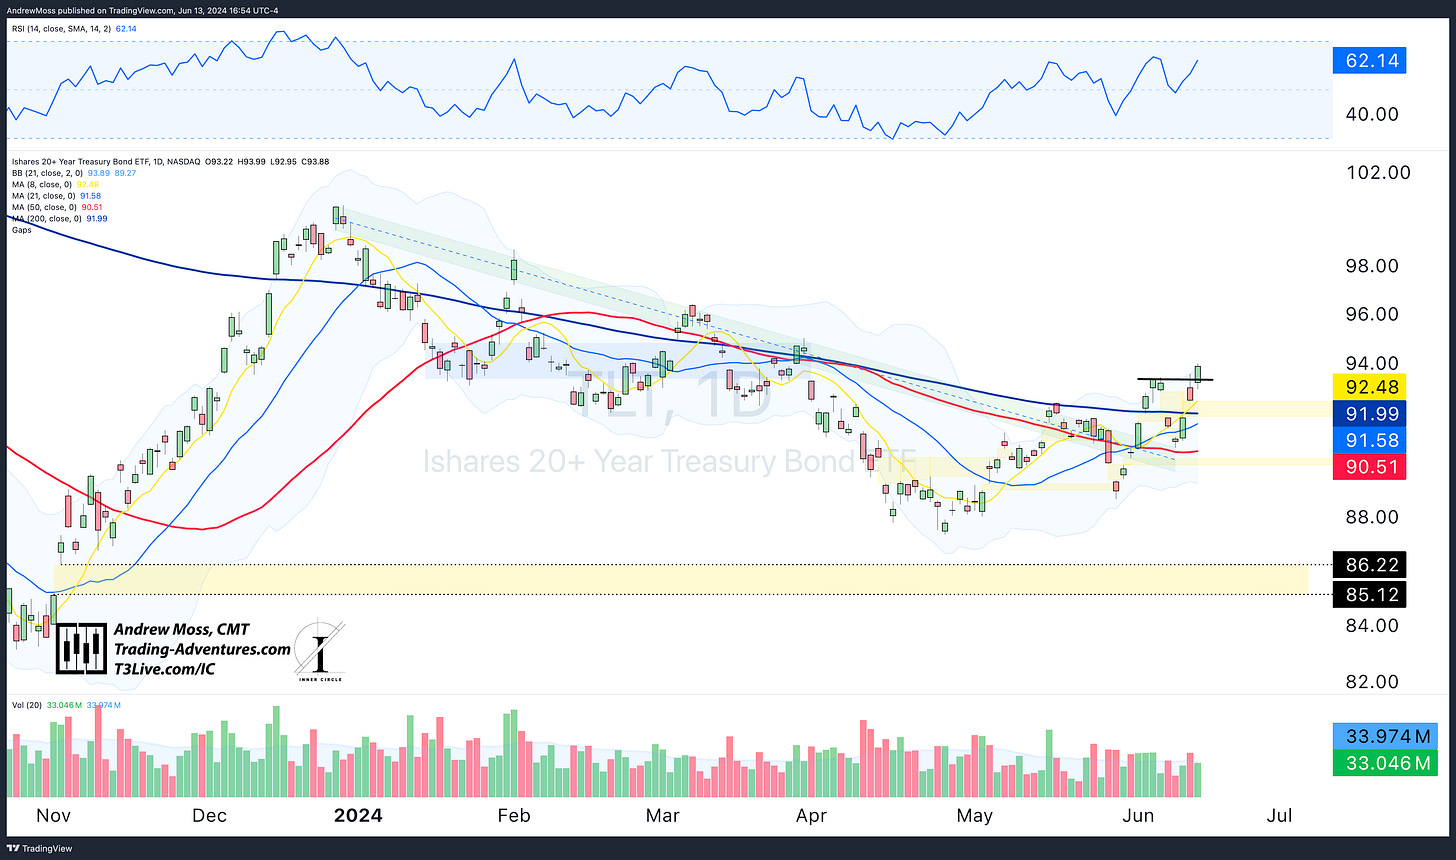
TLT continues to improve. Today, it's above the recent pivot and holding the gains well. The 8 and 21-day MAs are already moving higher, and now we can look for the 50 and 200-day MAs to do the same.
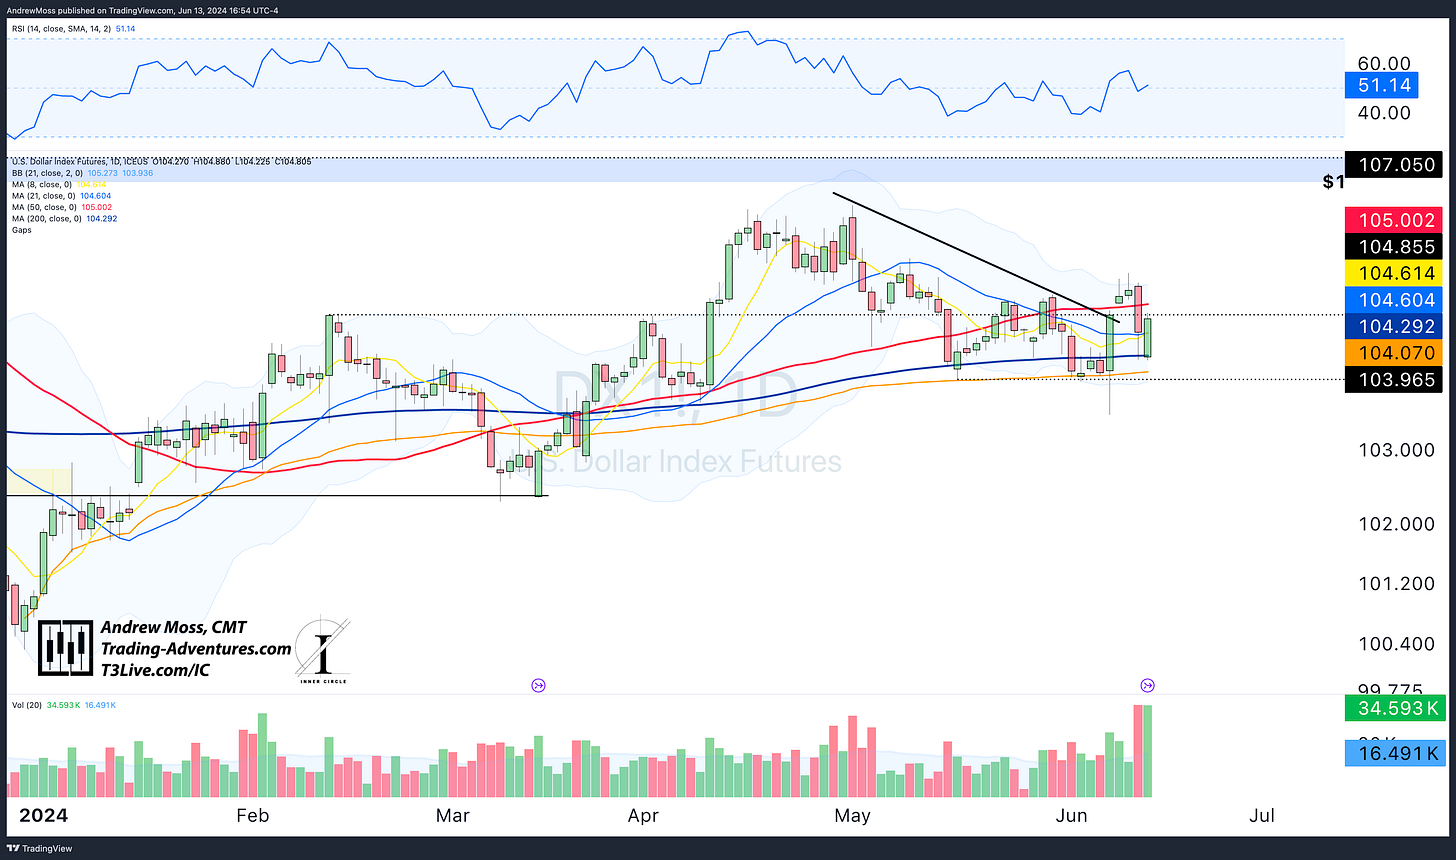
DXY is nearly as messy as IWM. A lot of movement just to come back into the range, and we’re still left looking for a move that keeps it below $104.
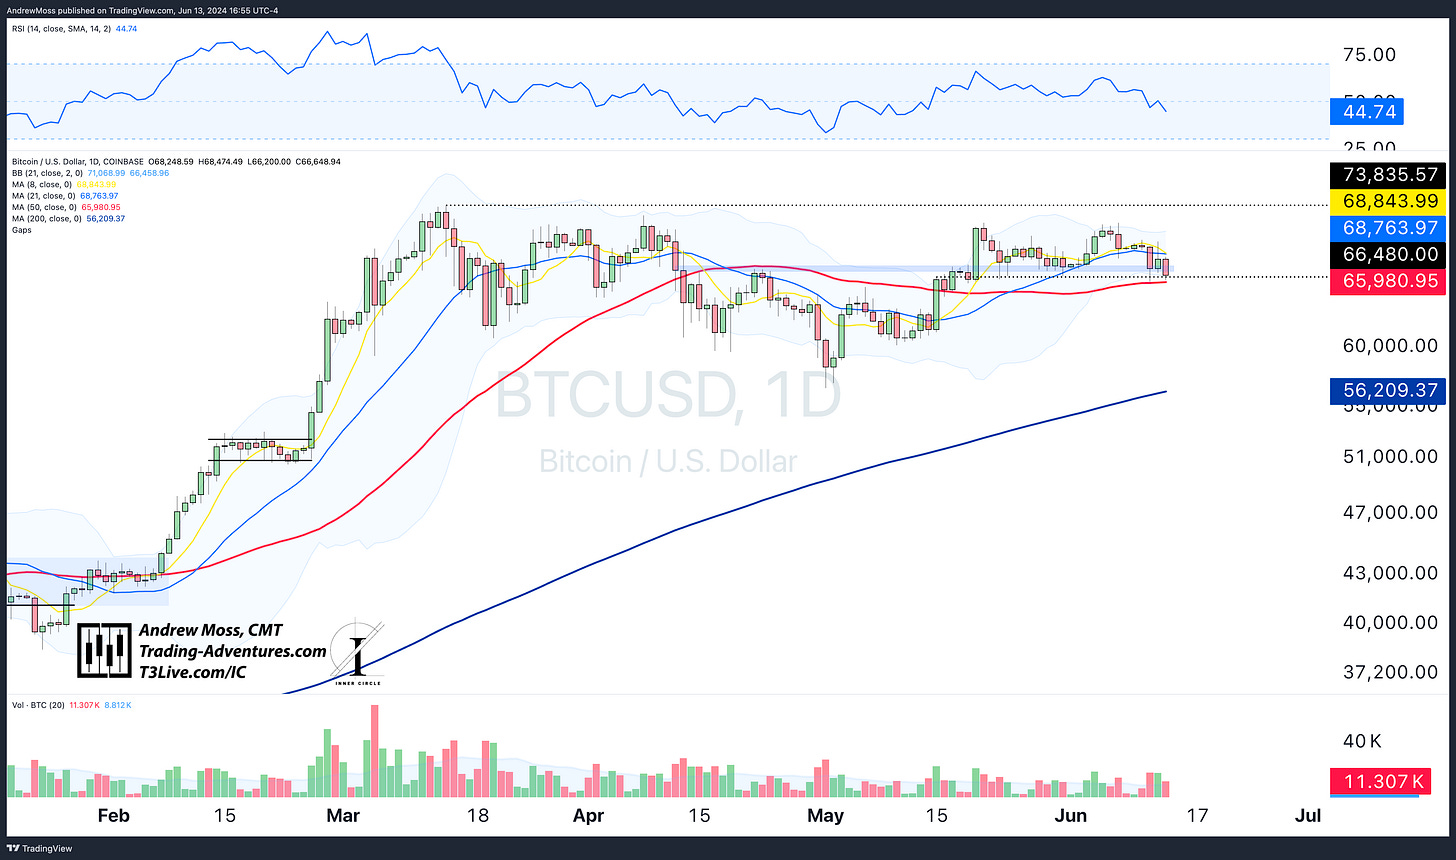
BTCUSD continues the holding pattern. The range over the last three months is still in control as price tests the 50-day MA this week. Above the redline, we will stay on breakout watch. Below the redline means ‘risk-off’ for the near future.
The Trade
The next trade for me is about balance. Next week, I’ll get long the ‘R and R’ trade by spending some quality time away from the charts and the markets. There will be no market updates during that time.
In the meantime, ratchet up the trailing stops and let the bull market do its thing.
Have a fantastic week!
Elevate Your Trading
Education, training, and support for your Trading Adventure.
Options Trades - Weekly trade ideas are delivered to your email or text messages in language you can easily understand.
Check out EpicTrades from David Prince and T3 Live. Epic Trades from David Prince
Community - Are you an experienced trader seeking a community of professionals sharing ideas and tactics? Visit The Inner Circle, T3 Live’s most exclusive trading room - designed for elite, experienced traders.
The Inner Circle at T3 Live
Prop Trading - Or perhaps you are tested and ready to explore a career as a professional proprietary trader? 3 Trading Group has the technology and resources you need.
Click here to start the conversation:
T3TradingGroup.com
The Disclosures
***This is NOT financial advice. This is NOT a recommendation to buy, sell, or trade any security. The content presented here is intended for educational purposes only.
Andrew Moss is an associated member of T3 Trading Group, LLC (“T3TG”), an SEC-registered broker/dealer and member of FINRA/SIPC. All trades placed by Mr. Moss are done through T3TG.
Statements in this article represent that person’s opinions only and do not necessarily reflect those of T3TG or any other person associated with T3TG.
Mr. Moss may hold an investment position (or may be contemplating holding an investment position) that is inconsistent with the information provided or the opinion being expressed. This may reflect the financial or other circumstances of the individual, or it may reflect some other consideration. Readers of this article should consider this when evaluating the information provided or the opinions being expressed.
All investments are subject to the risk of loss, which you should consider in making any investment decisions. Readers of this article should consult with their financial advisors, attorneys, accountants, or other qualified investors before making any investment decision.
POSITION DISCLOSURE
June 13, 2024, 4:00 PM
Long: AAPL0714P210, BITO0621C27, IBIT, META, QQQ0618P473, VKTX0621C85
Short:
Options symbols are denoted as follows:
Ticker, Date, Call/Put, Strike Price
Example: VXX1218C30 = VXX 12/18 Call with a $30 strike


