

Stair Stepping Higher
Market Update November 16, 20223
The Markets
Stocks have been climbing (jumping) up out of the cellar since late October and are now above ground level.
Markets moved up quickly from the late October low, consolidated sensibly, and then moved up quickly again. Building a pattern that resembles a staircase.
Now prices are up, staying up, and once again are extended from the equilibrium.
This extension can be resolved in two ways. By time or by price.
So far this week, most indexes (not IWM) are moving through a time correction, just like they did last week. That is, price is moving sideways, marking time, while the 8 and 21-day MAs catch up.
Bull market action.
Let’s look at the charts.
The Charts
SPY now has two days of opening and closing action above the recent gap-up day. Incredibly bullish price action. Continuation sideways just under the $451 pivot level until the 8-day MA catches up would give a high likelihood of another explosive move higher. Note that this action is taking place before RSI gets to the technically overbought reading of > 70.

QQQ is following the same sequence, only it’s doing so inches away from the all-time high. Not the type of thing you see in a bear market rally.

IWM even the small caps are holding up strongly. They moved further and faster than large caps on the recent rise. So it’s no surprise that they are correcting a little further on the downside. This is a price correction, as opposed to the time corrections seen above.

DIA is following the same playbook as its large-cap friends.

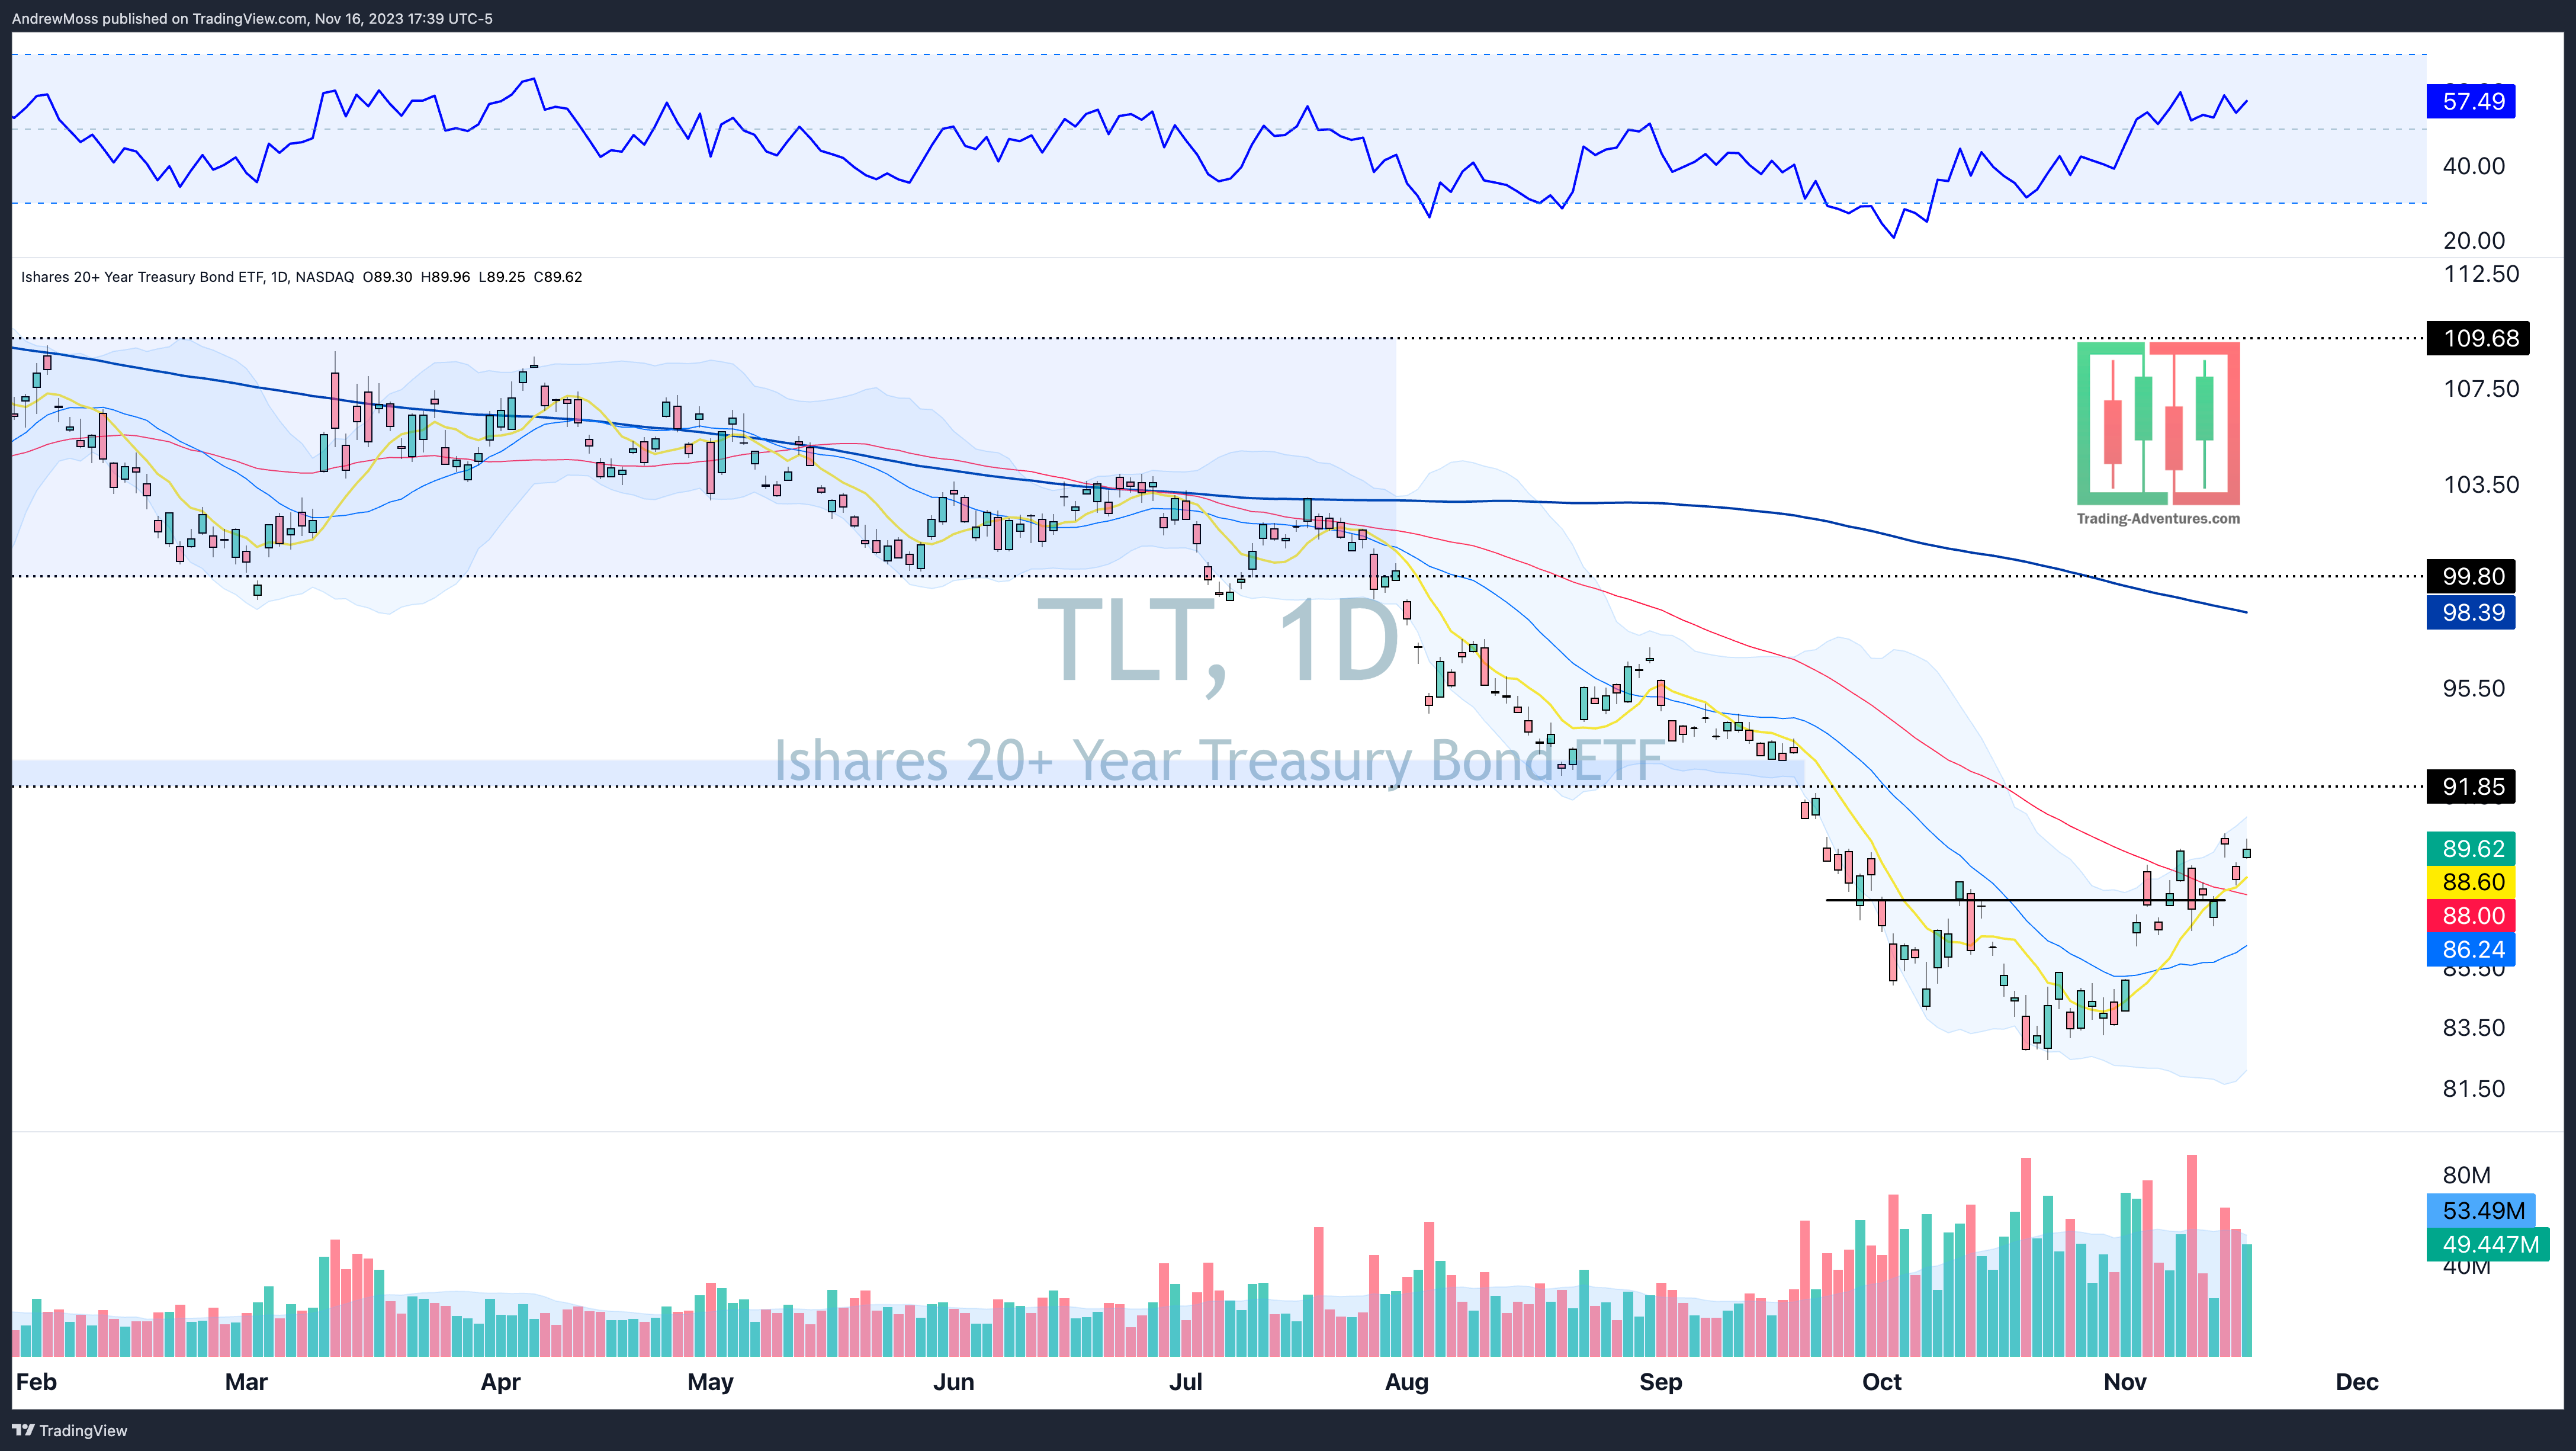
TLT is moving further through this bottoming process.
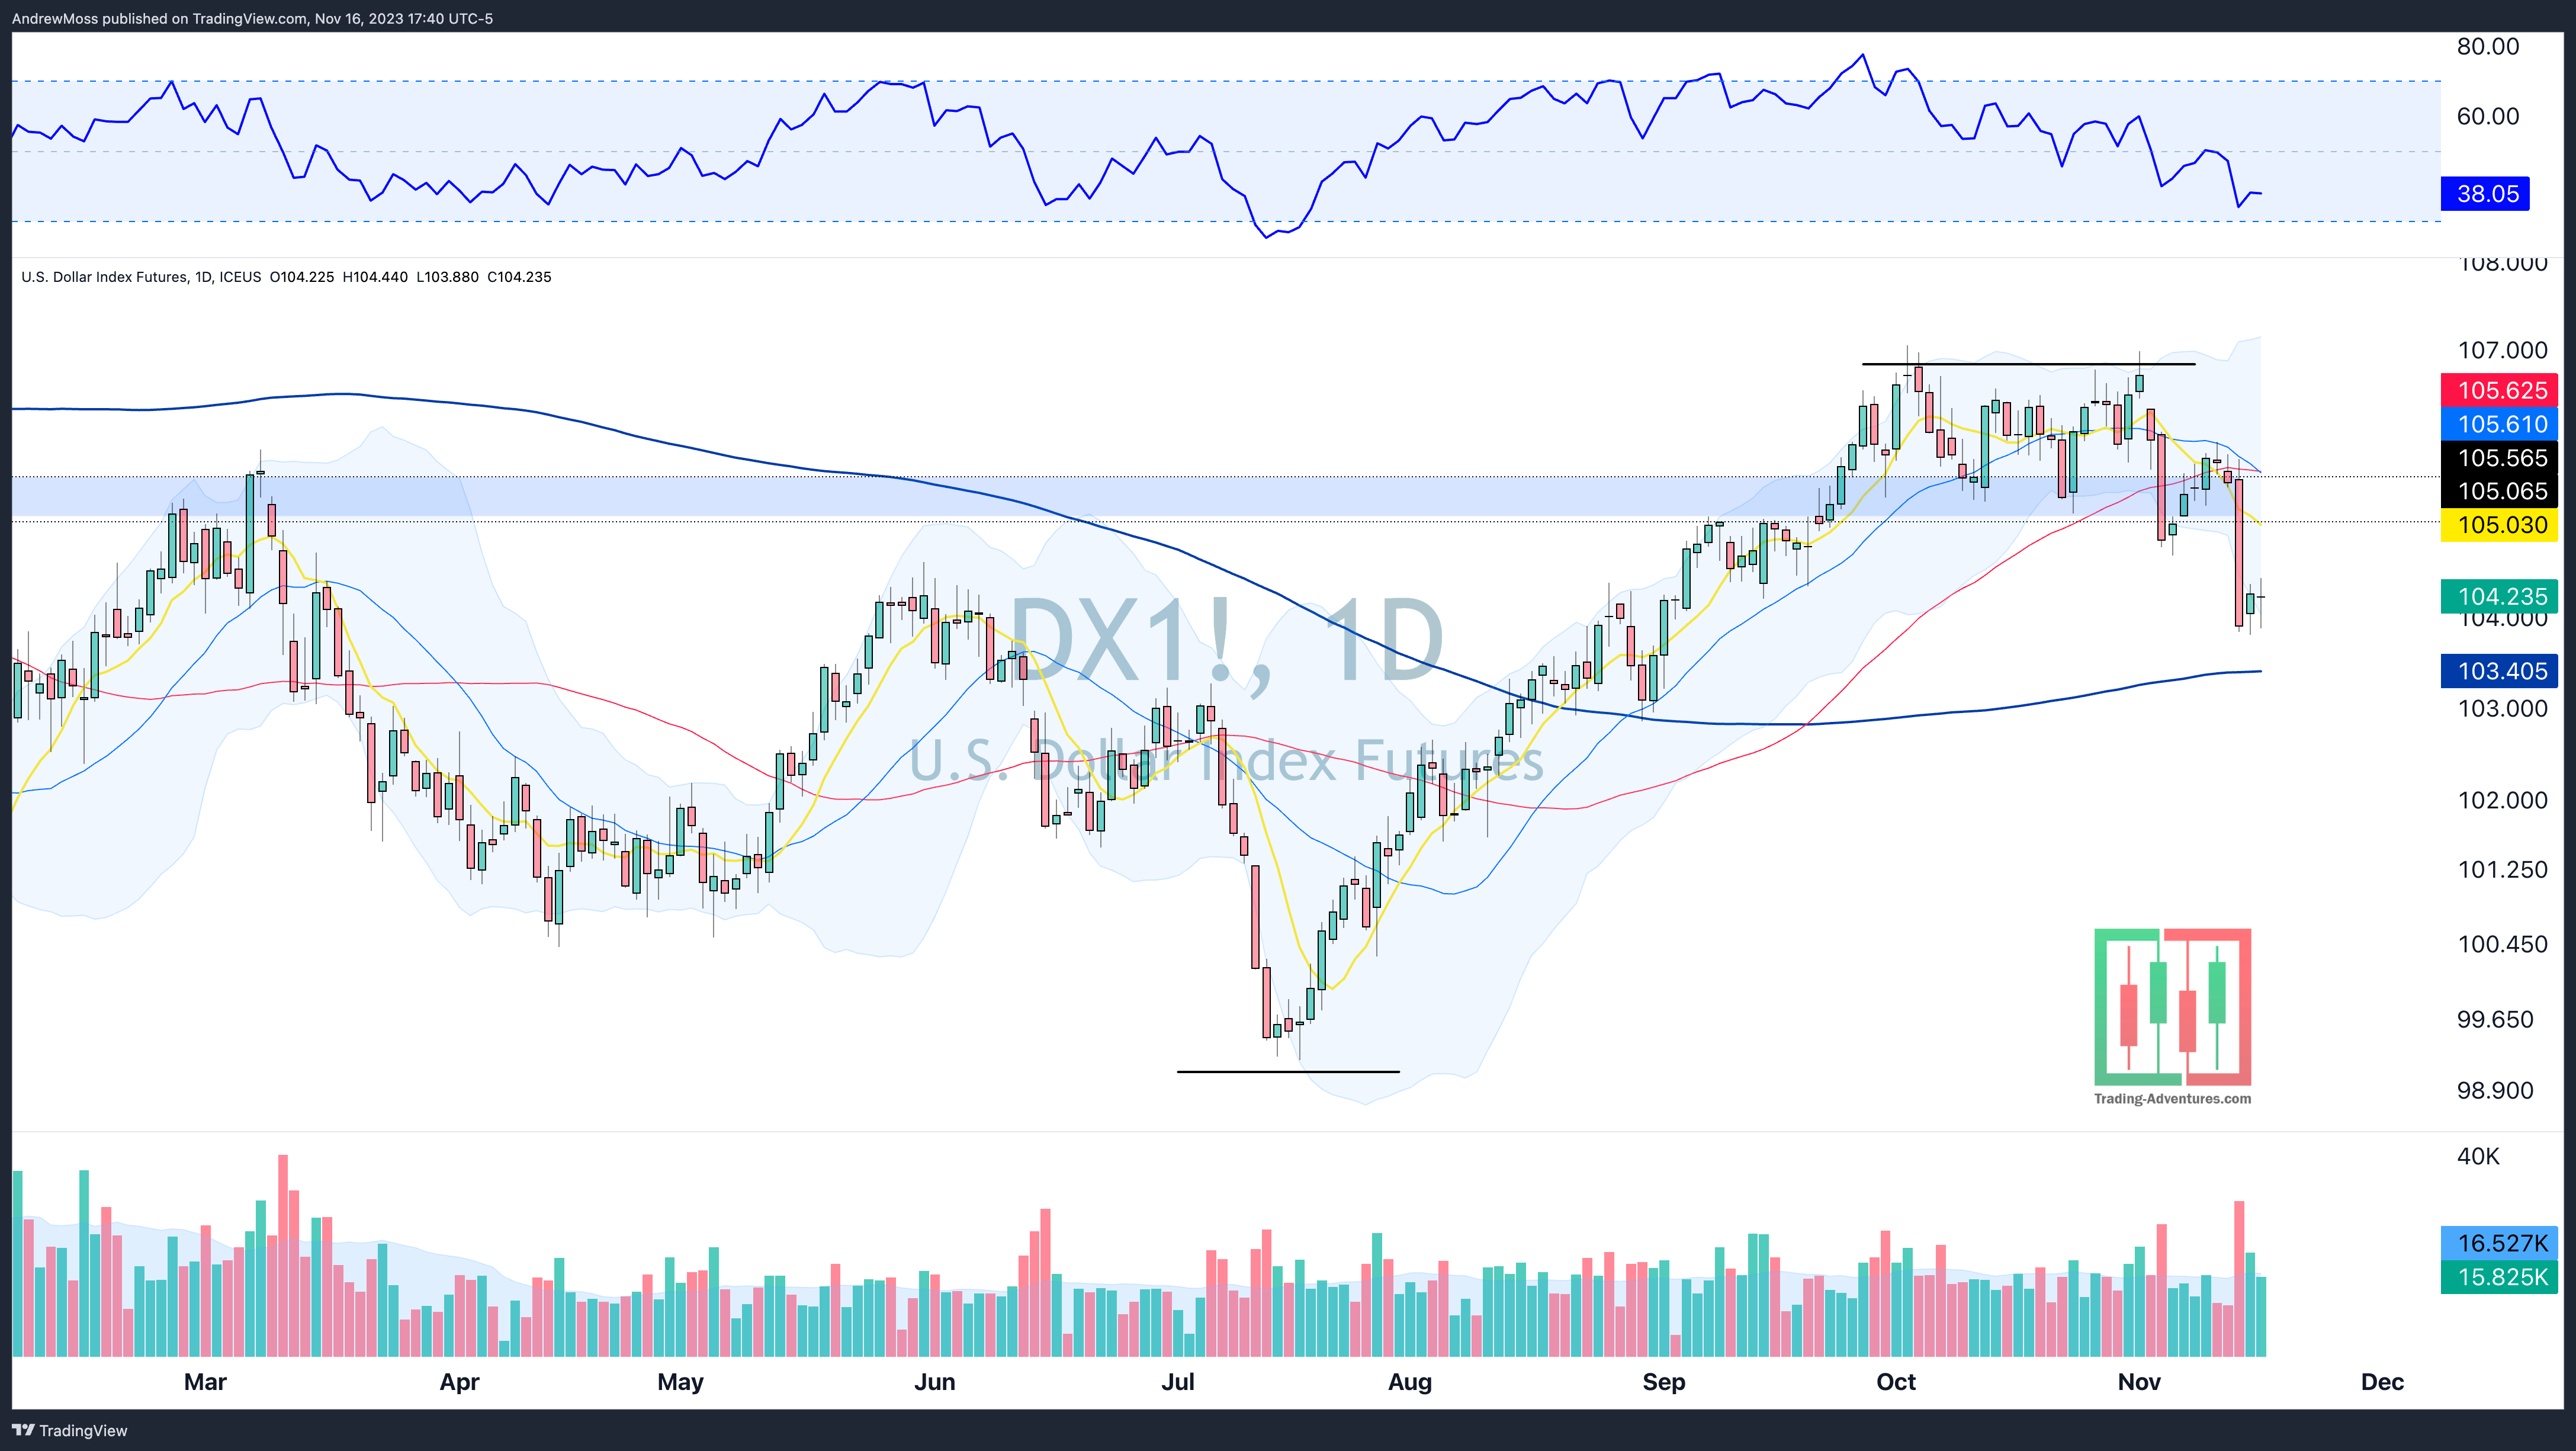
DXY is doing the opposite of stocks - staying lower in a bearish consolidation pattern.
The Closing Bell
Stocks continue their bullish behavior. And they're doing so right on time and in tune with the typical seasonal tendencies.
This is bull market action and we’ll do well to treat it that way. When the action changes, we will recognize and adapt.
Either way,
Only price pays.
Keep it simple. Focus there and tune out the noise.
See you all Saturday morning with the Weekly Charts.
The Disclosures
***This is NOT financial advice. NOT a recommendation to buy, sell, or trade any security. The content presented here is intended for educational purposes only.
Andrew Moss is an associated member of T3 Trading Group, LLC (“T3TG”) a SEC registered broker/dealer and member of FINRA/SIPC. All trades placed by Mr. Moss are done through T3TG.
Statements in this article represent the opinions of that person only and do not necessarily reflect the opinions of T3TG or any other person associated with T3TG.
It is possible that Mr. Moss may hold an investment position (or may be contemplating holding an investment position) that is inconsistent with the information provided or the opinion being expressed. This may reflect the financial or other circumstances of the individual or it may reflect some other consideration. Readers of this article should take this into account when evaluating the information provided or the opinions being expressed.
All investments are subject to the risk of loss, which you should consider in making any investment decisions. Readers of this article should consult with their financial advisors, attorneys, accountants, or other qualified investors prior to making any investment decision.
POSITION DISCLOSURE
Novemver 16, 2023, 4:00 PM
Long: AMZN, IWM, IWM1215C180, LABU, XBI1215C72
Short:
Options symbols are denoted as follows:
Ticker, Date, Call/Put, Strike Price
Example: VXX1218C30 = VXX 12/18 Call with a $30 strike