Stocks are teetering
Midweek Market Update March 1, 2023
The Market
It’s the first day of March. Basketball madness is near and spring is coming.
Stocks however are doing anything but springing. For the second time in 4 days, the SP500 has touched its 200-day moving average as it teeters on the edge of a move in one direction or another.
The lack of action is frustrating many.
Earnings season is winding down. There hasn’t been any groundbreaking economic news. SPX volume on 12 of 19 trading days in February was below average (rolling 20 days). And the average daily range has compressed as well.
It almost feels like August when many are on vacation and away from the trading desks.
No news is good news? Or is this a calm before the storm?
Let’s see what the charts show.
The Charts
SPX - SP 500 stocks on average aren’t doing much. That includes not breaking down. So far SPX is still above the December low anchored VWAP and the 200-day MA, which is trying to curl up.
QQQ is also riding along the upper side of the 200-day MA, which is converging with the December low AVWAP.
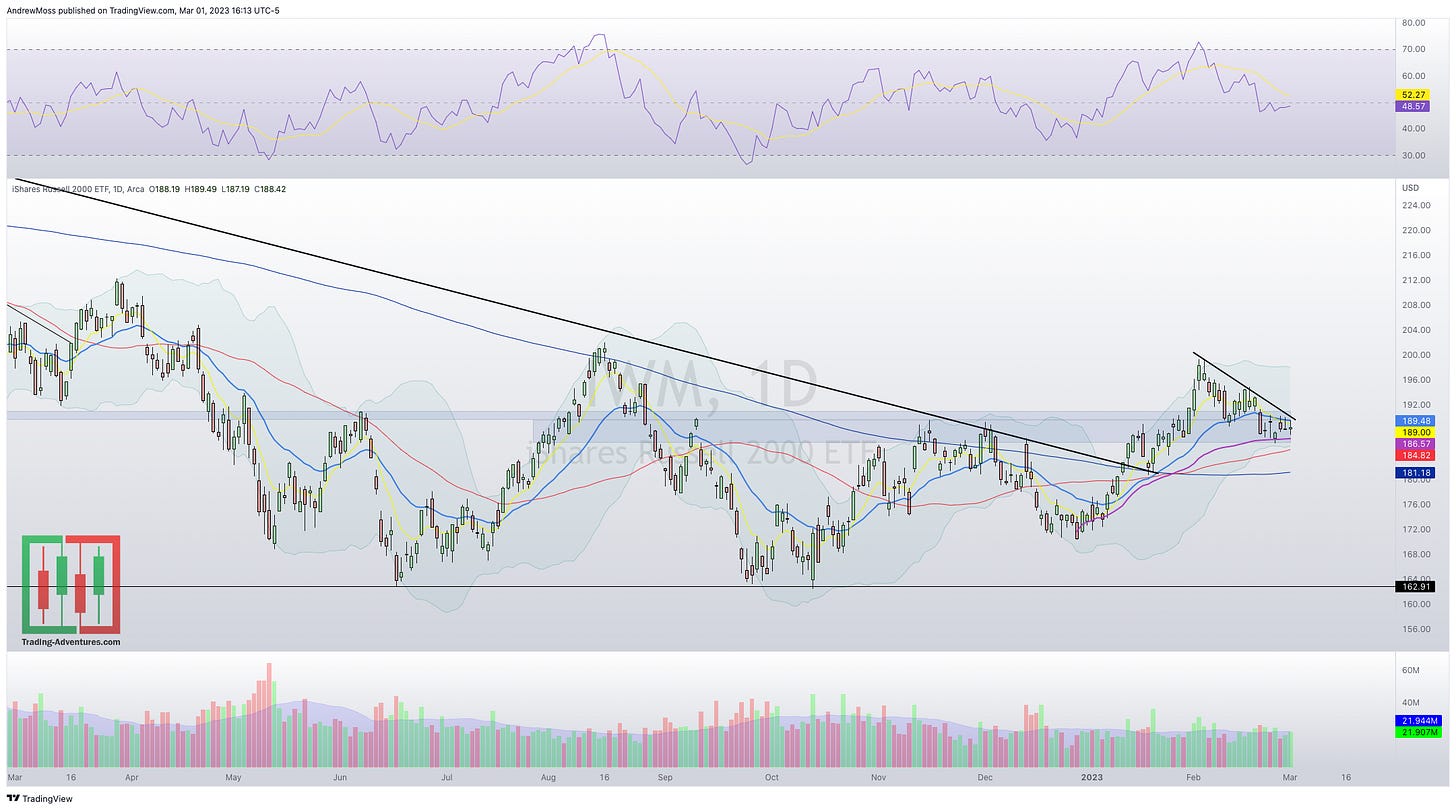
IWM is still in the congestion zone. A move out of this area in either direction should be telling.
DIA The Dow 30 trying to find some support just above the 200-day MA.
DXY The Dollar continues to be a dominant factor. It’s down from the recent high, but apparently, stocks would like it to go much lower.
VIX Volatility remains subdued.
Taking a look at the bigger picture reveals a couple of potential concerns.
TLT 20-Year Treasuries
TNX 10-year yields
These are actually two parts of the same concern.
The bad news scenario here would be bonds down, and rates up. Higher costs of borrowing threaten growth companies and will hamper profitability. So the rate of inflation and the federal reserve rate aren’t the only ones being watched.
The rest of the monthly charts can be found here.
That’s it for today.
TSLA is having an investor day this afternoon so we’ll see if that can act as a catalyst to tip things in one direction.
More on that later in the week.
***This is NOT financial advice. NOT a recommendation to buy, sell, or trade any security. The content presented here is intended for educational purposes only.
Andrew Moss is an associated member of T3 Trading Group, LLC (“T3TG”) a SEC registered broker/dealer and member of FINRA/SIPC. All trades placed by Mr. Moss are done through T3TG.
Statements in this article represent the opinions of that person only and do not necessarily reflect the opinions of T3TG or any other person associated with T3TG.
It is possible that Mr. Moss may hold an investment position (or may be contemplating holding an investment position) that is inconsistent with the information provided or the opinion being expressed. This may reflect the financial or other circumstances of the individual or it may reflect some other consideration. Readers of this article should take this into account when evaluating the information provided or the opinions being expressed.
All investments are subject to risk of loss, which you should consider in making any investment decisions. Readers of this article should consult with their financial advisors, attorneys, accountants or other qualified investors prior to making any investment decision.
POSITION DISCLOSURE
March 1, 2023 4:00 PM
Long:
Short:
Options symbols are denoted as follows:
Ticker, Date, Call/Put, Strike Price
Example: VXX1218C30 = VXX 12/18 Call with a $30 strike


