Stretched Thin
Market Update for Tuesday, February 11, 2025

The Markets
Hanging out with the President, advising DOGE, digging tunnels (The Boring Company), launching rockets (SpaceX), planning a trip to Mars (Starbase), connecting the world (Starlink), building robots (Optimus), implanting computers into humans (Neuralink), building electric cars with full self-driving capability (Tesla), creating an AI solution (xAI - Grok), bidding for ChatGPT owner OpenAI, saving free speech (X.com), changing his name (on X to antagonize the critics), and posting four thousand times a day.
This is not a commentary on the perceived merits or faults of the individual. It’s not an opinion piece about Elon Musk or a debate about what he should and shouldn’t be doing.
It’s just a list. And a rather lengthy one, at that.
While this list grows, the stock shrinks.
Is he stretched too thin?
That’s the story having an effect. How can Elon run Tesla when he’s got so many other irons in the fire?
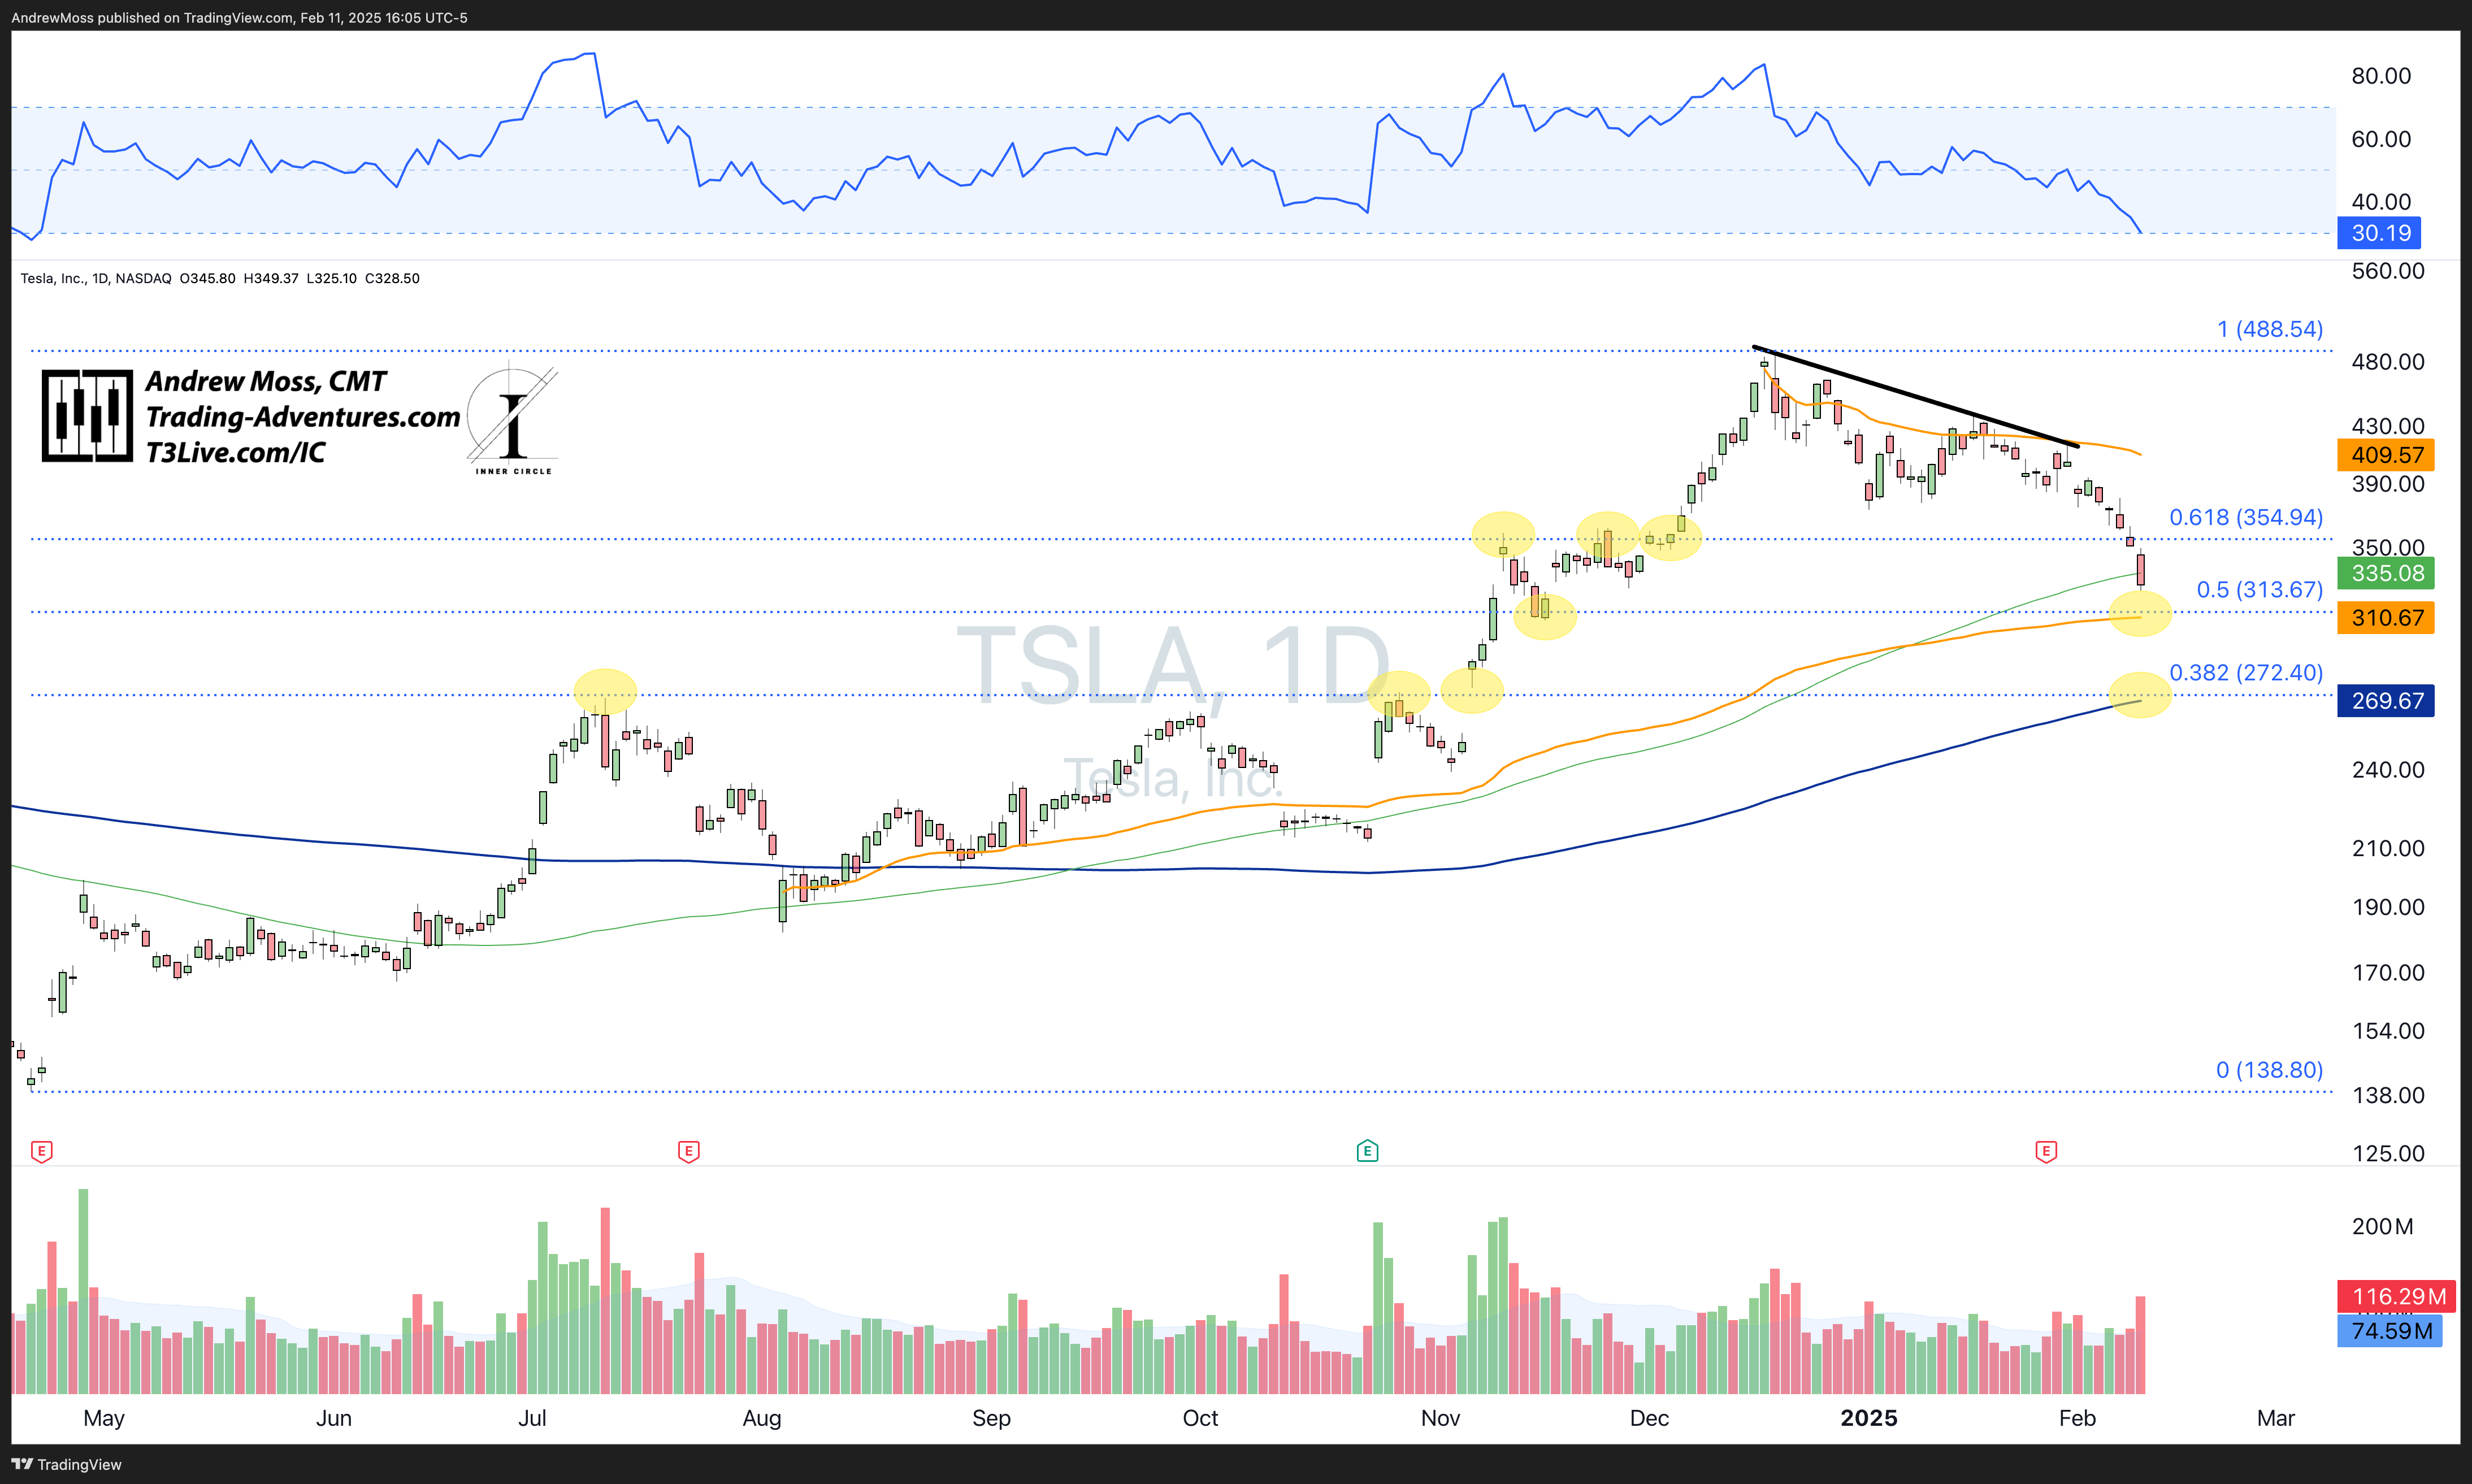
Today, all eyes were on the 100-day MA as TSLA kept selling off. This is a reminder of why we look to identify potential support and resistance levels. The stock showed no regard for the green line on the chart as it kept moving lower and lower to finish the day down -6.34%. It's now down more than -32% from the highs of December 2024.
Looking ahead for more potential support areas, notice how the price behaved at various Fibonacci levels during its recent rise and fall. Using this precedent, it makes sense to keep an eye on ~$310-$313, the 50% retracement and a pivot low anchored VWAP, and then ~$269-$272, the 68.2% retracement level and the 200-day MA.
The Charts
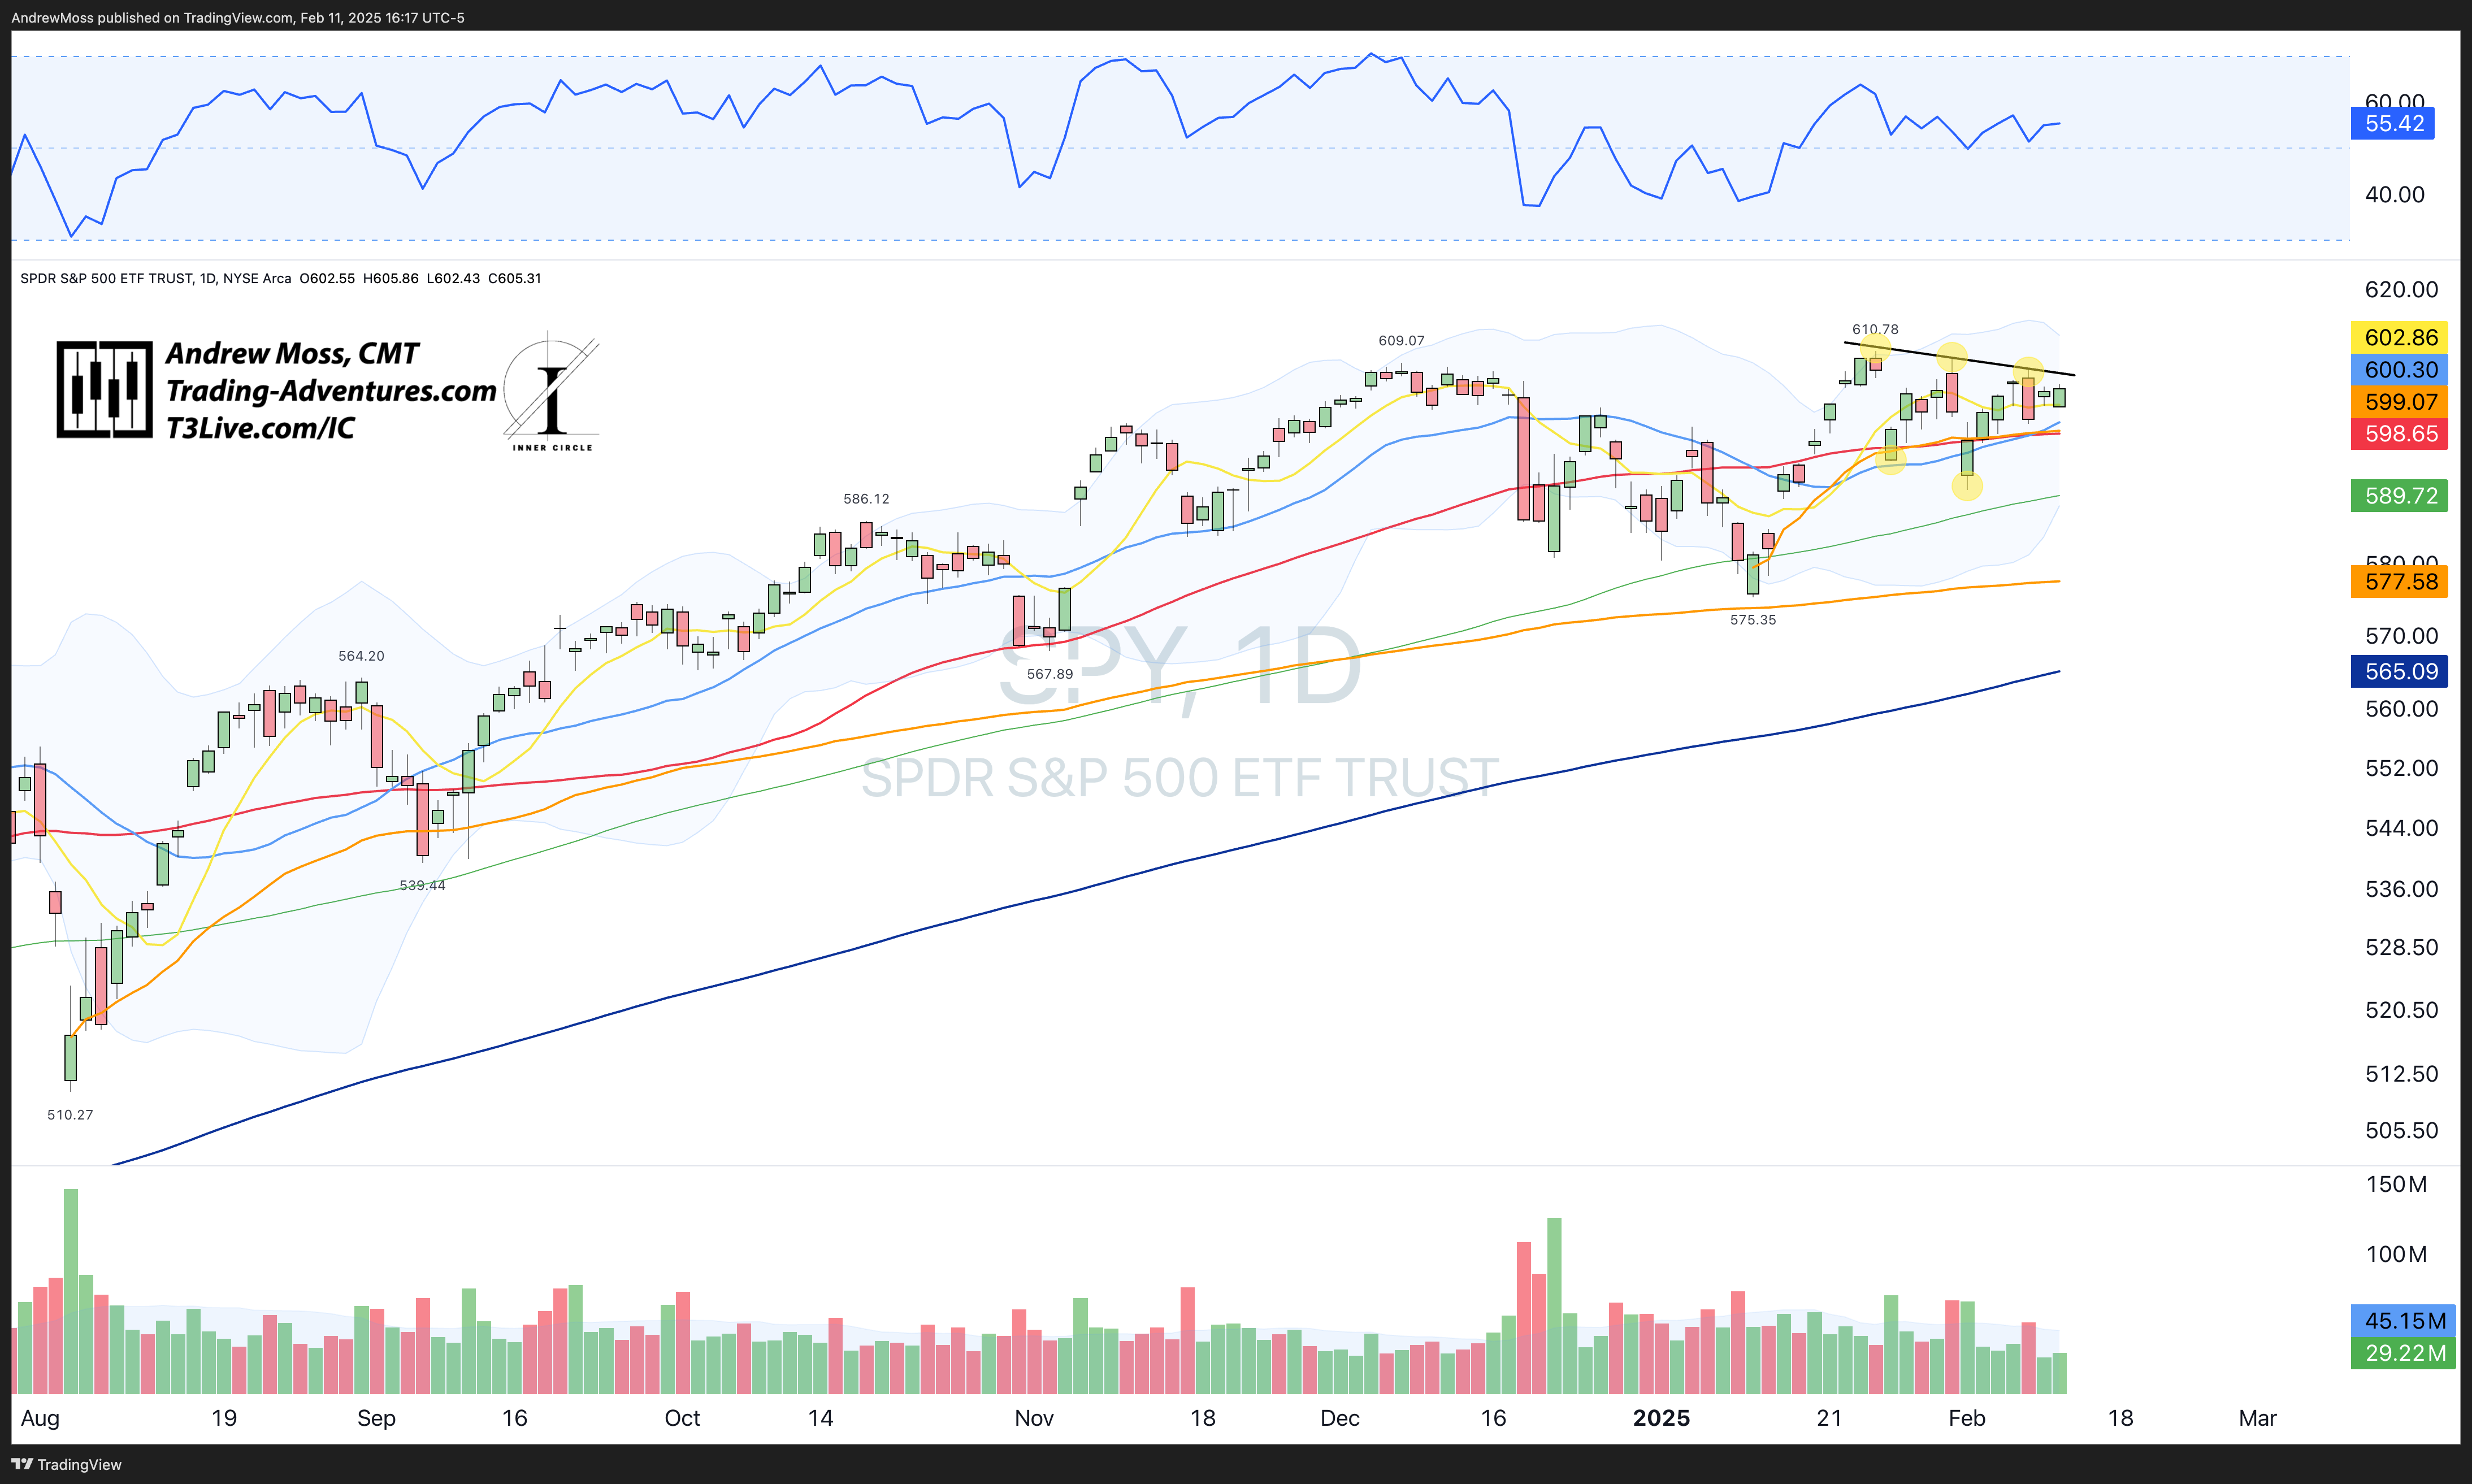
SPY is still above all the key moving averages and in a sequence of lower highs and lower lows. The consolidation continues to be bound by a short-term trendline above (connecting those lower highs, the last of which took place at $608.13) and a confluence of indicators below with the 21 and 50-day MAs and an AVWAP all near ~$598-$600. Watch for a move beyond those levels to signal a resolution.
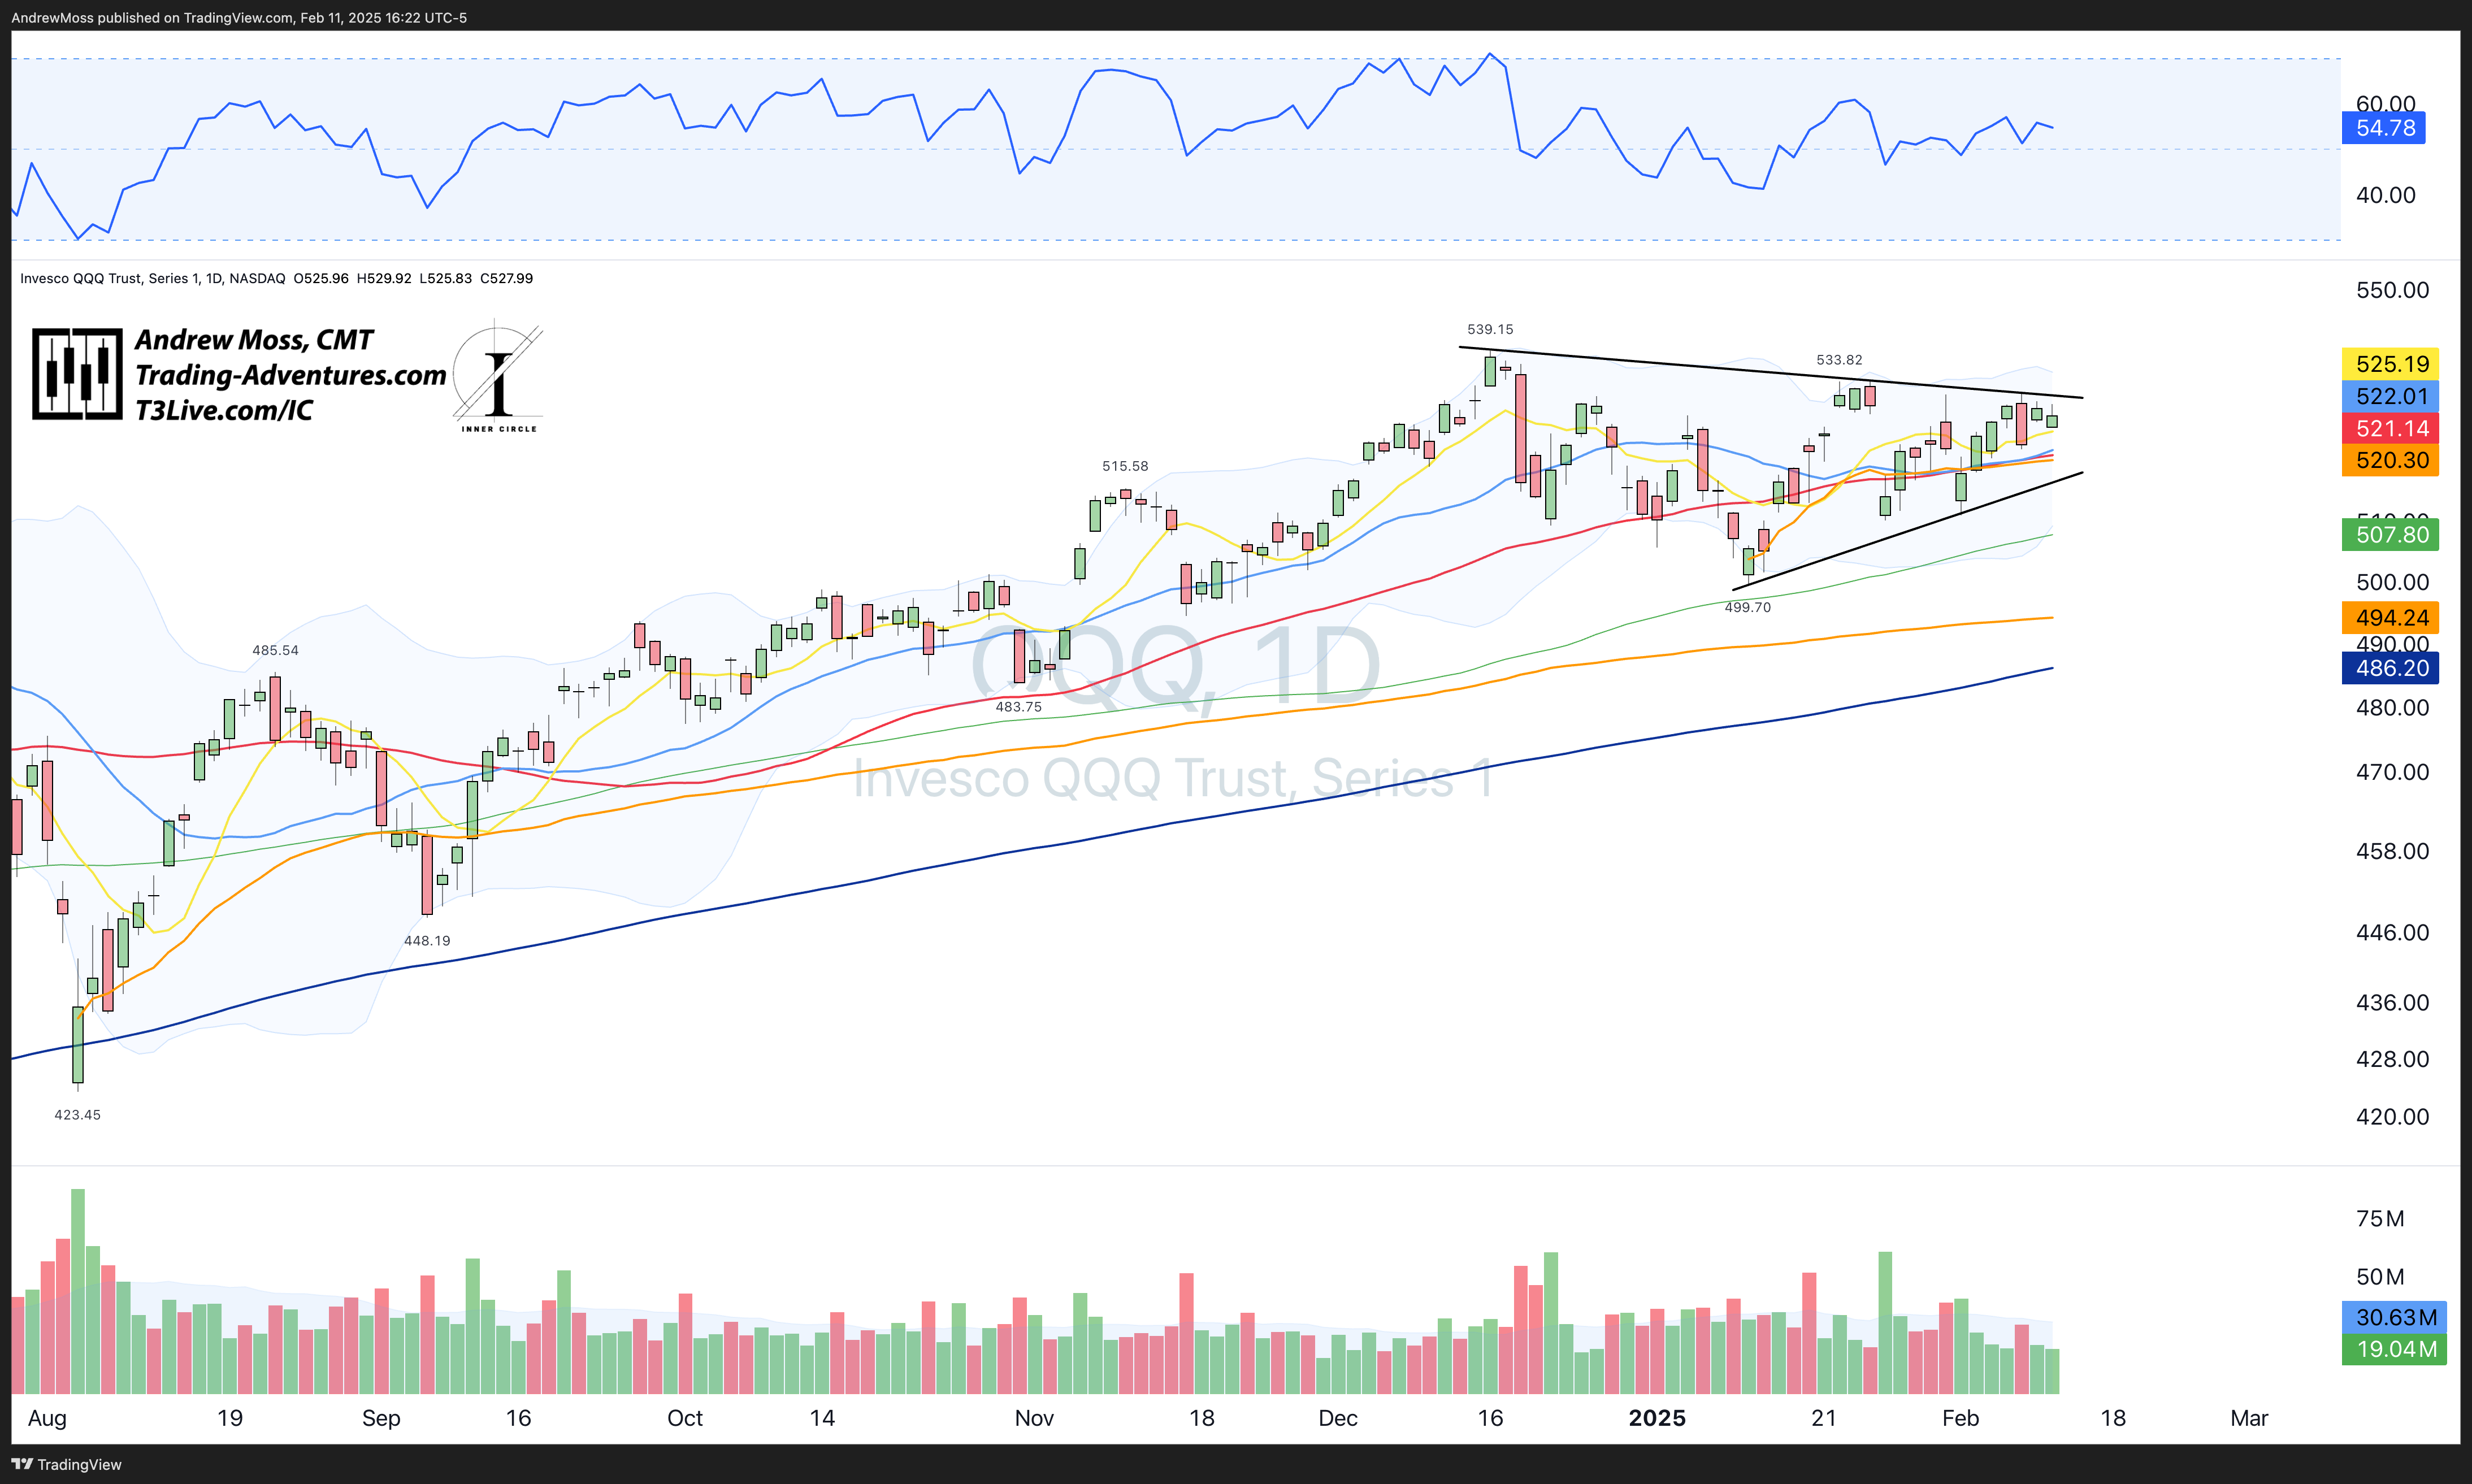
QQQ has boundaries at the most recent pivot high of $532.10 and the same indicators - 21 and 50-day MAs and an AVWAP near ~$520-$522.
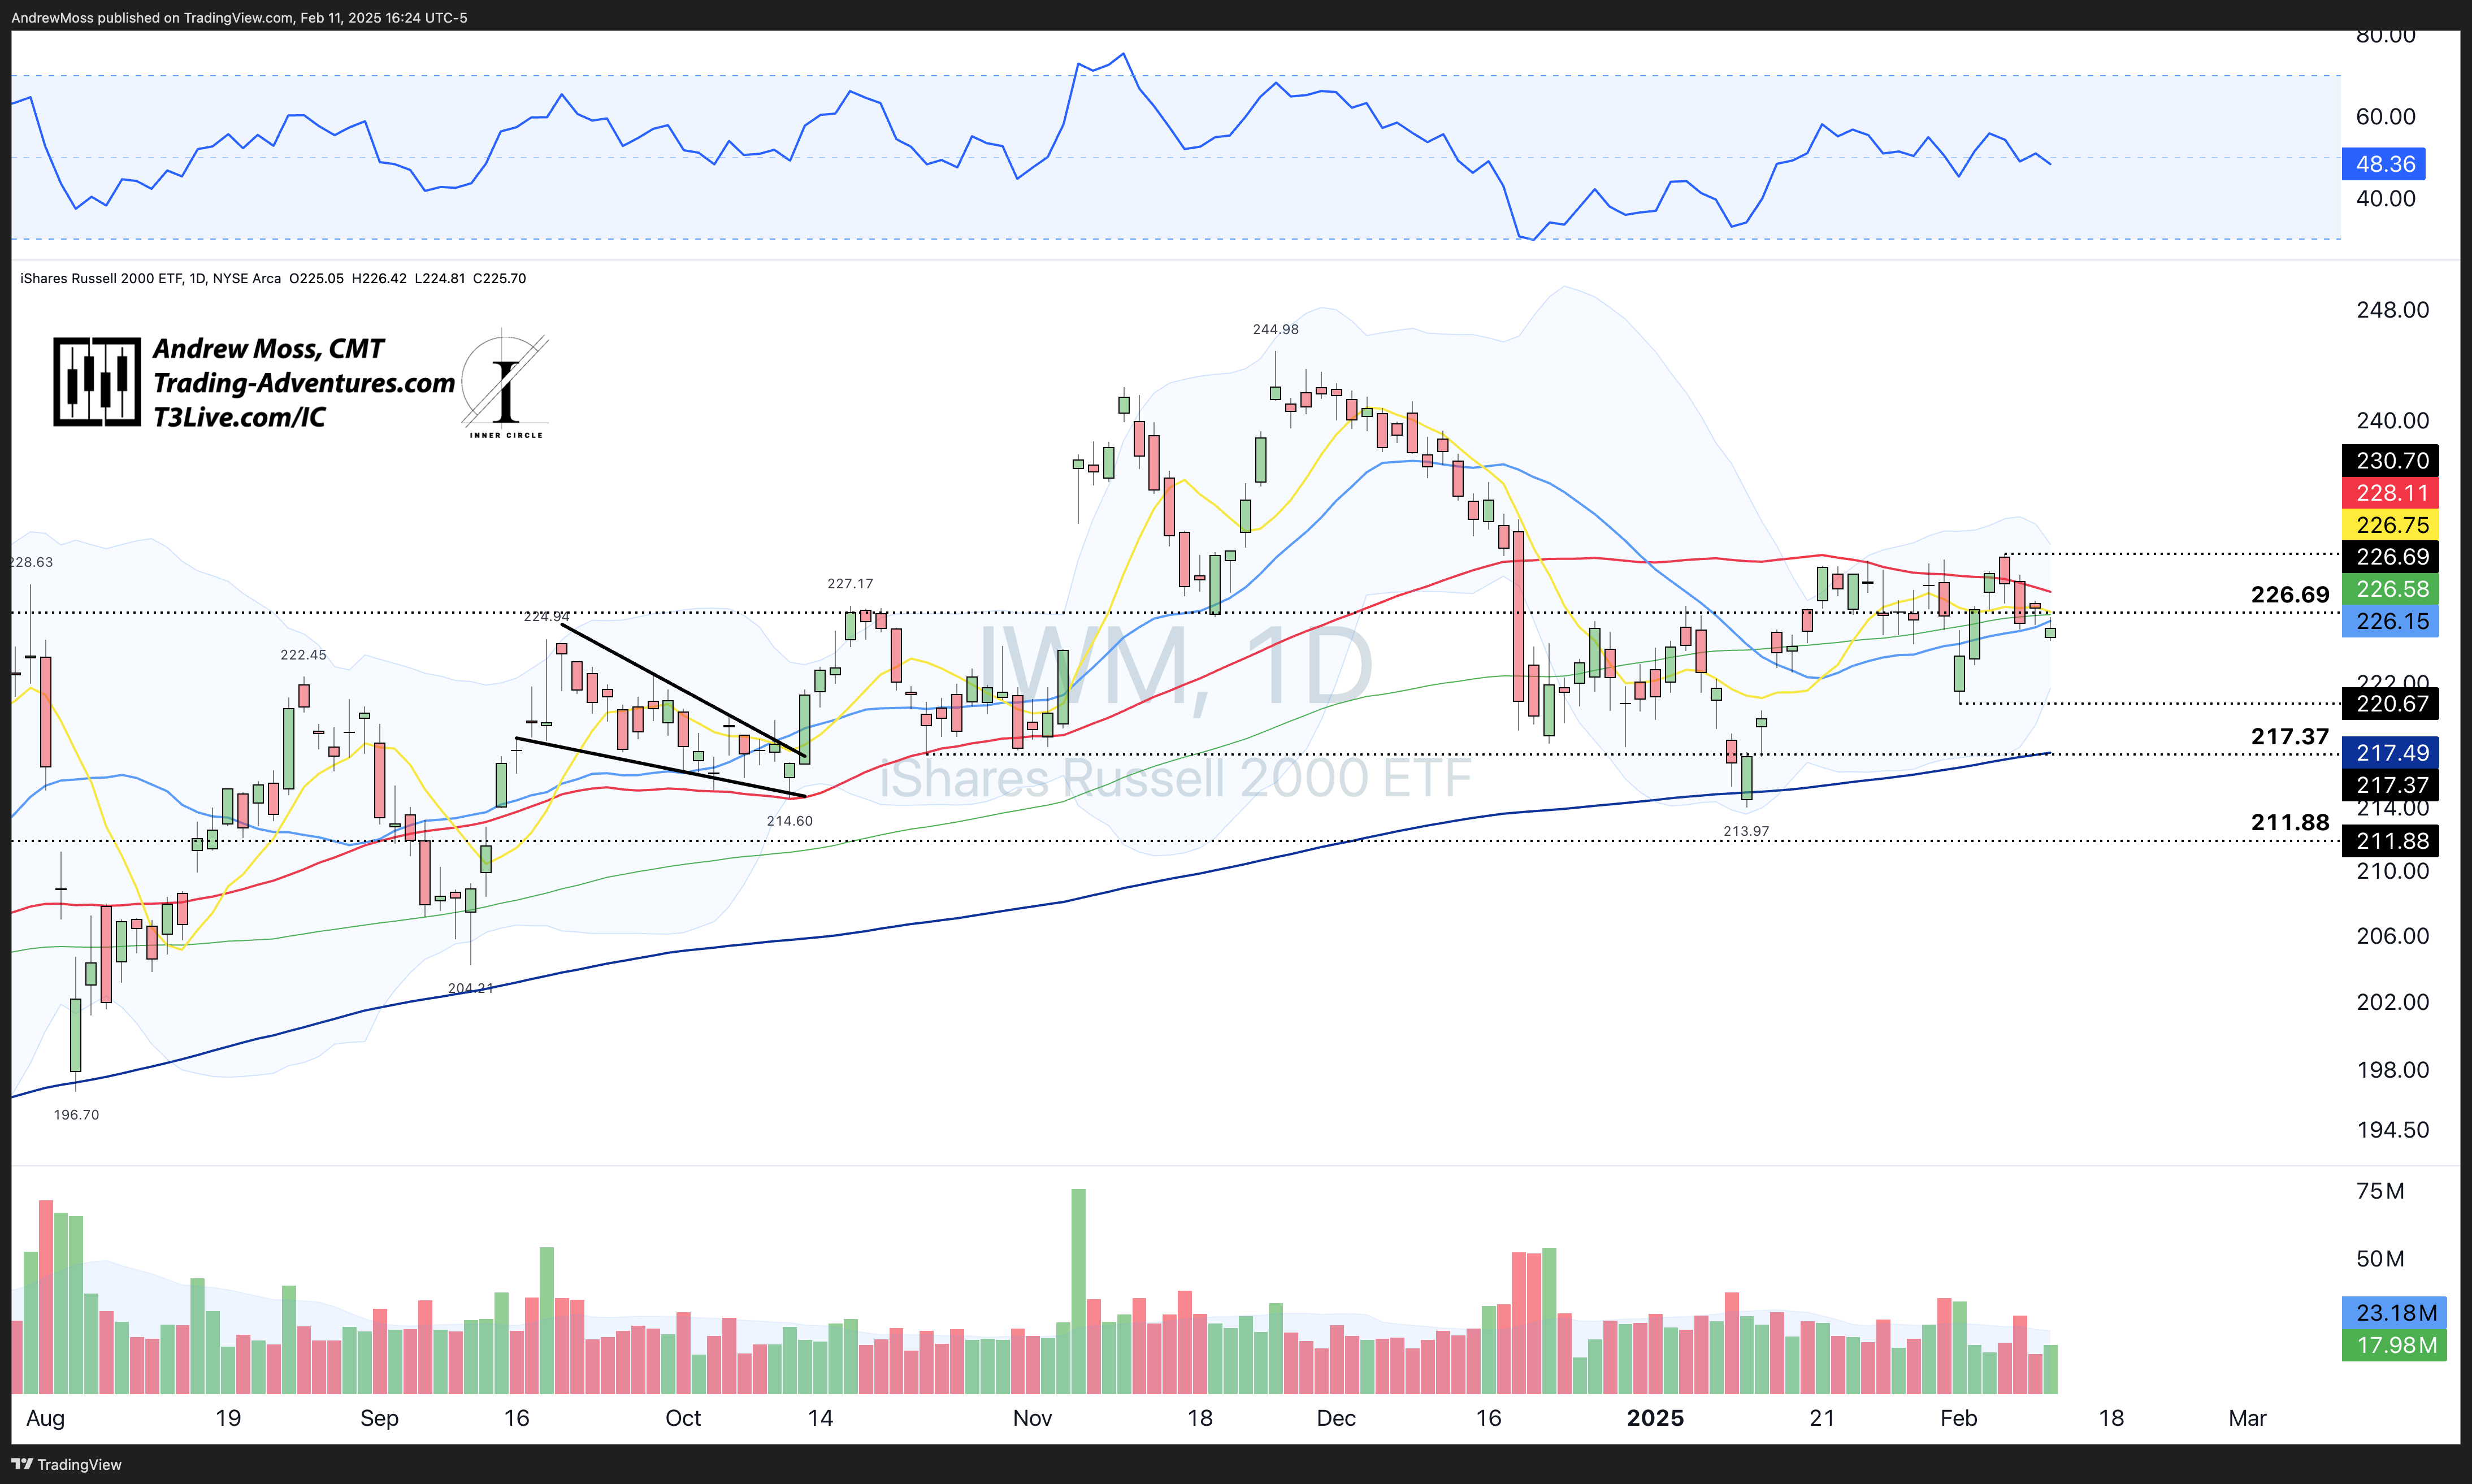
IWM lost the battle and is below all but its 200-day MA. There is room to roughly $220 and the $217 below — pivots and the 200-day MA.
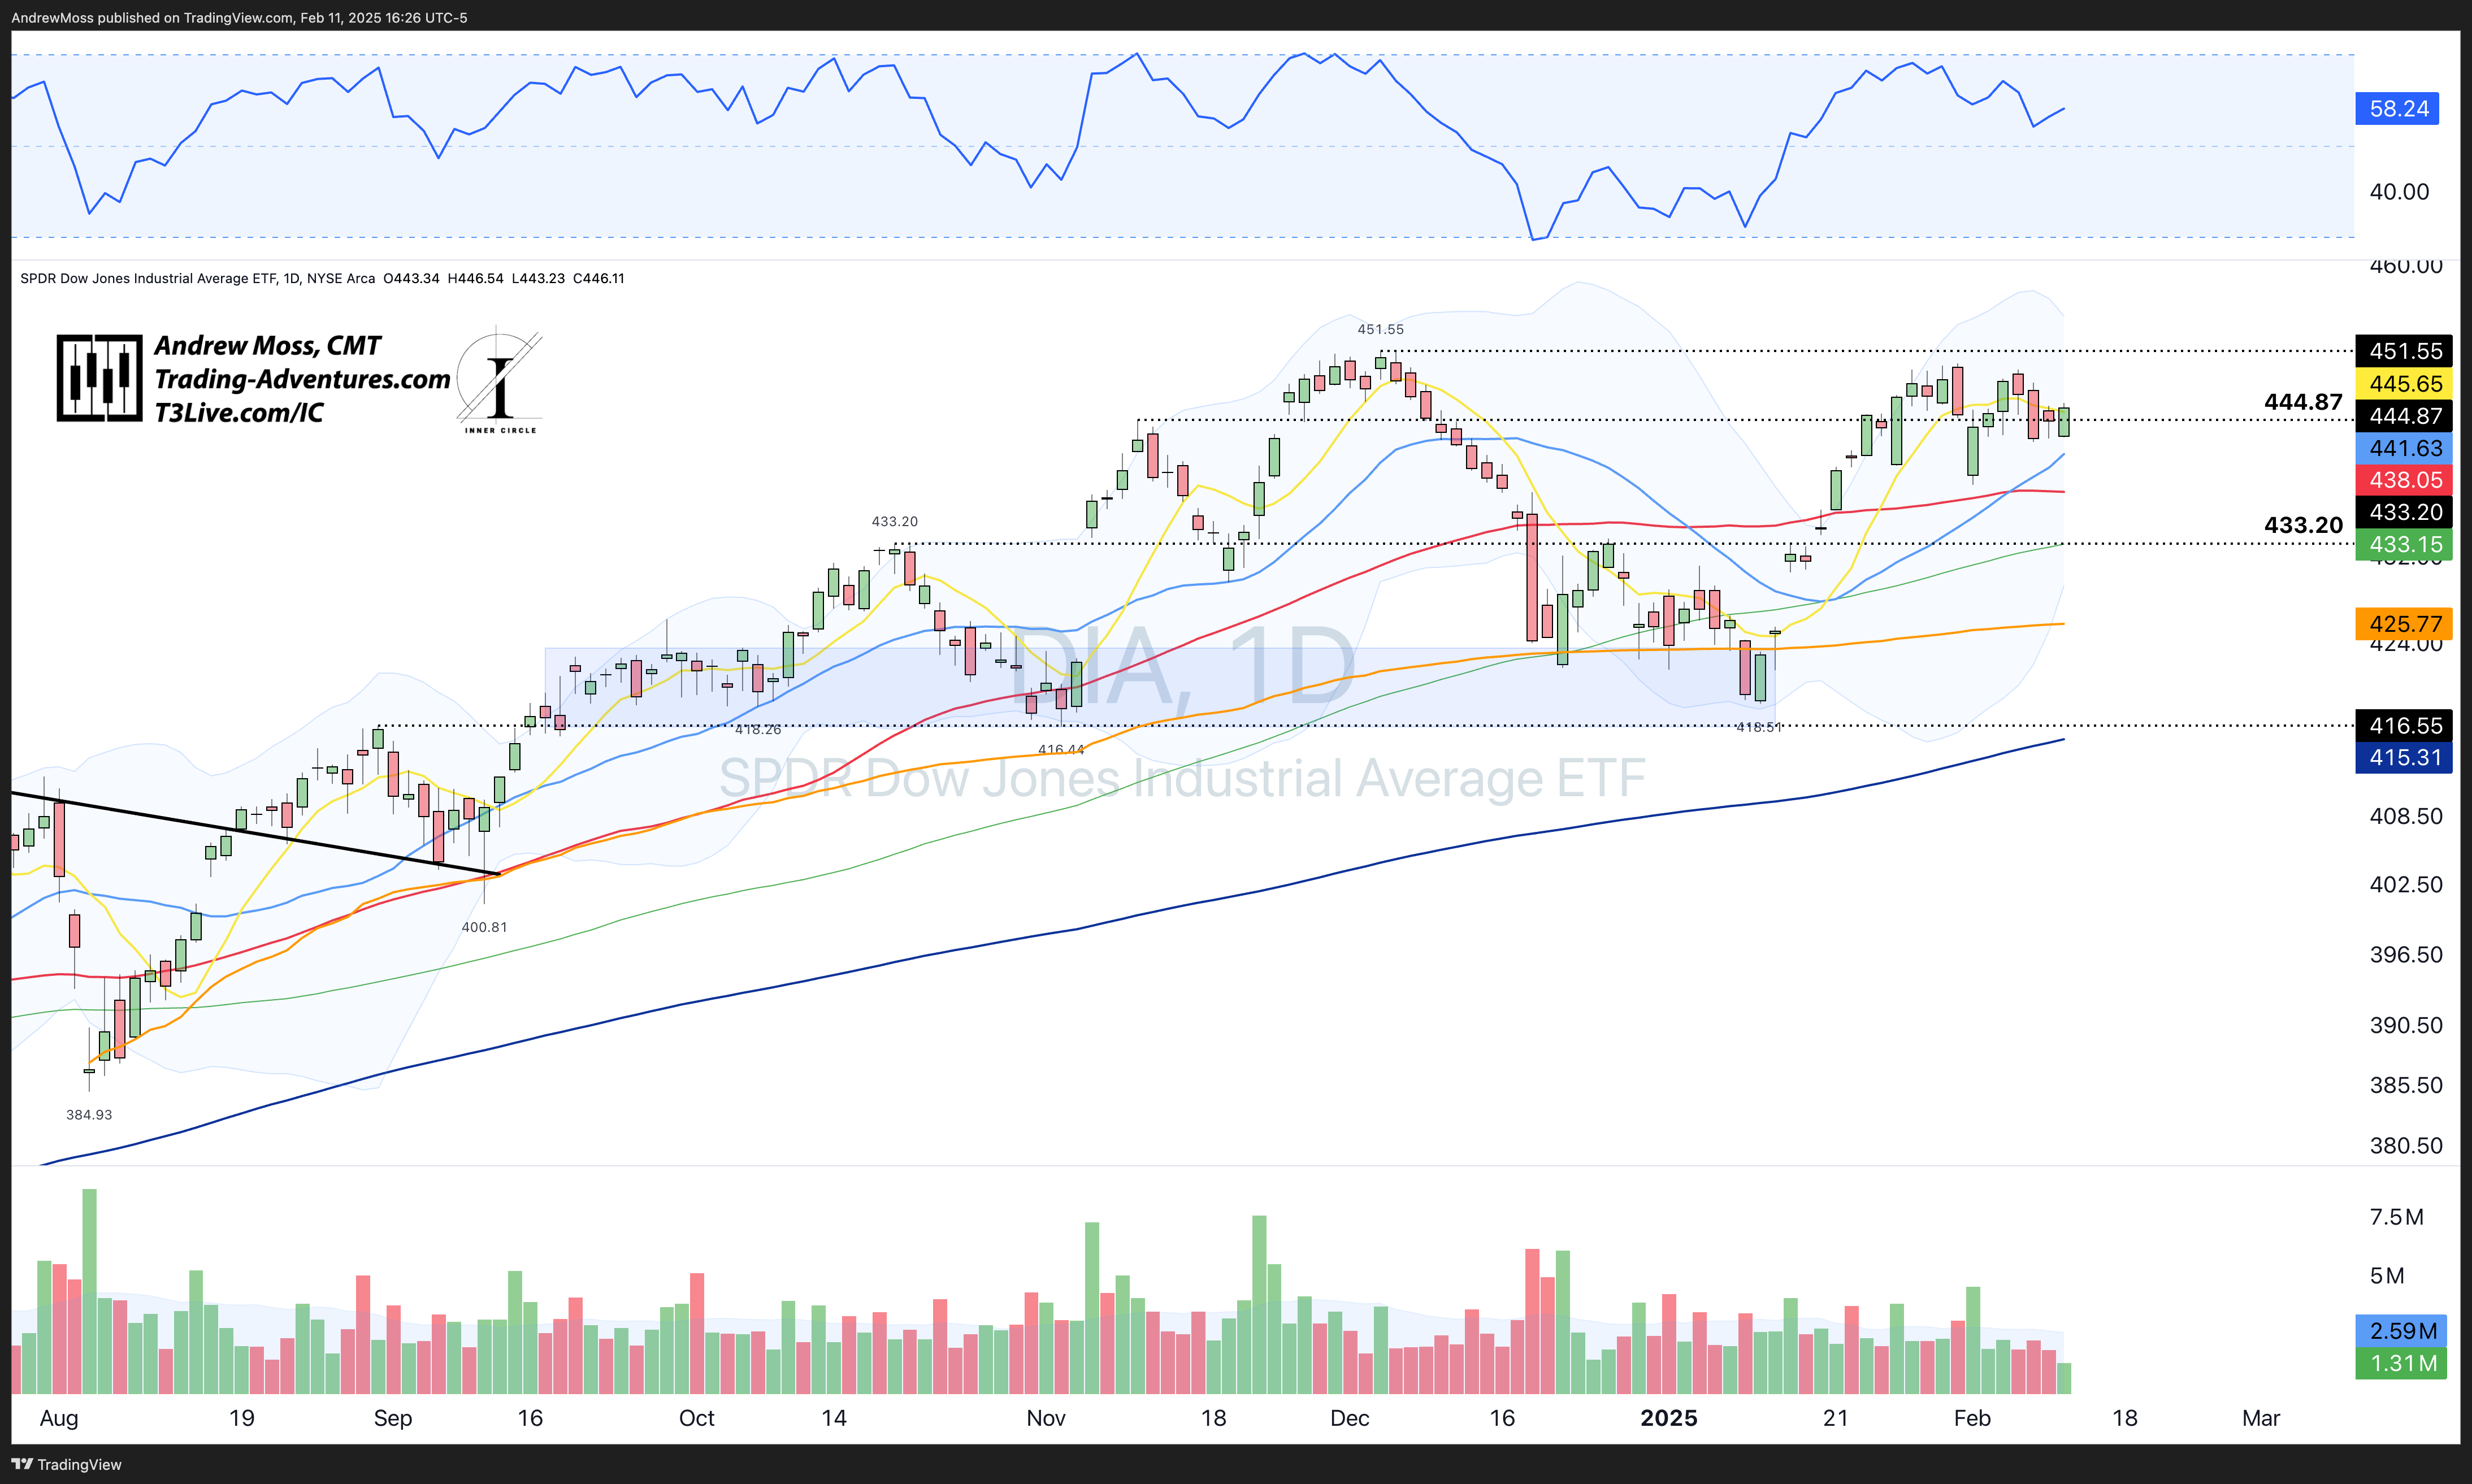
DIA - Erratic, sideways action just under pivot highs.
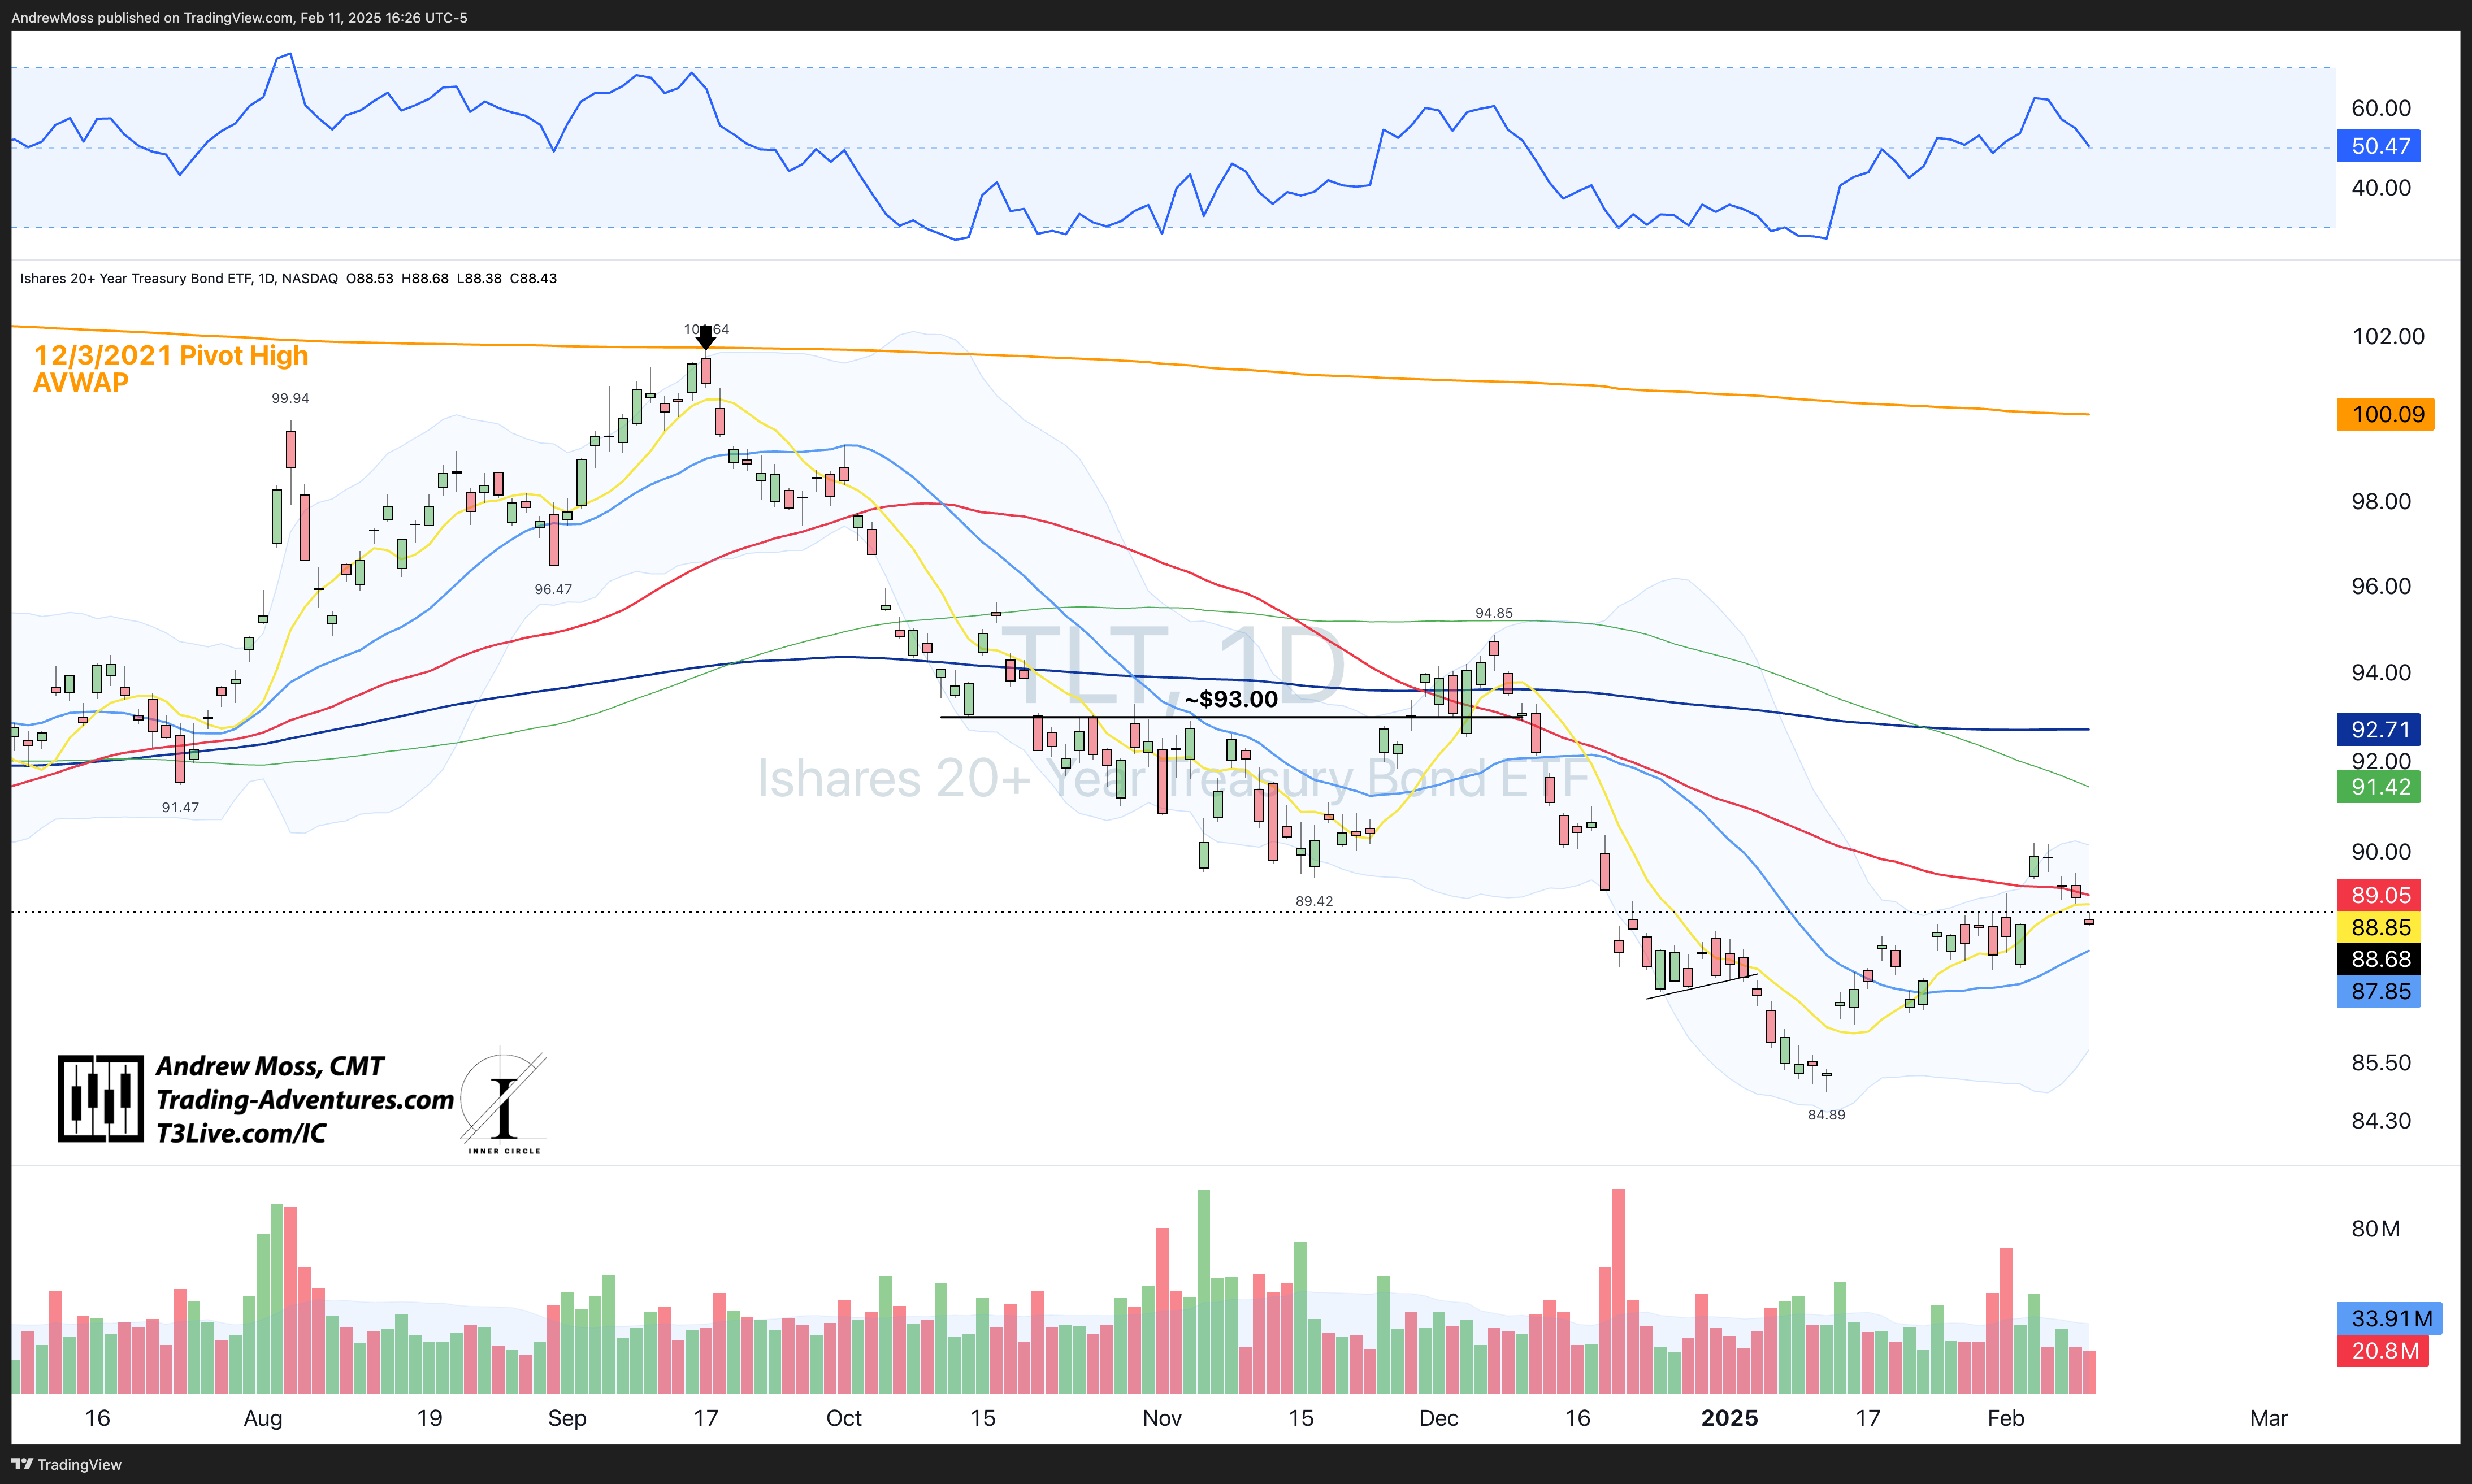
TLT could not stay above the pivot level and 50-day MA.
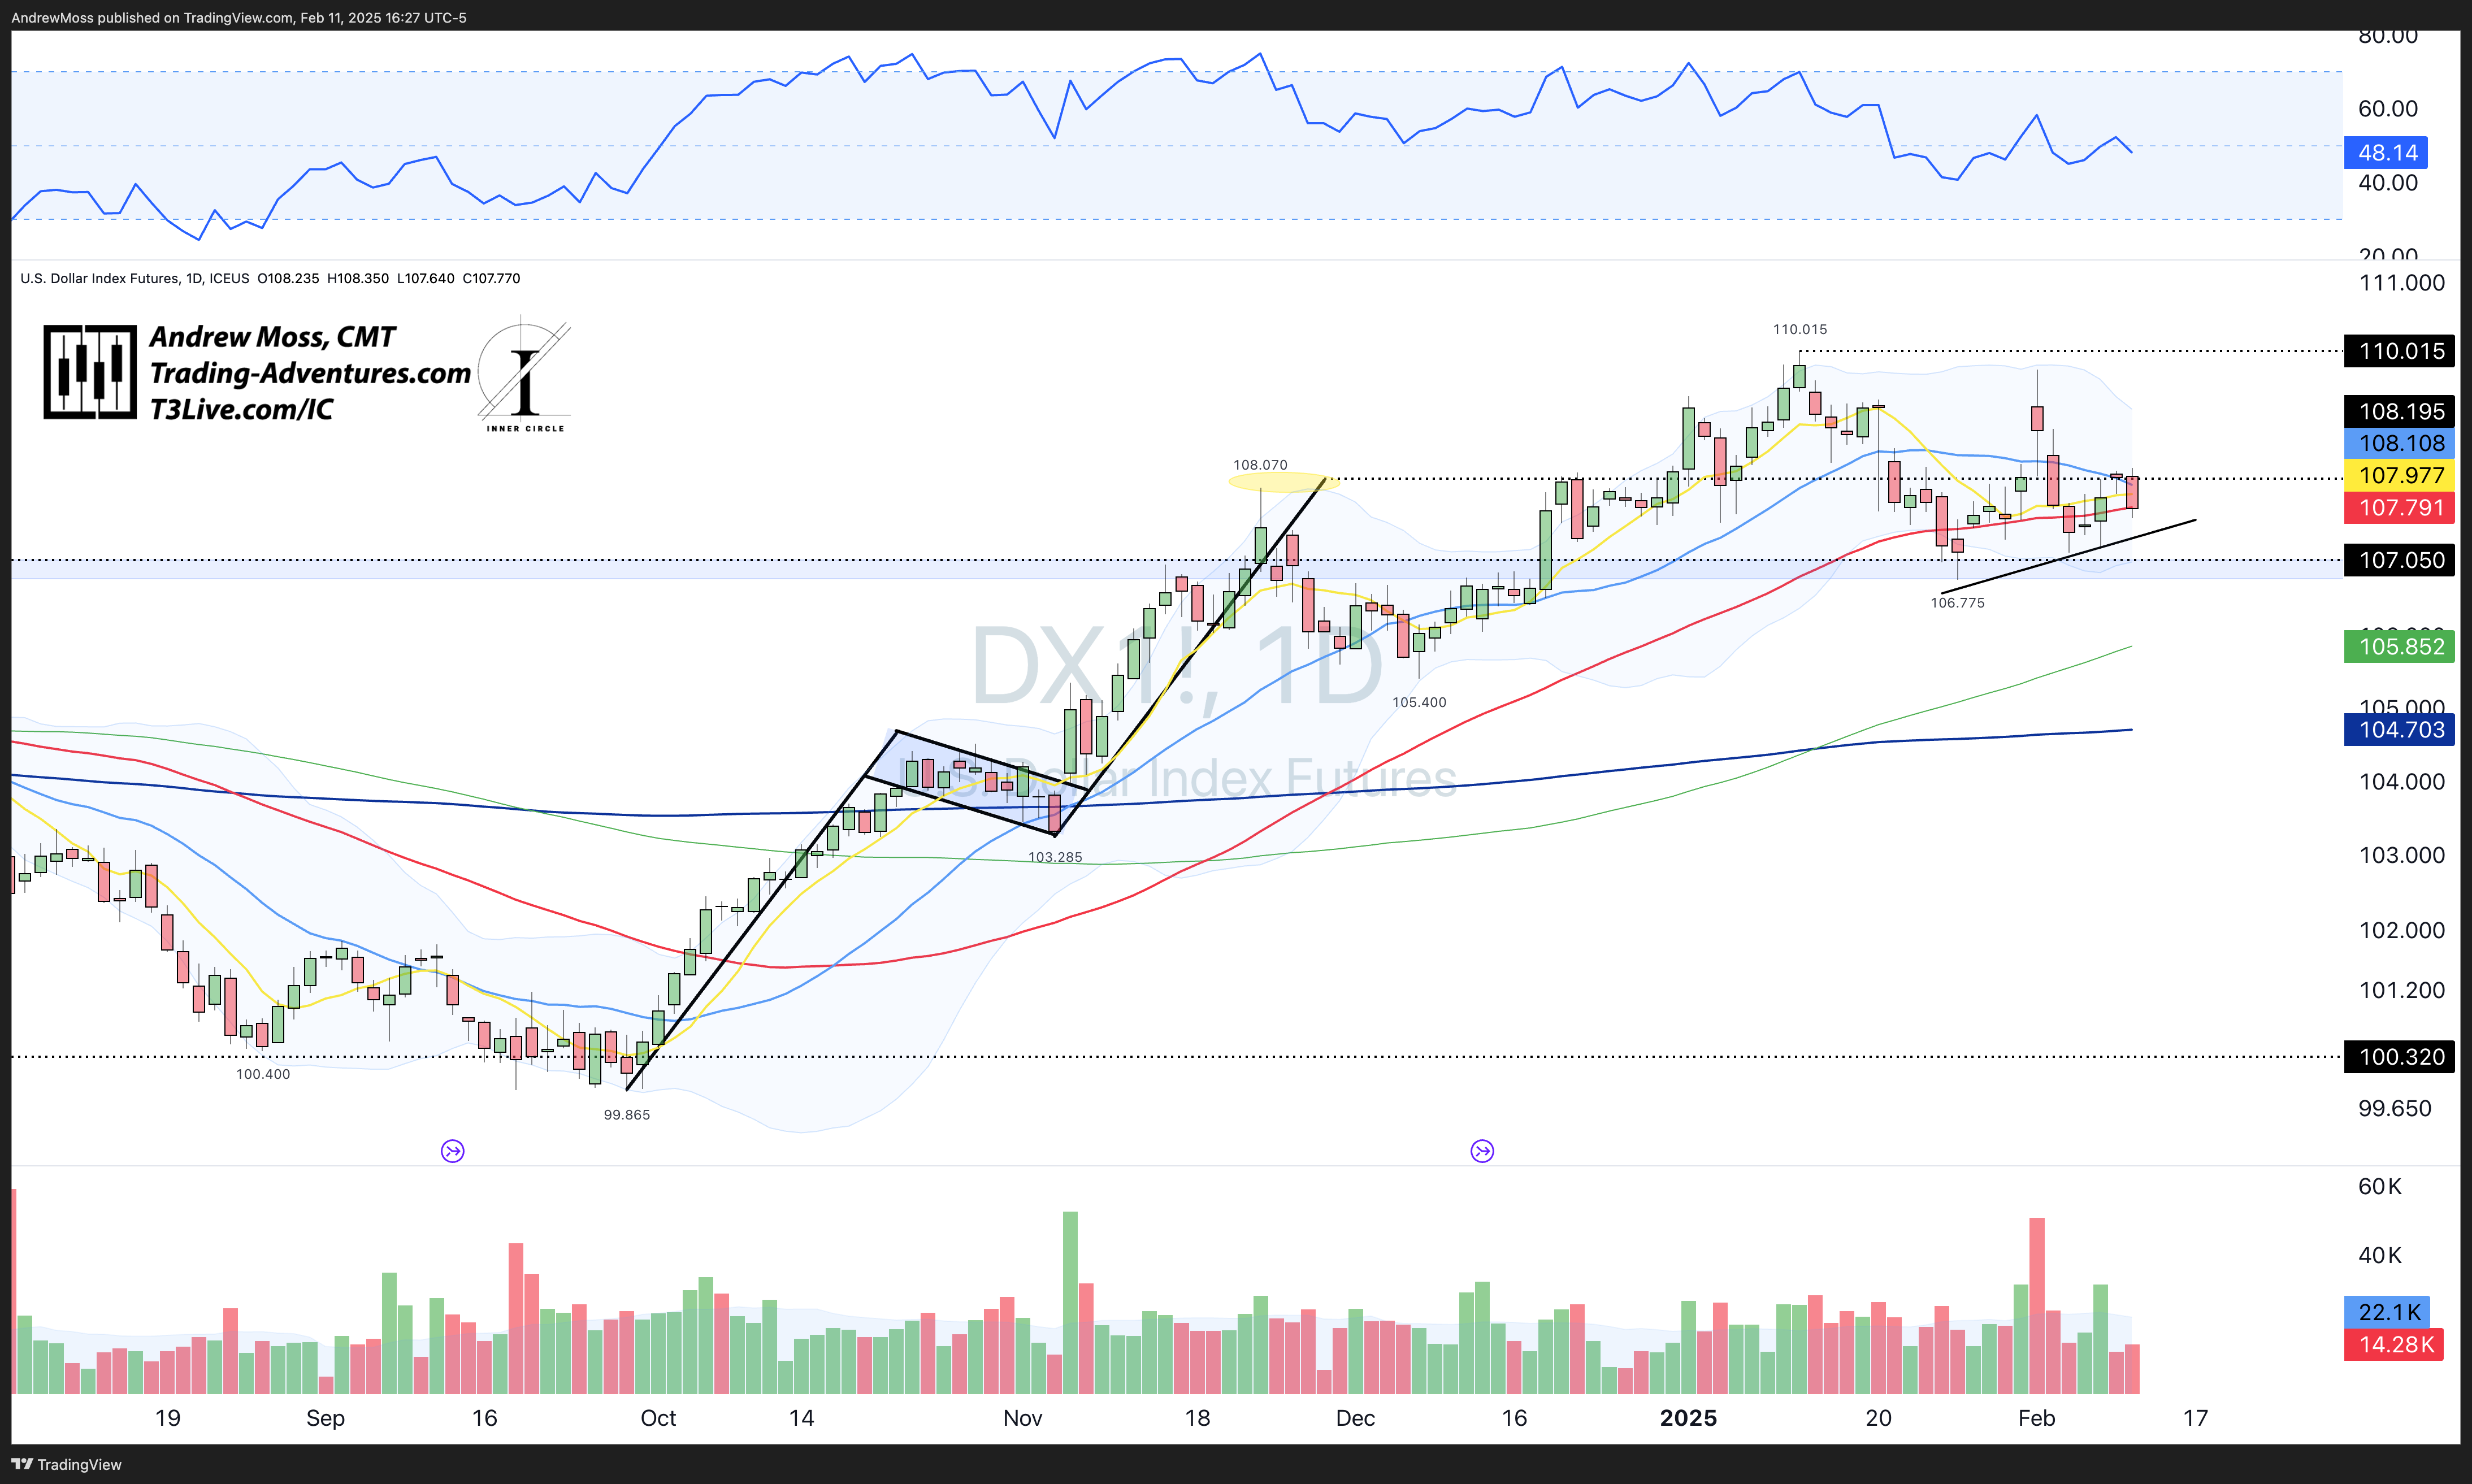
DXY - Consolidation in a short-term downtrend.
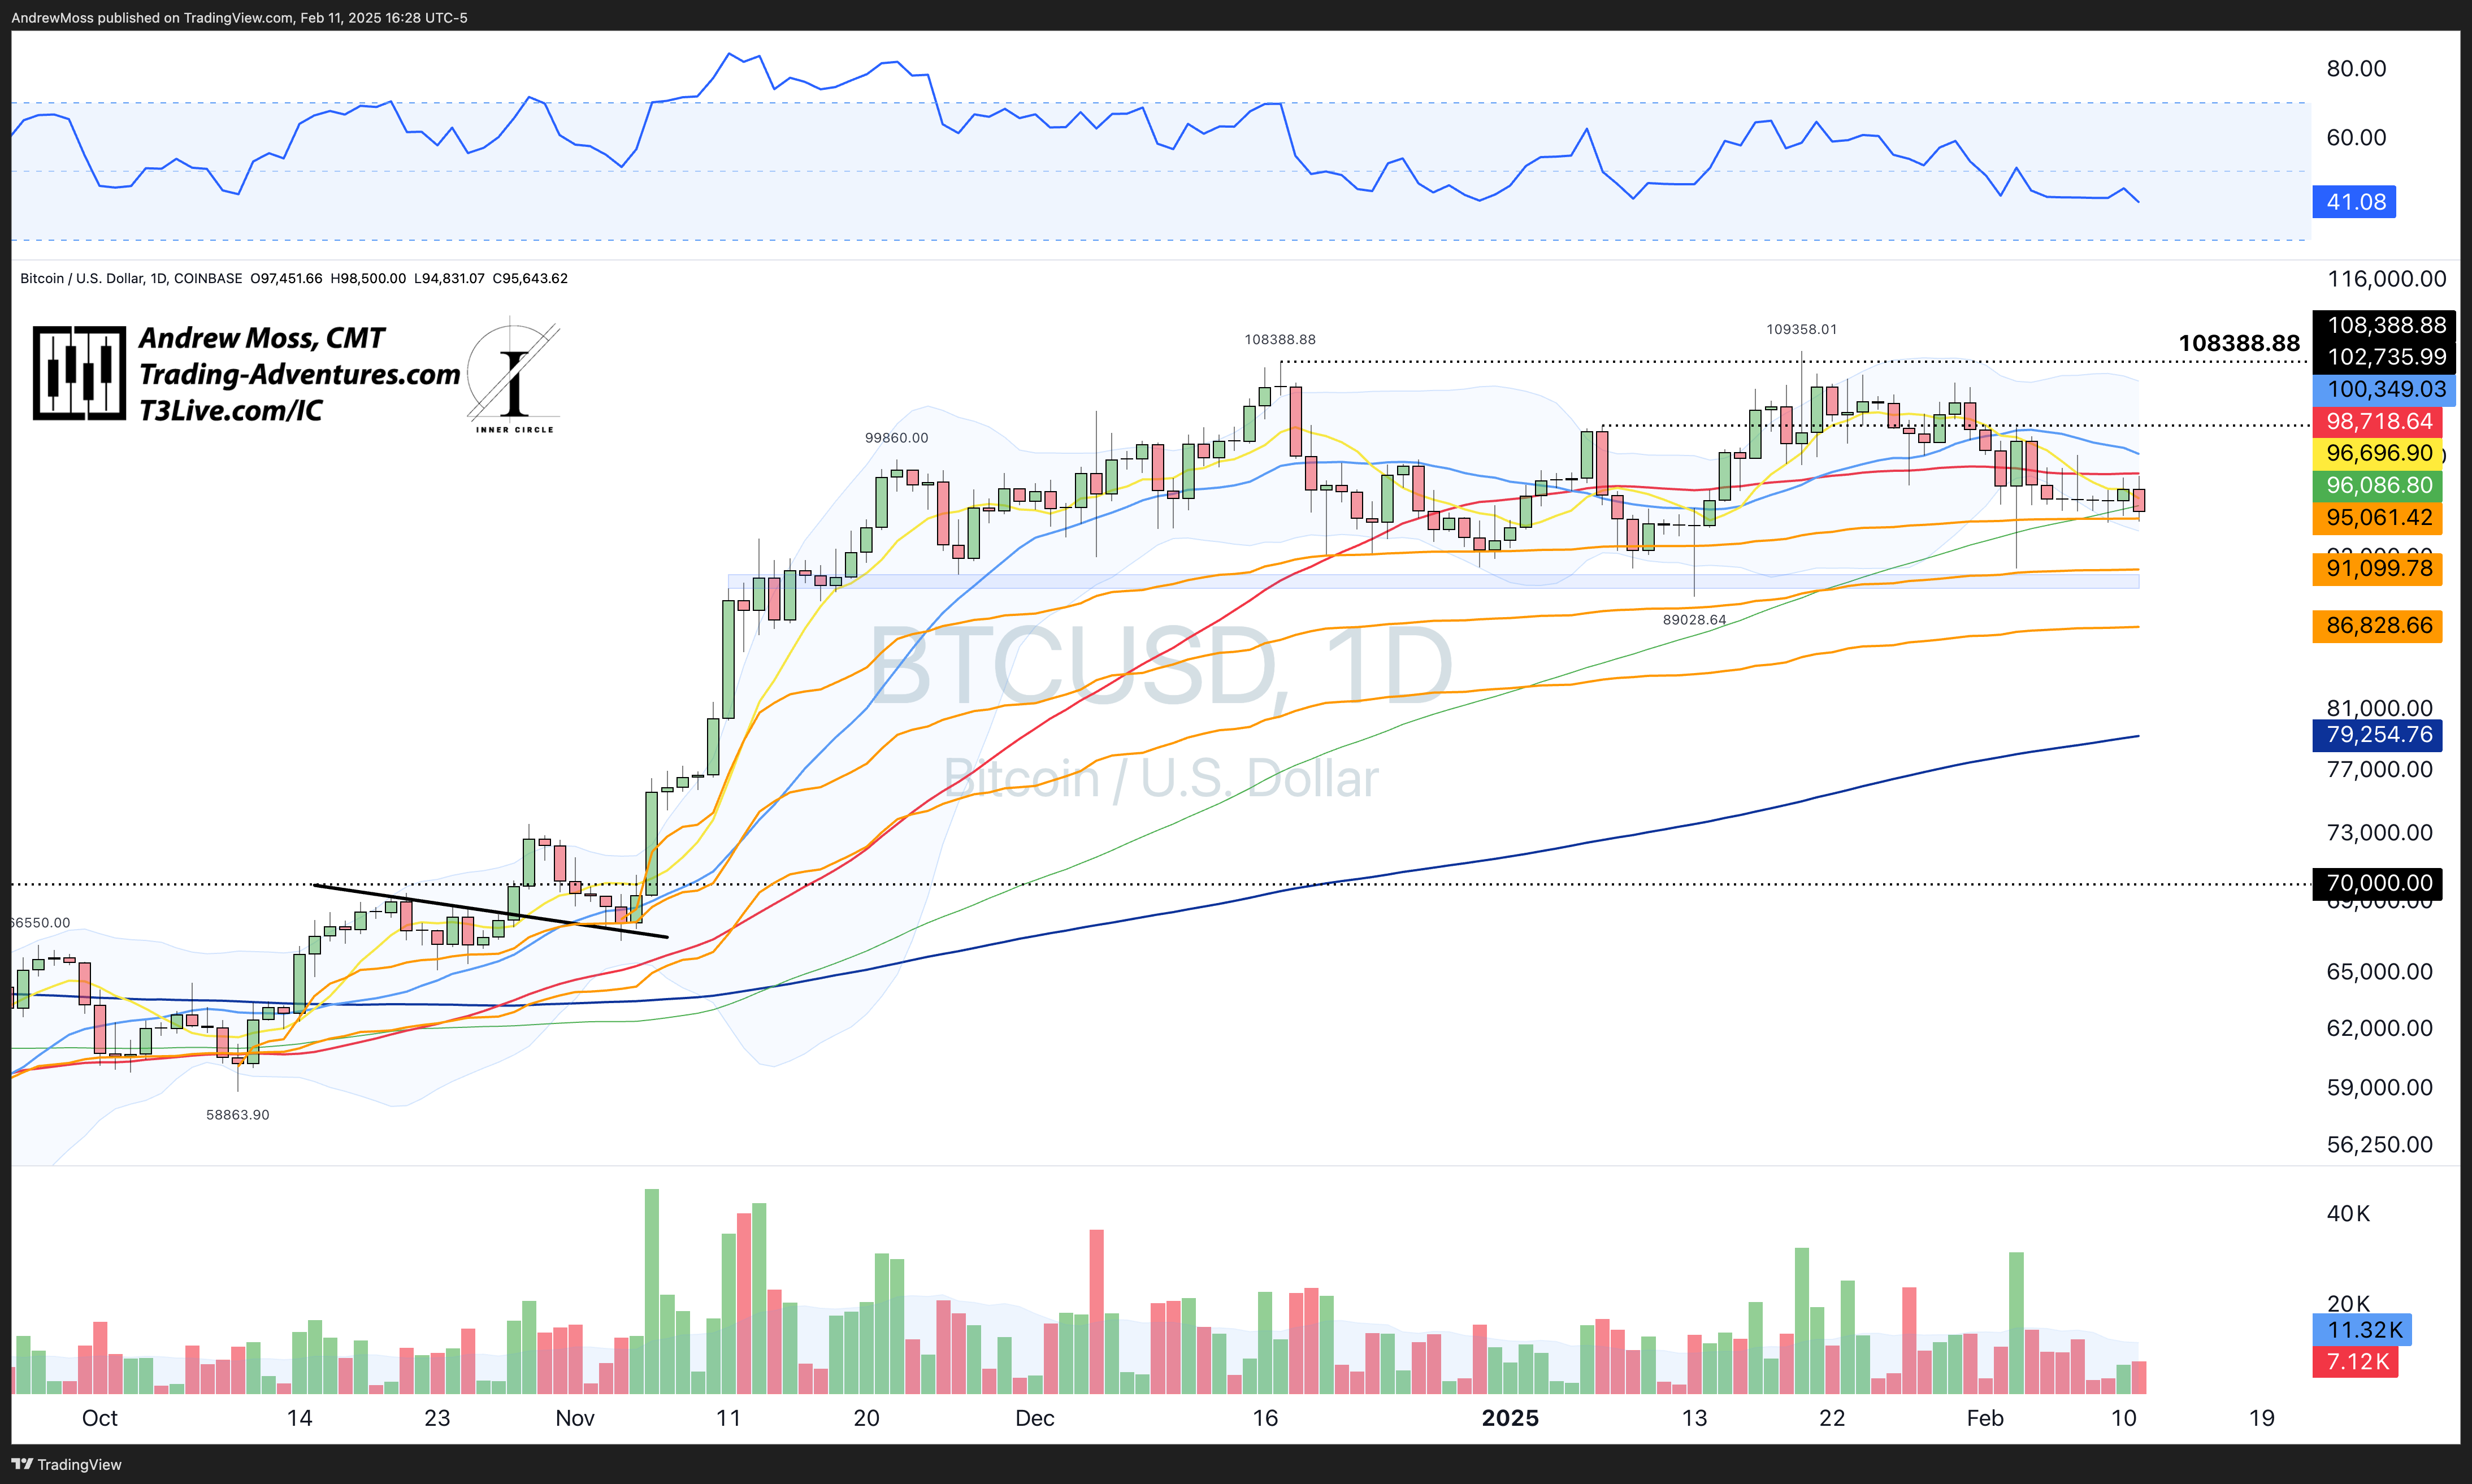
BTCUSD This chart is crowded and messy. But each level and indicator does have some significance. And that fact that they are all so jumbled together and close to one another further illustrates the long, narrow, consolidating action. Bitcoin, it seems, isn’t going anywhere with a major catalyst.
The Trade
The charts are not bearish. Consolidations within uptrends are healthy and tend to lead to more new highs. However, what the charts don’t show as well is a weary attitude among traders.
If this sounds familiar, the reason is from the Weekly Chart thread.

Stories and narratives are driving markets and stock prices. Price action over the last two days has done nothing to change that.
CPI and PPI data are coming tomorrow and Thursday.
Will one or both be the catalyst to breach the boundaries?
Or is February destined to be the choppy, ‘flat to down’ month it is historically known as?
Looking For More?
Elevate Your Trading Adventure Even Further With These Offerings.

EpicTrades Options Newsletter
Real-time trade ideas and insights, providing actionable trading insights focusing on options trades with short-term horizons, aiming to capitalize on weekly market movements.
The approach includes detailed reasoning for trades, specific options, and profit targets. It focuses on quick gains with a minimal time commitment from subscribers.

The Inner Circle
The Inner Circle is a Virtual Trading Floor (VTF) at T3 Live. I’ve been working and trading with this group since 2022. You may have noticed the logo in the watermarks on my charts.
Founded by David Prince and led by him, Rick March, and Kira Turner, the Inner Circle is a community of elite traders, including hedge fund managers, family office heads, corporate executives, financial advisors, and even professional poker players.
Fundamental, Macro, and Technical Analysis all combine to find and discuss the best opportunities in current markets.

The Disclosures
***This is NOT financial advice. This is NOT a recommendation to buy, sell, or trade any security. The content presented here is intended for educational purposes only.