The Markets
Last week the market was a Mixed Bag. This week’s action did nothing to change that.
Some stocks are up — Tech/QQQ
Some stocks are down — Regional banks/IWM
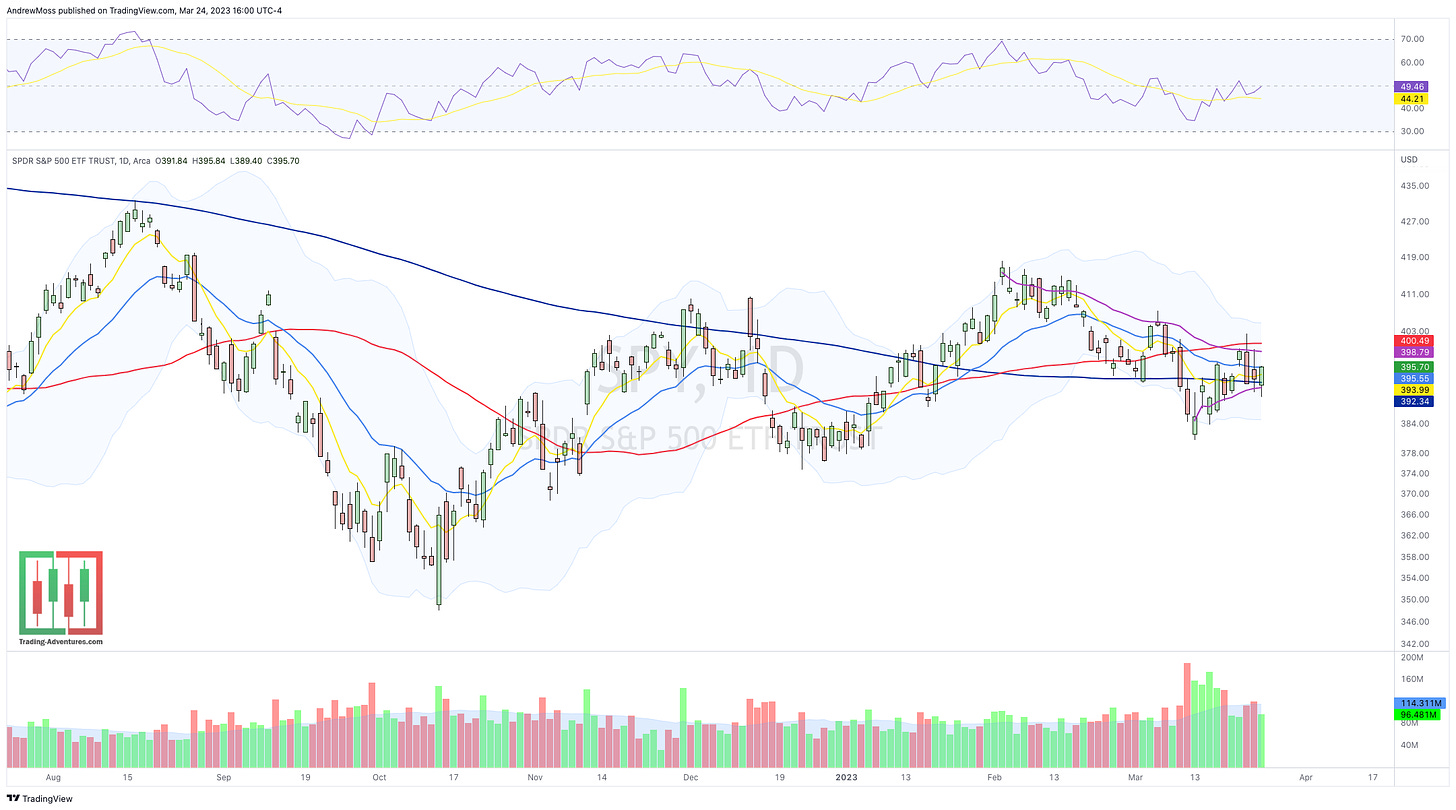
On the whole, stocks continued to move further into a tightening range — SPY
Continued banking problems didn’t wreck the market. Nor did the FOMC meeting. But nothing lit the fuse to send them higher either.
It’s a waiting game.
Let’s get straight to the charts.
The Charts
SPY is stuck in the middle. On the upper side are the 21-day EMA and the swing high anchored VWAP (both pressing lower), and a flattening 50-day MA.
Below is the downsloping 200-day MA and the pivot low anchored VWAP.
The 8-day EMA is just under today’s close.
No trend
No direction
No resolution
click charts to enlarge
QQQ is still the stronger market as it trades above a rising 8 and 21-day EMA. These have really been the only stocks going up. RSI did not get over 70 even as prices pierced a breakout level. A rollover in the leaders could easily move the rest of the market much lower.
IWM the small-cap index, with heavy regional bank exposure, has not held up well. It’s fighting to stay with $170ish support. But the break lower could very well give way to the lower $160s. There is a positive RSI divergence. We’ll have to wait and see if that has any impact.
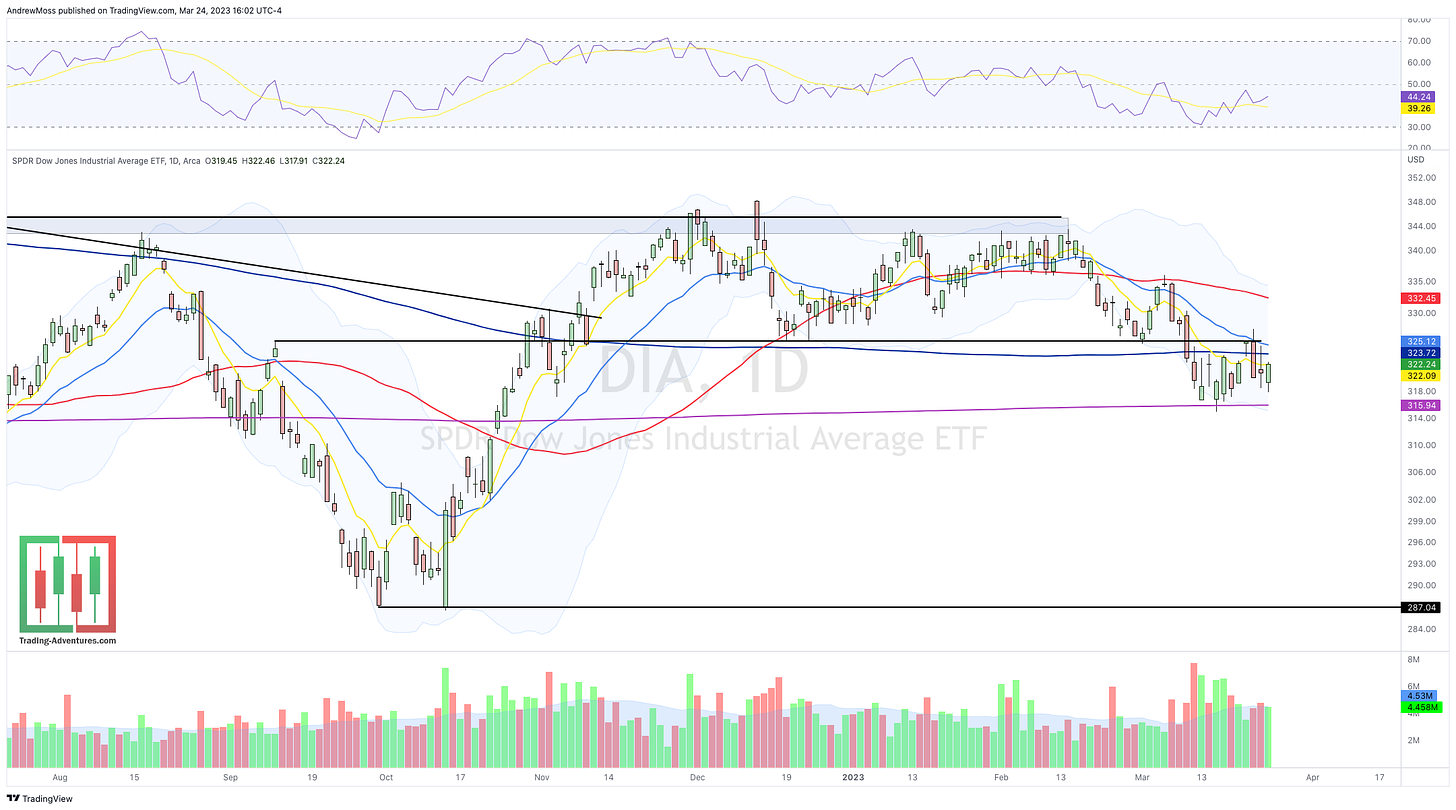
DIA remains beneath all of its key moving averages and sandwiched between $315 and $325. A bearish consolidation pattern.
DXY The Dollar bounced at the 50% retracement level. More back-and-forth action between $102 and $105 looks like a good possibility.
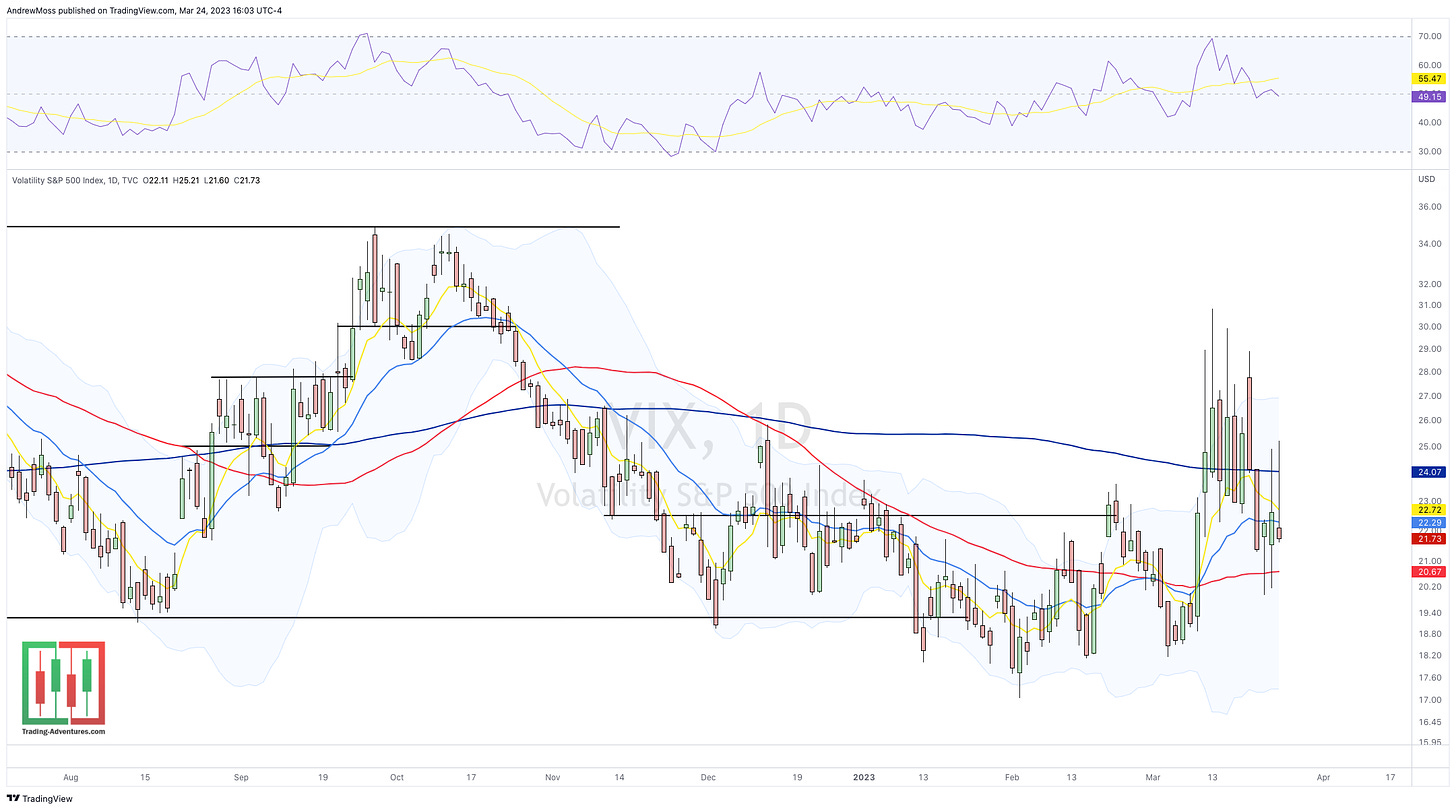
VIX has made some moves, but there has been no sustained increase so far.
Beneath the surface
Digging into the details a bit further gives more reason for caution.
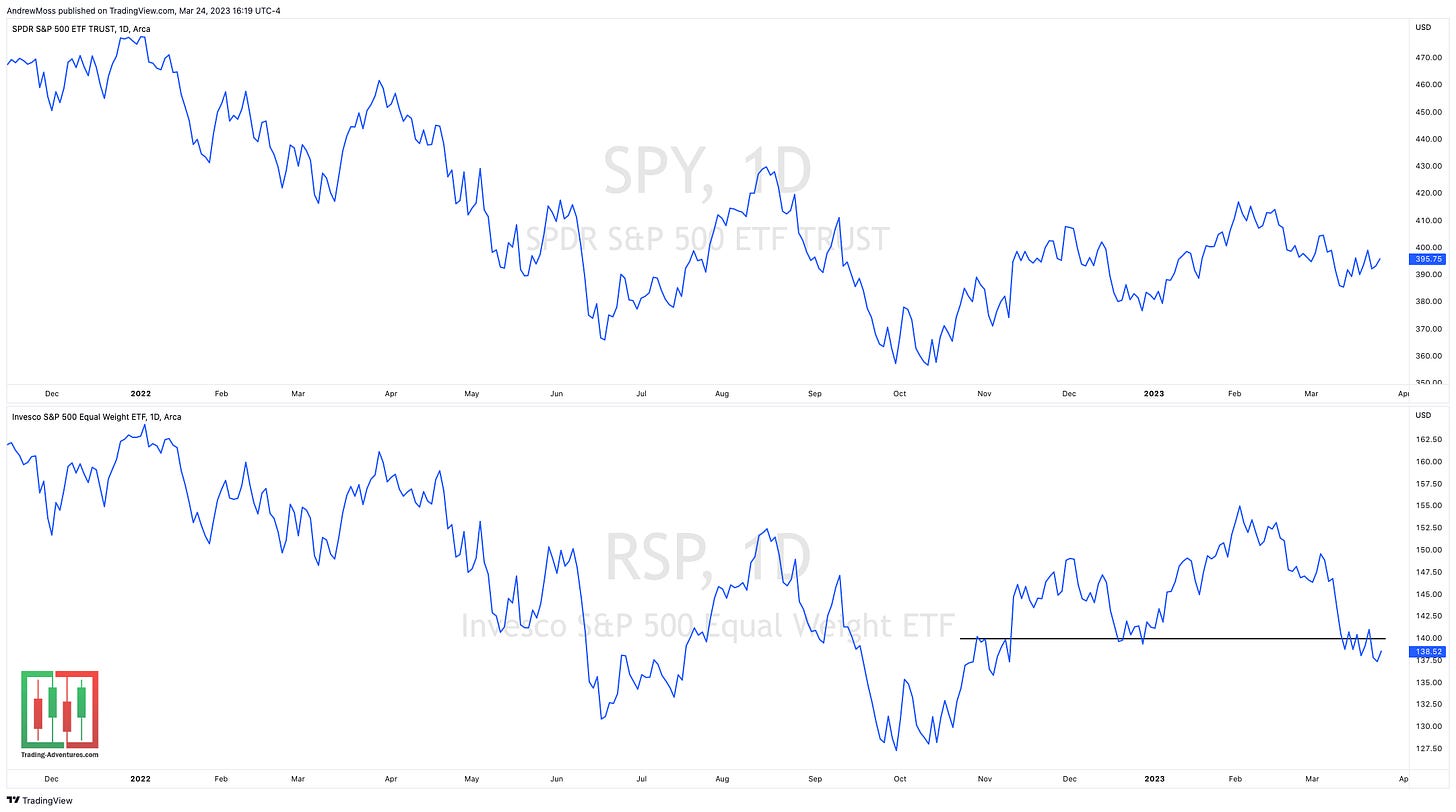
For a while the equal-weight SP 500 index RSP was moving higher with the more commonly viewed capitalization weighted version SPY. That’s an indication that the smaller company stocks were getting bought up with the mega-cap names; AAPL, AMZN, GOOGL, MSFT, etc.
Now RSP is breaking down on both an absolute basis and relative to SPY.
The potential implications are as stated above.
A rollover in the leaders could easily move the rest of the market much lower.
The mega-cap stocks have been the safety trade. If those start getting sold the indexes that still look ok (SPY, QQQ) are going to look much worse.
The percentage of SP 500 stocks above their 50 and 200-day MAs is also showing less bullish participation but is not quite yet down to levels that have coincided with a bounce or bottom.
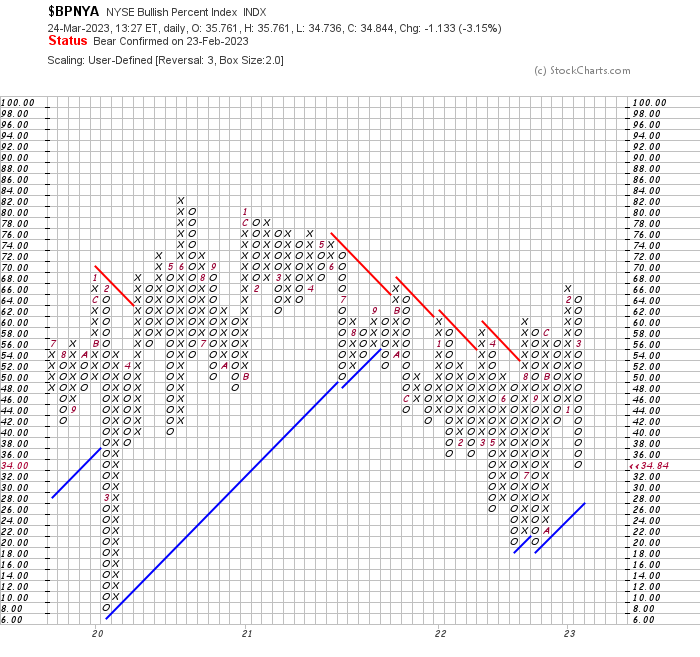
And finally, the NYSE Bullish Percents index is low and falling, but again, not yet at levels typically indicative of a bounce.
So, we wait.
Swing traders may find little to do until the potential for some direction is shown.
Even some scalpers and day traders are doing less this week as the action has been sharp and prone to misdirection.
The story remains the same.
Less is more.
Patience, fewer positions, and smaller position sizes can help.
***This is NOT financial advice. NOT a recommendation to buy, sell, or trade any security. The content presented here is intended for educational purposes only.
Andrew Moss is an associated member of T3 Trading Group, LLC (“T3TG”) an SEC registered broker/dealer and member of FINRA/SIPC. All trades placed by Mr. Moss are done through T3TG.
Statements in this article represent the opinions of that person only and do not necessarily reflect the opinions of T3TG or any other person associated with T3TG.
It is possible that Mr. Moss may hold an investment position (or may be contemplating holding an investment position) that is inconsistent with the information provided or the opinion being expressed. This may reflect the financial or other circumstances of the individual or it may reflect some other consideration. Readers of this article should take this into account when evaluating the information provided or the opinions being expressed.
All investments are subject to the risk of loss, which you should consider in making any investment decisions. Readers of this article should consult with their financial advisors, attorneys, accountants, or other qualified investors prior to making any investment decision.
POSITION DISCLOSURE
March 24, 2023, 4:00 PM
Long: AMZN0421C102, NVDA0331P265, QQQ0331P305
Short: SBNY
Options symbols are denoted as follows:
Ticker, Date, Call/Put, Strike Price
Example: VXX1218C30 = VXX 12/18 Call with a $30 strike


