The Markets
Stocks continue lower.
The indexes and many recent leading names are testing medium to long-term moving averages and key support levels. The selling has been persistent. But there is no real fear involved.
It could be a normal seasonal fluctuation. And it’s worth remembering that the NASDAQ is only -5.75% off the high. So, this action is still a very ‘run-of-the-mill’ selloff.
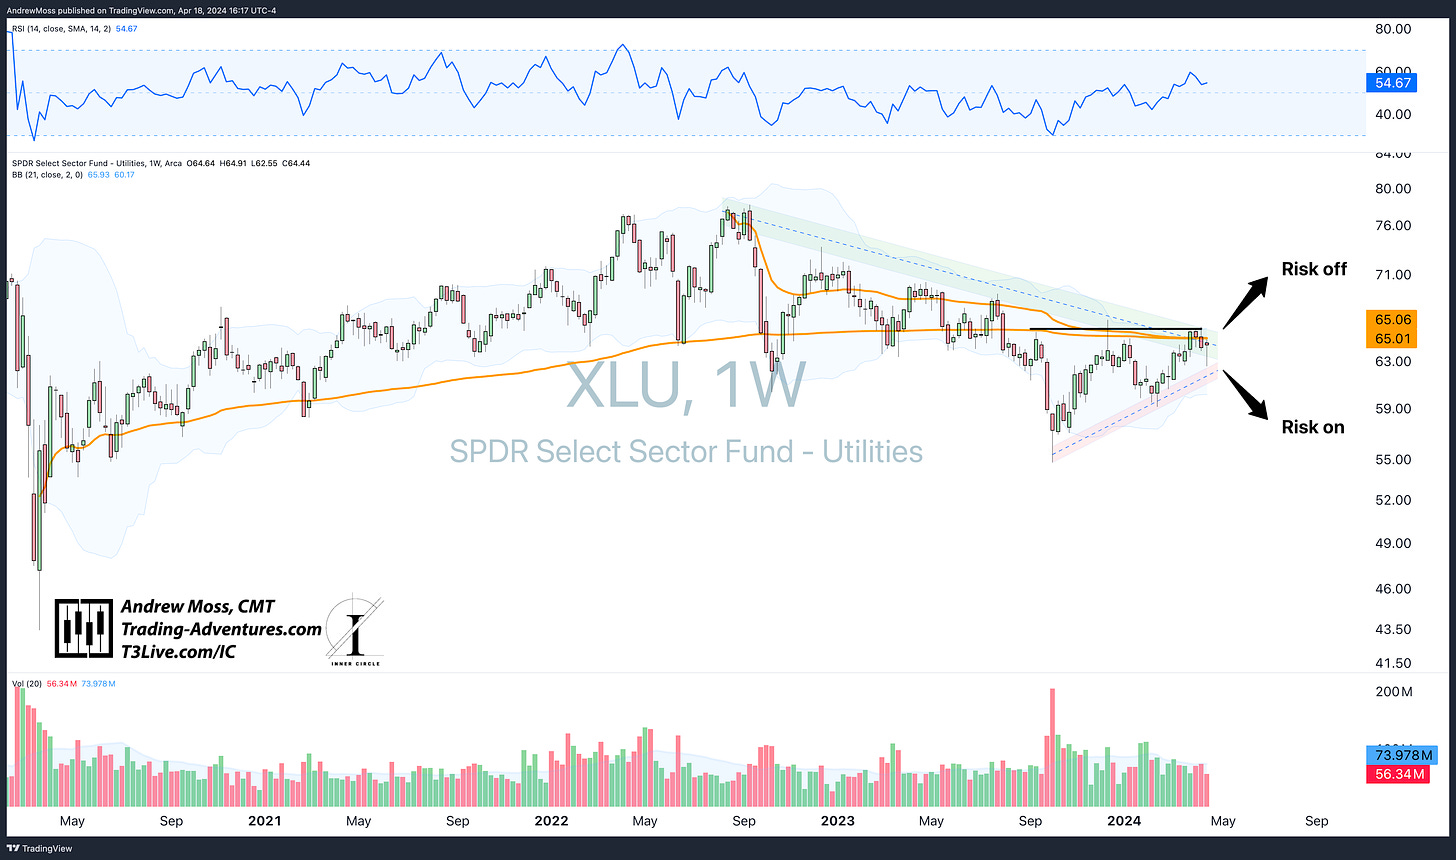
One potential canary to watch is the Utility sector. This defensive area tends to gain strength when the more growth-oriented sectors face a selloff.
Currently, it is in a consolidation pattern.
A move above $66 would be a major change, giving the market a much different look.
A breakdown below $62 would likely mean returning strength to the 'risk-on' sectors.
XLU
Now, the rest of the charts.
The Charts
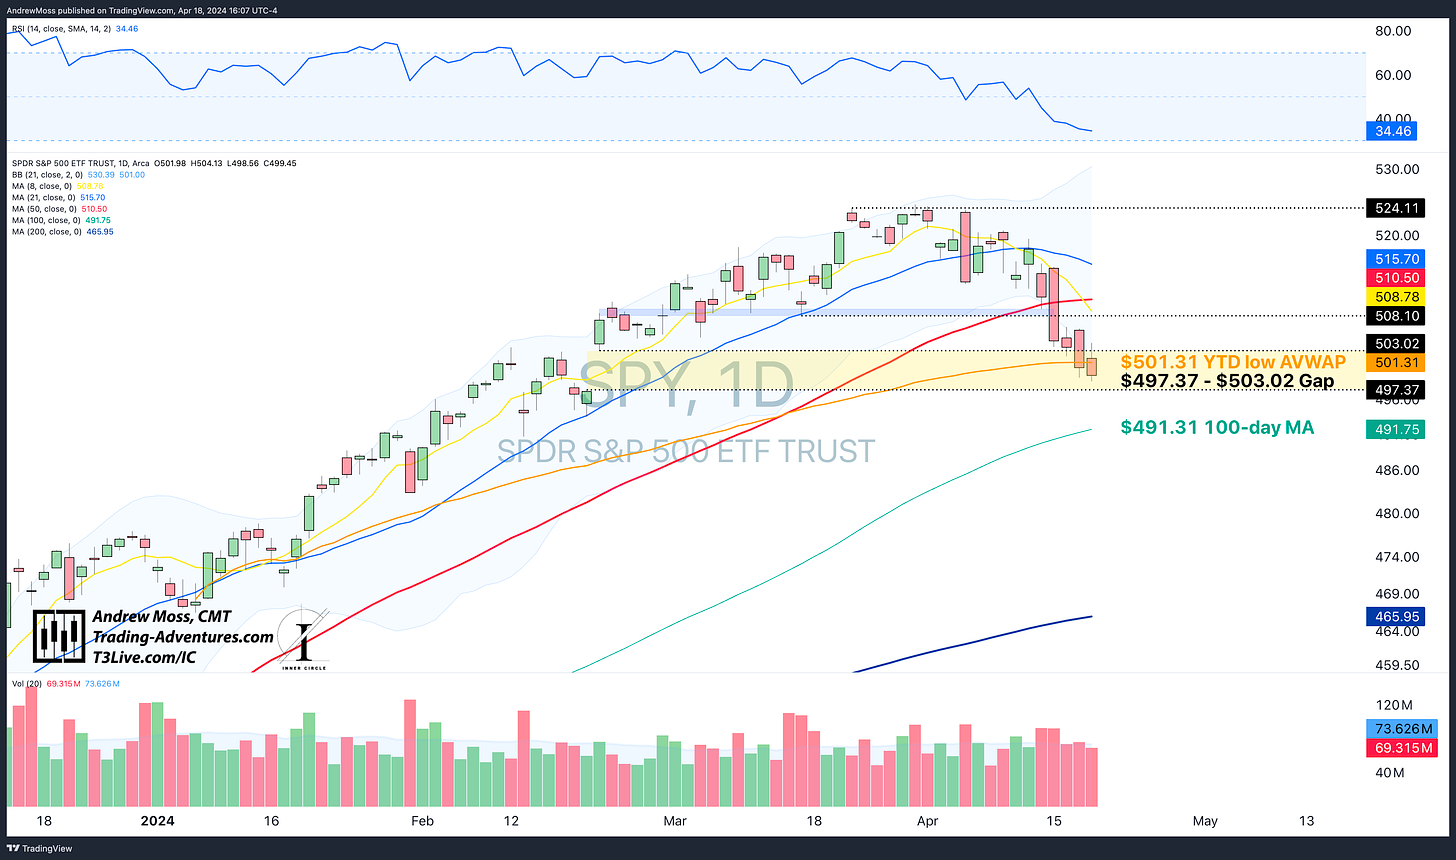
SPY has moved beneath two more support levels since Monday — the gap pivot and the YTD low anchored VWAP. Now, it’s looking to close the gap at $497.37. Below that is the 100-day MA for the next potential support.
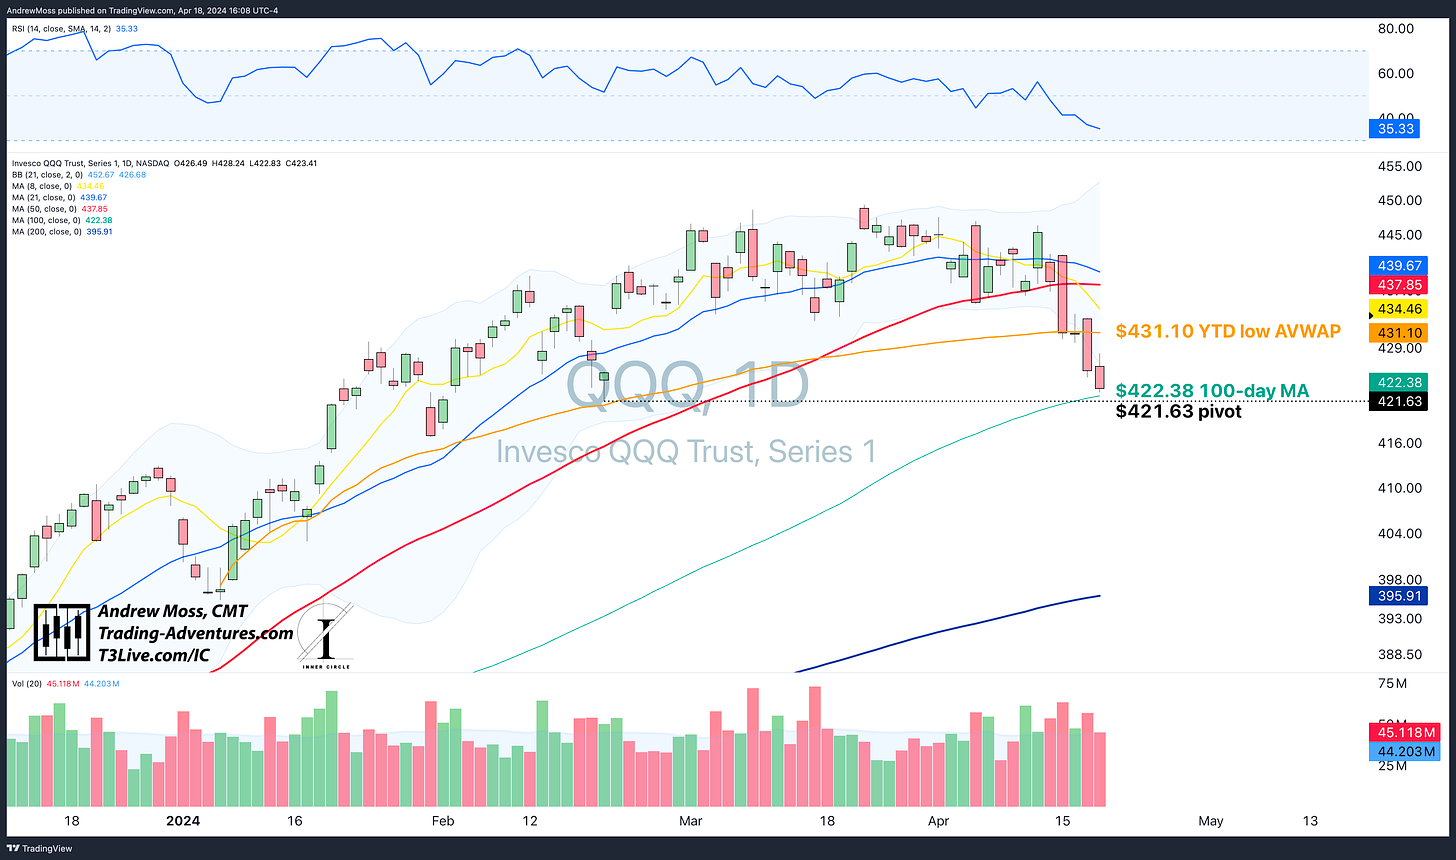
QQQ sank below the AVWAP from Monday’s chart and is very near the next pivot level and the 100-day MA—$422 area.
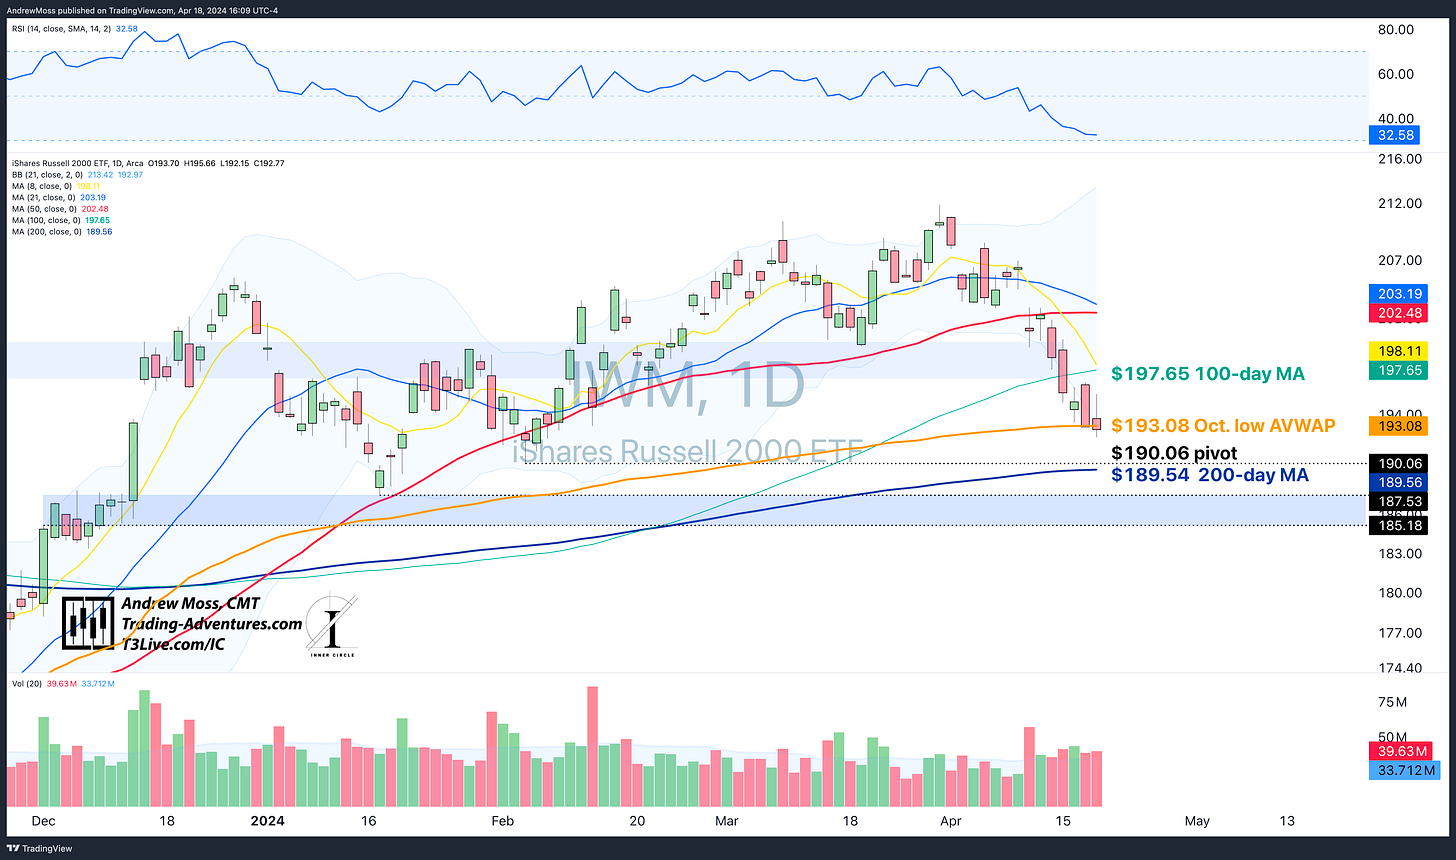
IWM's slight bounce attempt on Tuesday was quickly negated, and today, it's looking for support at the Oct. low AVWAP. If that doesn’t hold, a move to $189-$190 is likely.
DIA has been in a range this week, but that range is a potential bear flag pattern. The Oct. low AVWAP is the next potential support, followed by the 200-day MA.
TLT has choppy action, while the 8-day MA declines to meet the price. A trip to the gap below is still a strong possibility. On the plus side, it will have to clear the 8-day to find any short-term momentum.
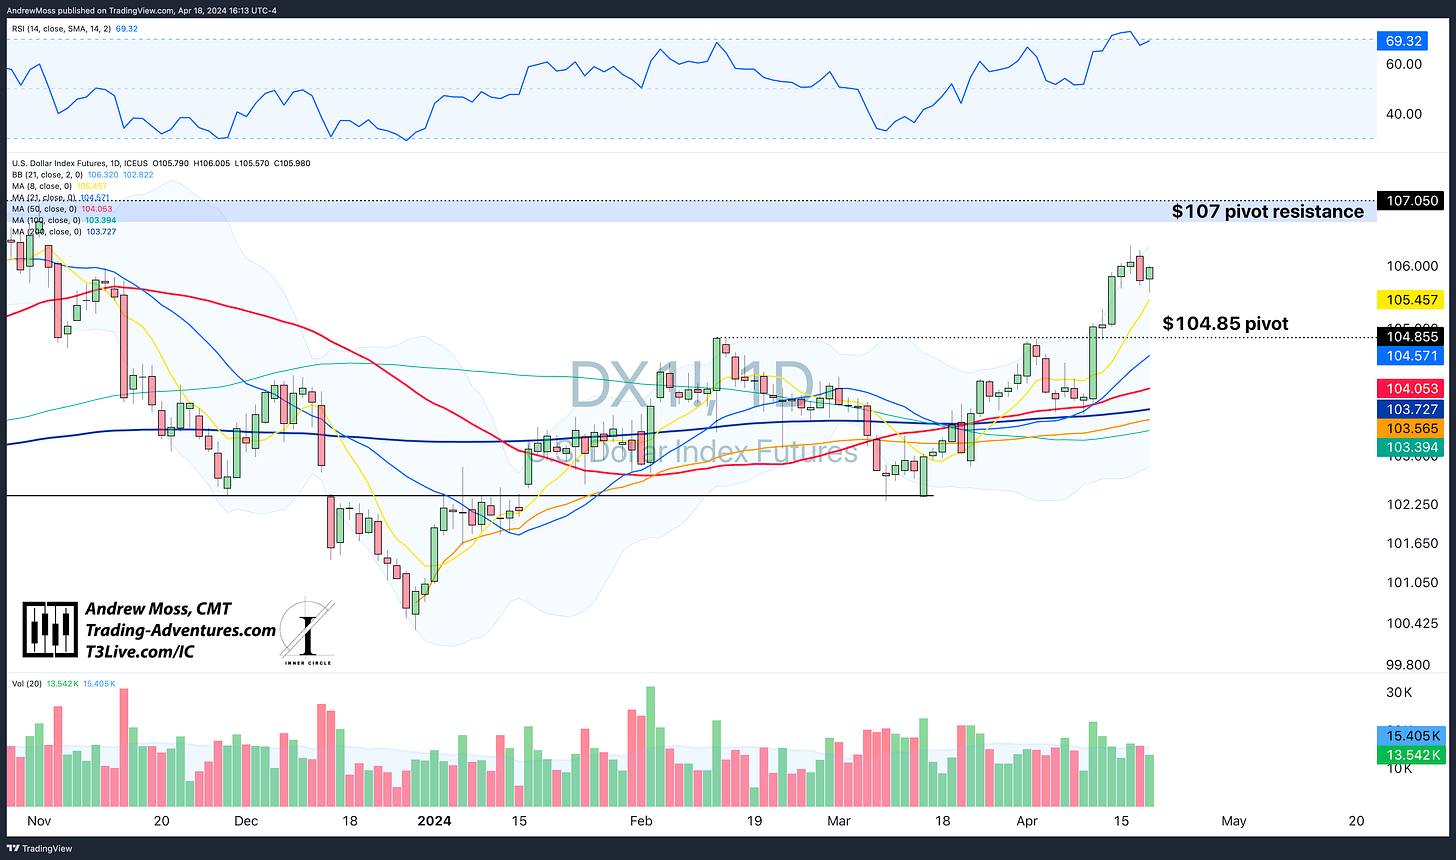
DXY looks to be consolidating before another move up to pivot resistance.
BTCUSD is holding the pivot area support so far. Overhead, the 21 and 50-day MAs will try to keep a lid on things. Below, the 100-day MA could be support.
The Trade
The trade remains the same — less is more.
Patience will be rewarded as we wait and see where prices settle. Watch the support levels on the way down. And when a bounce comes, we’ll need to look for the short-term resistance levels to be cleared to see of a new active sequence can take shape.
More to come with the Weekly Charts over the weekend.
Elevate Your Trading
Education, training, and support for your Trading Adventure.
Options Trades - Weekly trade ideas are delivered to your email or text messages in language you can easily understand.
Check out EpicTrades from David Prince and T3 Live. Epic Trades from David Prince
Community - Are you an experienced trader seeking a community of professionals sharing ideas and tactics? Visit The Inner Circle, T3 Live’s most exclusive trading room - designed for elite, experienced traders.
The Inner Circle at T3 Live
Prop Trading - Or perhaps you are tested and ready to explore a career as a professional proprietary trader? 3 Trading Group has the technology and resources you need.
Click here to start the conversation:
T3TradingGroup.com
The Disclosures
***This is NOT financial advice. This is NOT a recommendation to buy, sell, or trade any security. The content presented here is intended for educational purposes only.
Andrew Moss is an associated member of T3 Trading Group, LLC (“T3TG”), an SEC-registered broker/dealer and member of FINRA/SIPC. All trades placed by Mr. Moss are done through T3TG.
Statements in this article represent that person’s opinions only and do not necessarily reflect those of T3TG or any other person associated with T3TG.
Mr. Moss may hold an investment position (or may be contemplating holding an investment position) that is inconsistent with the information provided or the opinion being expressed. This may reflect the financial or other circumstances of the individual, or it may reflect some other consideration. Readers of this article should consider this when evaluating the information provided or the opinions being expressed.
All investments are subject to the risk of loss, which you should consider in making any investment decisions. Readers of this article should consult with their financial advisors, attorneys, accountants, or other qualified investors before making any investment decision.
POSITION DISCLOSURE
April 18, 2024, 4:00 PM
Long: HD0426C340, IMNM, VKTX0419C80
Short:
Options symbols are denoted as follows:
Ticker, Date, Call/Put, Strike Price
Example: VXX1218C30 = VXX 12/18 Call with a $30 strike


