The Correction Is Here
Who cares about media definition. Look at the price action.
The Markets
The SPX weekly chart told us that for more downside, we’d need to see a series of lower highs and lower lows to change the trend. For that to happen on the weekly chart, it must first happen on the daily chart.
The daily SPX chart shows a pivot low at 5832, followed by a bounce to 6049. Today’s trading took prices to 5829.53 — less than the previous pivot low, following a bounce that did not exceed the previous pivot high — a lower high and lower low on the daily chart.
We could debate whether it matters since the price didn't close there. But it wouldn’t change the facts. Prices did go lower, even if only briefly. And since trading is at least as much art as science, that debate is probably not a good use of time and energy.
We could also debate the so-called "definition" of a market correction. Stock market reporters and others in the legacy media love to label a 10% decline a "correction." From the pivot high on December 6 to the pivot low of today, the S&P 500 is not even down 5%.
Who cares?
It is below the short- and medium-term moving averages (8, 21, and 50-day MAs), with RSI in the bearish lower half (< 50), pushing the Bollinger Bands down and, to repeat, hitting a lower high followed by a lower low.
That is corrective price action.
QQQ is doing the same. There is a pivot high of 539.15, followed by a pivot low of 509.29. The bounce from there only reached 531.24 before touching 505.71 today. Again, lower highs and lower lows equal corrective in my book. And, of course, this chart, too, has a price below the 8/21/50-day MAs, pushing the Bollinger Bands lower while the RSI is < 50.
We haven’t seen this type of action in either SPX or QQQ since August, when both tested their 100-day MAs, and QQQ hit its 200-day MA. That marked a short-term bottom for each. Is it time to look for that again now?
Let’s see what the charts say.
The Charts
SPX now has an occurrence of a ‘lower high’ followed by a ‘lower low’ — labels 1-4.
Today’s close is very near the pivot level area (yellow-shaded area), which has already been support many times. Maybe it will hold again. However, experience tells us that the more times a key level is tested, the more likely it is to break.
Looking beyond, potential support is near the 100-day MA, 5797, and the August pivot low AVWAP, 5769. Then there is the July pivot high just below 5700. After that, it's the 200-day MA, currently near 5555 and not quite 10% from highs.
QQQ is also correcting with a series of lower highs and lower lows (labels 1-4). It is possible that the $509 pivot and 50-day MA give support, leading to a bounce. Today was the fourth down day. And we did see a decent reversal off the morning lows. But, any bounce will likely find trouble at the 8 and 21-day MAs and a retest of the uptrend line.
On a move lower, more potential support is the 100-day at 494, the August low AVWAP near $488, a pivot low at 483.75, and then the 200-day near 475.
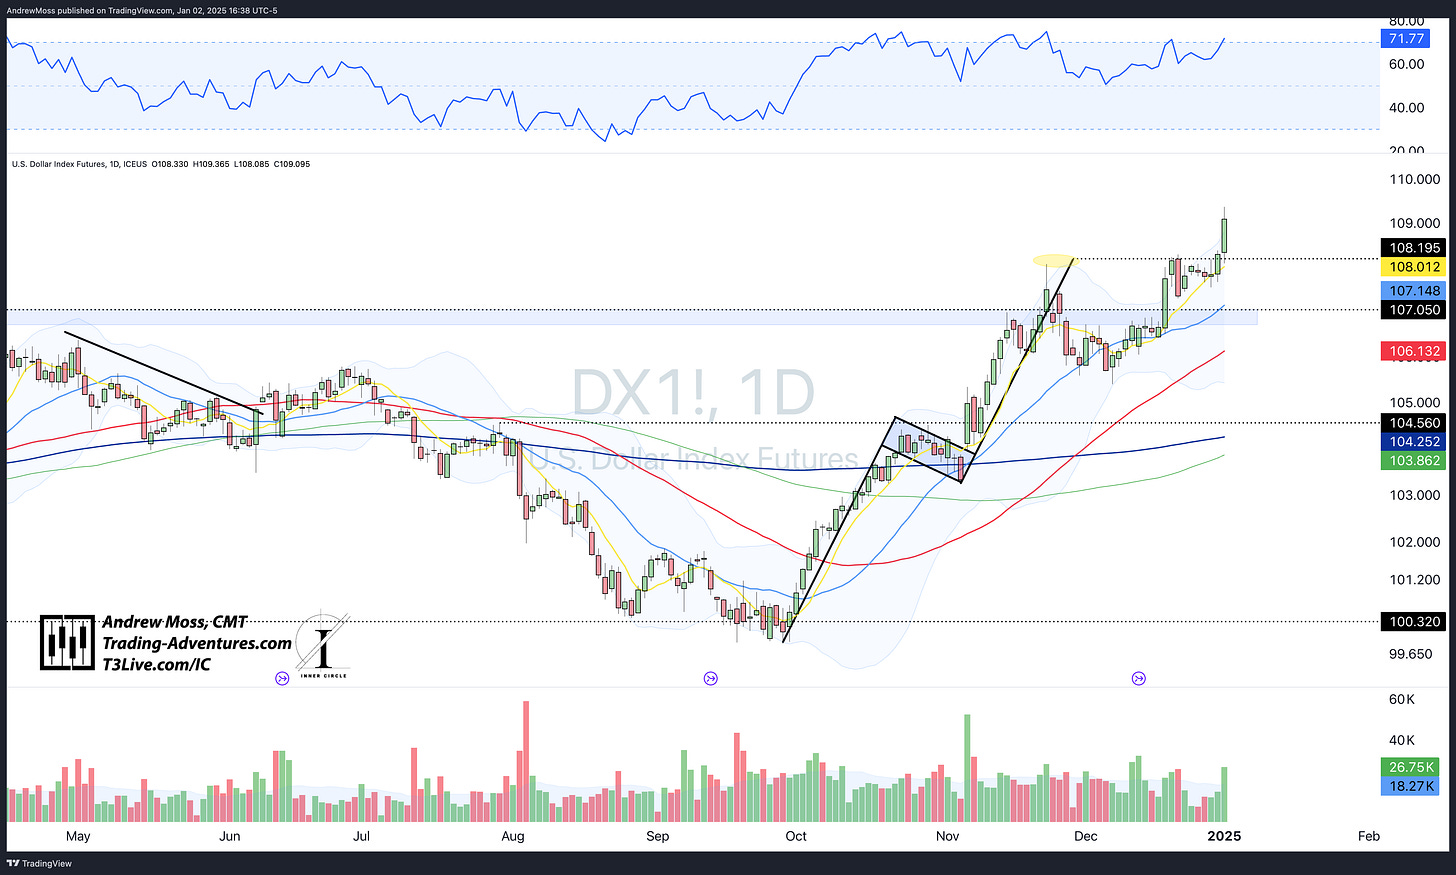
DXY Meanwhile, the dollar futures are in full-on breakout mode, contributing to the ample headwind for stocks.
BTCUSD Finally, like the dollar, Bitcoin is enjoying some strength today as it continues to bounce from the pivot low AVWAP to test its 21-day moving average today.
The Trades
Higher volatility is here to start the new year. There has been some strength in individual names while the overall indices have been challenged.
The charts suggest an increased likelihood of lower prices in the short term.
An unsurprising bounce from here (did I say we just had a fourth day lower?) would likely find trouble at the moving averages overhead. Furthermore, the August lows were further off the highs and had much lower RSI readings.
Watch the 100-day MA and August low AVWAP on SPX and QQQ first. Then, we may be closer to a short-term bottom.
In the Inner Circle VTF, we're sticking with the theme of patience, fewer long positions (and with less size), and taking quick, tactical setups when they arise. Recent winning trades include — bouncing crypto-related (IBIT, MSTR), a quick tactical short in TSLA, and some quick trades in short-dated puts on SPX and QQQ.
There were no new trades today for the Epic Trades Newsletter.
Hit the links below to learn more about either of these tools.
See you all Saturday morning for the first 📈Weekly Chart📉 thread of 2025.
Looking For More? Go Further On Your Trading Adventure With These Guides
EpicTrades Options Newsletter
Real-time insights and actionable trading ideas focusing on short-term options.
The approach includes detailed reasoning for trades, specific options, and profit targets, focusing on quick gains with less time commitment required from subscribers.
The Inner Circle
The Inner Circle is a Virtual Trading Floor (VTF) at T3 Live.
Founded by David Prince and led by him, Rick March, and Kira Turner, the Inner Circle is a community of elite traders, including hedge fund managers, family office heads, corporate executives, financial advisors, and even professional poker players.
Fundamental, Macro, and Technical Analysis all combine to find and discuss the best opportunities in current markets.
The Disclosures
***This is NOT financial advice. This is NOT a recommendation to buy, sell, or trade any security. The content presented here is intended for educational purposes only.


