

The Deck Is Stacked With Strength—Yet One Wildcard Remains
Everything is working under the surface. The only thing missing? The market’s biggest stocks.


Subscriber Note
We’re almost there. A private update will be shared over the weekend, exclusively through Trading Adventures. Be sure you’re subscribed to receive it.
In Sunday’s Weekly Charts analysis we examined the relationship between the Magnificent Seven and the SP 500 Index.


For a long time, the narrative was that the market wasn’t healthy because only the Magnificent Seven were going up. Now the script has flipped. Some say the market’s vulnerable because the MAG7 aren’t participating.
So which is it?
Let’s take a look at the facts—with a little help from some friends.
A Massive Piece of the Puzzle
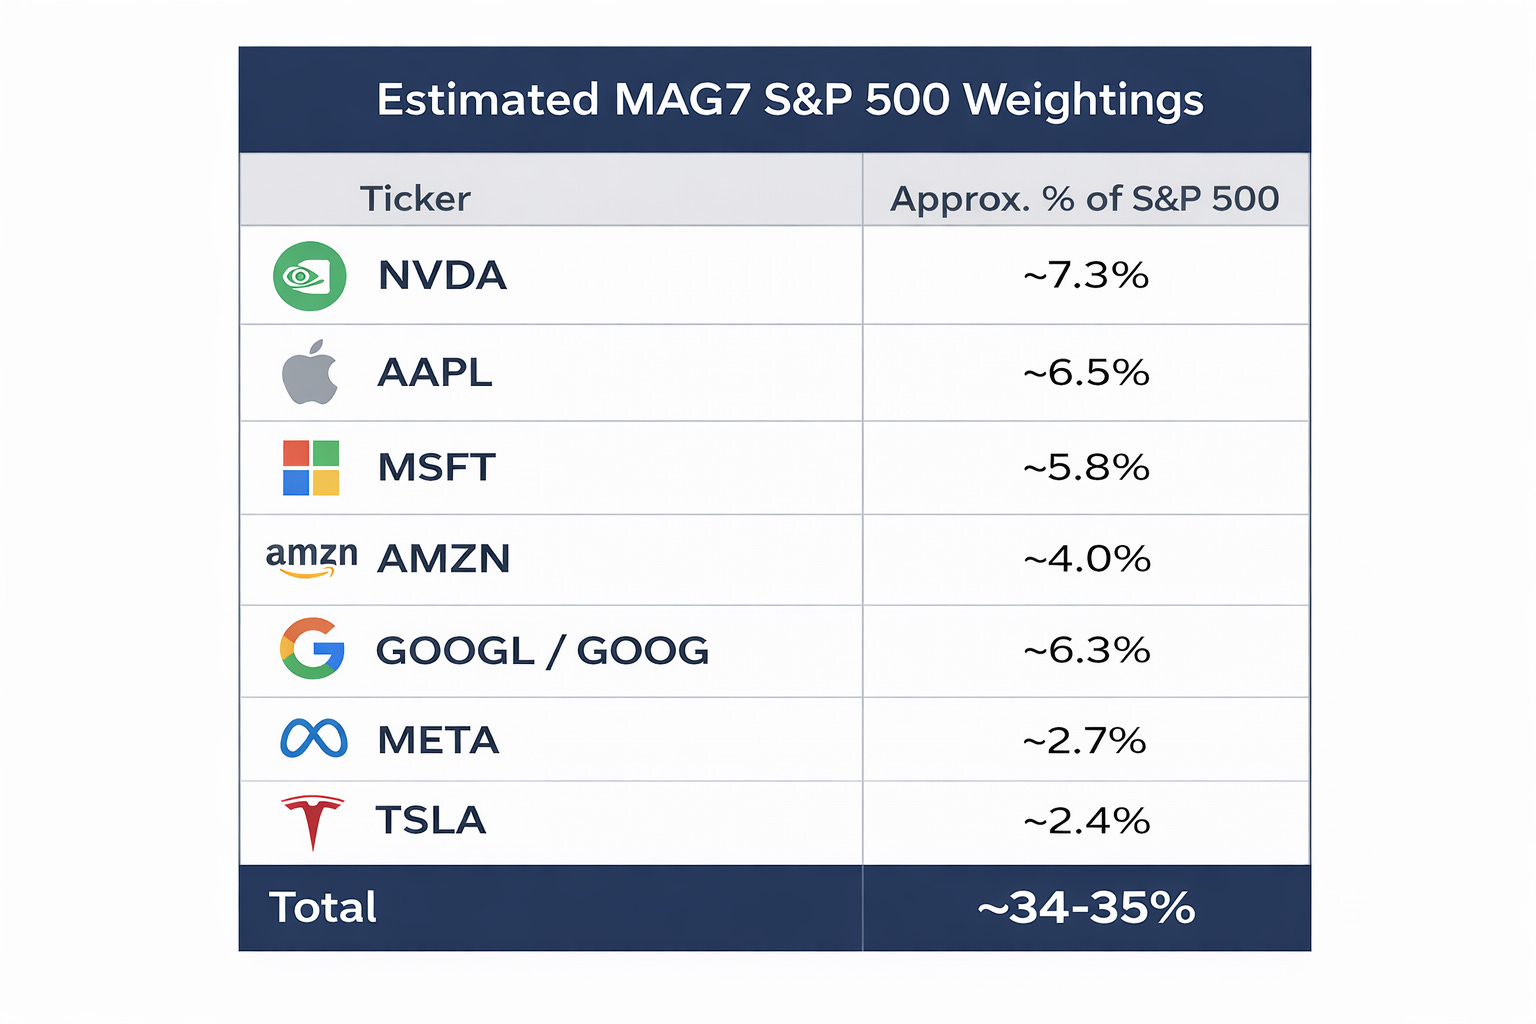
The Magnificent Seven—Apple, Microsoft, Nvidia, Amazon, Alphabet, Meta, and Tesla—still make up ~35% of the S&P 500.
Yet despite their recent underperformance, the index just made new all-time highs.
That’s not a sign of fragility. That’s a sign of strength.
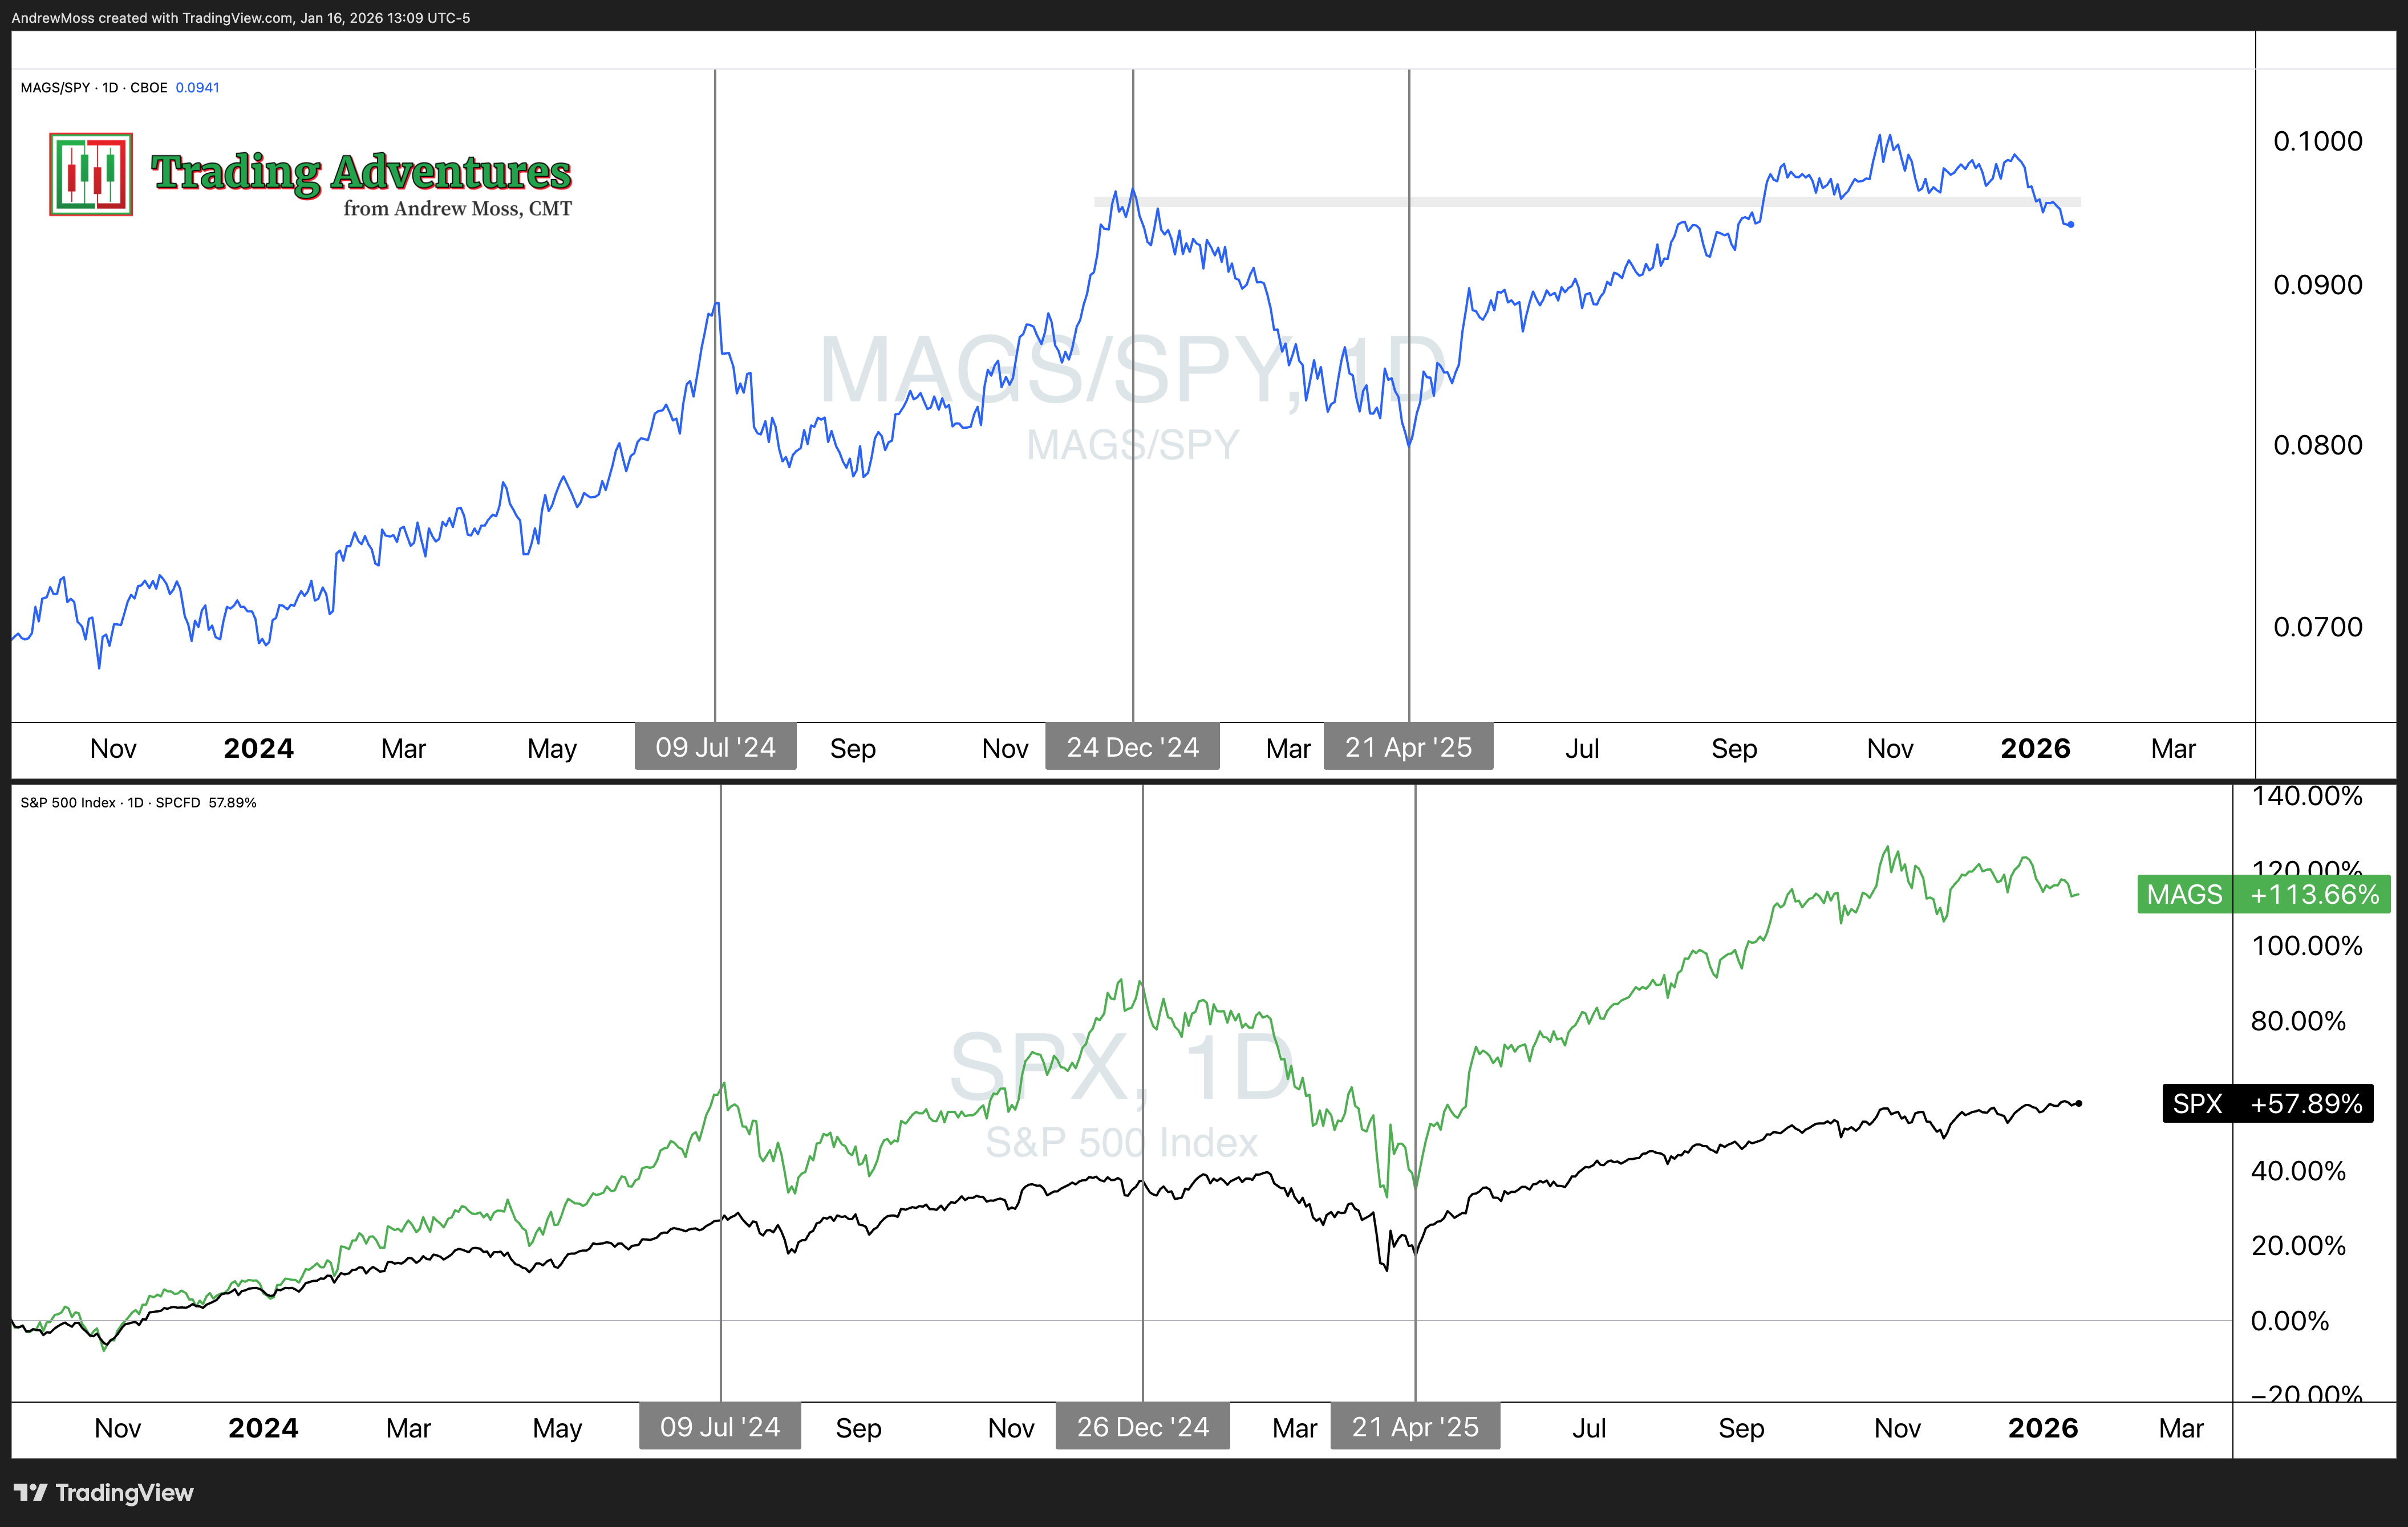
MAG7 vs SPX — Long-Term Context
While short-term leadership has rotated, the chart below shows the MAG7 are still up +113% versus +58% for the S&P 500 since late 2023.
The MAGS/SPY ratio (top panel) has been consolidating for months and is now showing signs of breakdown. Sure, that breakdown could continue—possibly pulling the broader market down with it.
But if this move fails and the ratio base resolves higher, a return to leadership from the MAG7 could act as fuel on top of an already strong market structure.
Breadth, Rotation, and Strength Everywhere Else
While MAGS may be lagging slightly, everything else is working—and working well.
Strong breadth — The percentage of S&P 500 stocks above their 50-day is climbing steadily.

More than 70% of NYSE stocks are above their 200-day MA — This setup has led to +17% average forward 12-month returns.
 Subu Trade@SubuTradeFor the first time since 2024, almost 70% of NYSE stocks are above their 200 day moving average. Similar historical instances of broadening breadth saw $SPX higher each time 9-12 months later, with an average 1 year gain of 17% h/t @RyanDetrick @JC_ParetsX
 12:35 PM · Jan 15, 2026 · 27.7K Views7 Replies · 55 Reposts · 345 Likes

All 11 S&P sectors are above their 200-day moving averages—a breadth condition that historically delivers 11.5% annualized returns.
 Grant Hawkridge@granthawkridgeEvery sector is trending higher... 100% of S&P 500 sectors are above their 200-day moving average. This is what bull markets look like under the surface. Are you positioned for it? 👉stockmarkettv.com/2026-01-15/bre…
 10:02 AM · Jan 15, 2026 · 1.97K Views9 Reposts · 37 Likes
The Advance-Decline line is hitting new highs, confirming price action.


Leadership rotation — Small caps (IWM) are showing relative strength.

Industrials and mid-tier cyclicals are leading the Dow, per Grant Hawkridge.


No stress from credit — High-yield spreads remain tight. No warnings from the bond market.

International participation — Emerging and developed markets are breaking out across the board.

Also, The January Barometer, Bullish Percent Indices, Emerging Markets breaking out …
We could go on and on. But that’s already a ton of solid supporting evidence. You get the idea.
Huge thanks to Ryan Detrick, Grant Hawkridge, SubuTrades, Jeff Hirsch, and others that consistently compile and share these stats. I’ve shared and reposted a ton of their work on X recently. See on their streams, or mine. Or just check out my Stats and Data list here:
Stats and Data
Final Word
Everything else is working. Breadth. Rotation. Global strength. No red flags from credit.
We don’t know what happens next. Maybe the MAG7 roll over and drag the market down. Anything is possible.
But based on the current data, the odds favor sustained strength. And if the MAG7 come back online—reclaiming their moving averages and anchored VWAPs, regaining relative strength, reasserting leadership—then this market doesn’t just stay strong.
It rips higher.
We’re not here to make predictions. We’re here to follow the evidence.
And right now? This looks like the sole missing peice of an otherwise stacked setup.
Important: This content is provided for educational purposes only. If you’re reading this online, please review the full disclosure here.