


The Streak Is Snapped
Market Update Thursday November 9, 2023
The Markets
Stocks have soared higher for over a week with SPY rising eight consecutive days and QQQ clocking a 9-day streak. The SP 500 was higher by more than 7% and QQQ was up nearly 10% at the peak this morning when it looked like days nine and ten could materialize.
Sellers finally regained control at about 10:00 AM sending prices lower. Then the selling got a boost as Jerome Powell spoke and a Treasury bond auction rattled the rate market.
With that, we will shift focus to the potential support levels and see how strong the market really is.
The first signs on the roadmap were the 5-day MA, the week-to-date anchored VWAP, and the VWAP anchored to the July highs.
SPY prices are below all of those levels now with QQQ following closely behind.
65-minute chart

On to the daily charts.
The Charts
SPY found resistance in the shaded s/r zone after testing it for four days. Today’s bearish engulfing candle signals the reversal and now we watch the various gap levels and moving averages below.

QQQ is doing the same thing with the exception being that the gap is further below. There is also the added potential that a successful retest of the breakout from the downtrend line could prop prices up.

IWM moved up further and faster than SPY. So it’s no surprise that it is leading the way lower. Holding above this gap area to put in a higher low would be a great (perhaps unlikely) move.

DIA has turned lower at the trendline but remains above the key moving averages. $338 is an important level - the 8, 50, and 200-day MAs are all there.

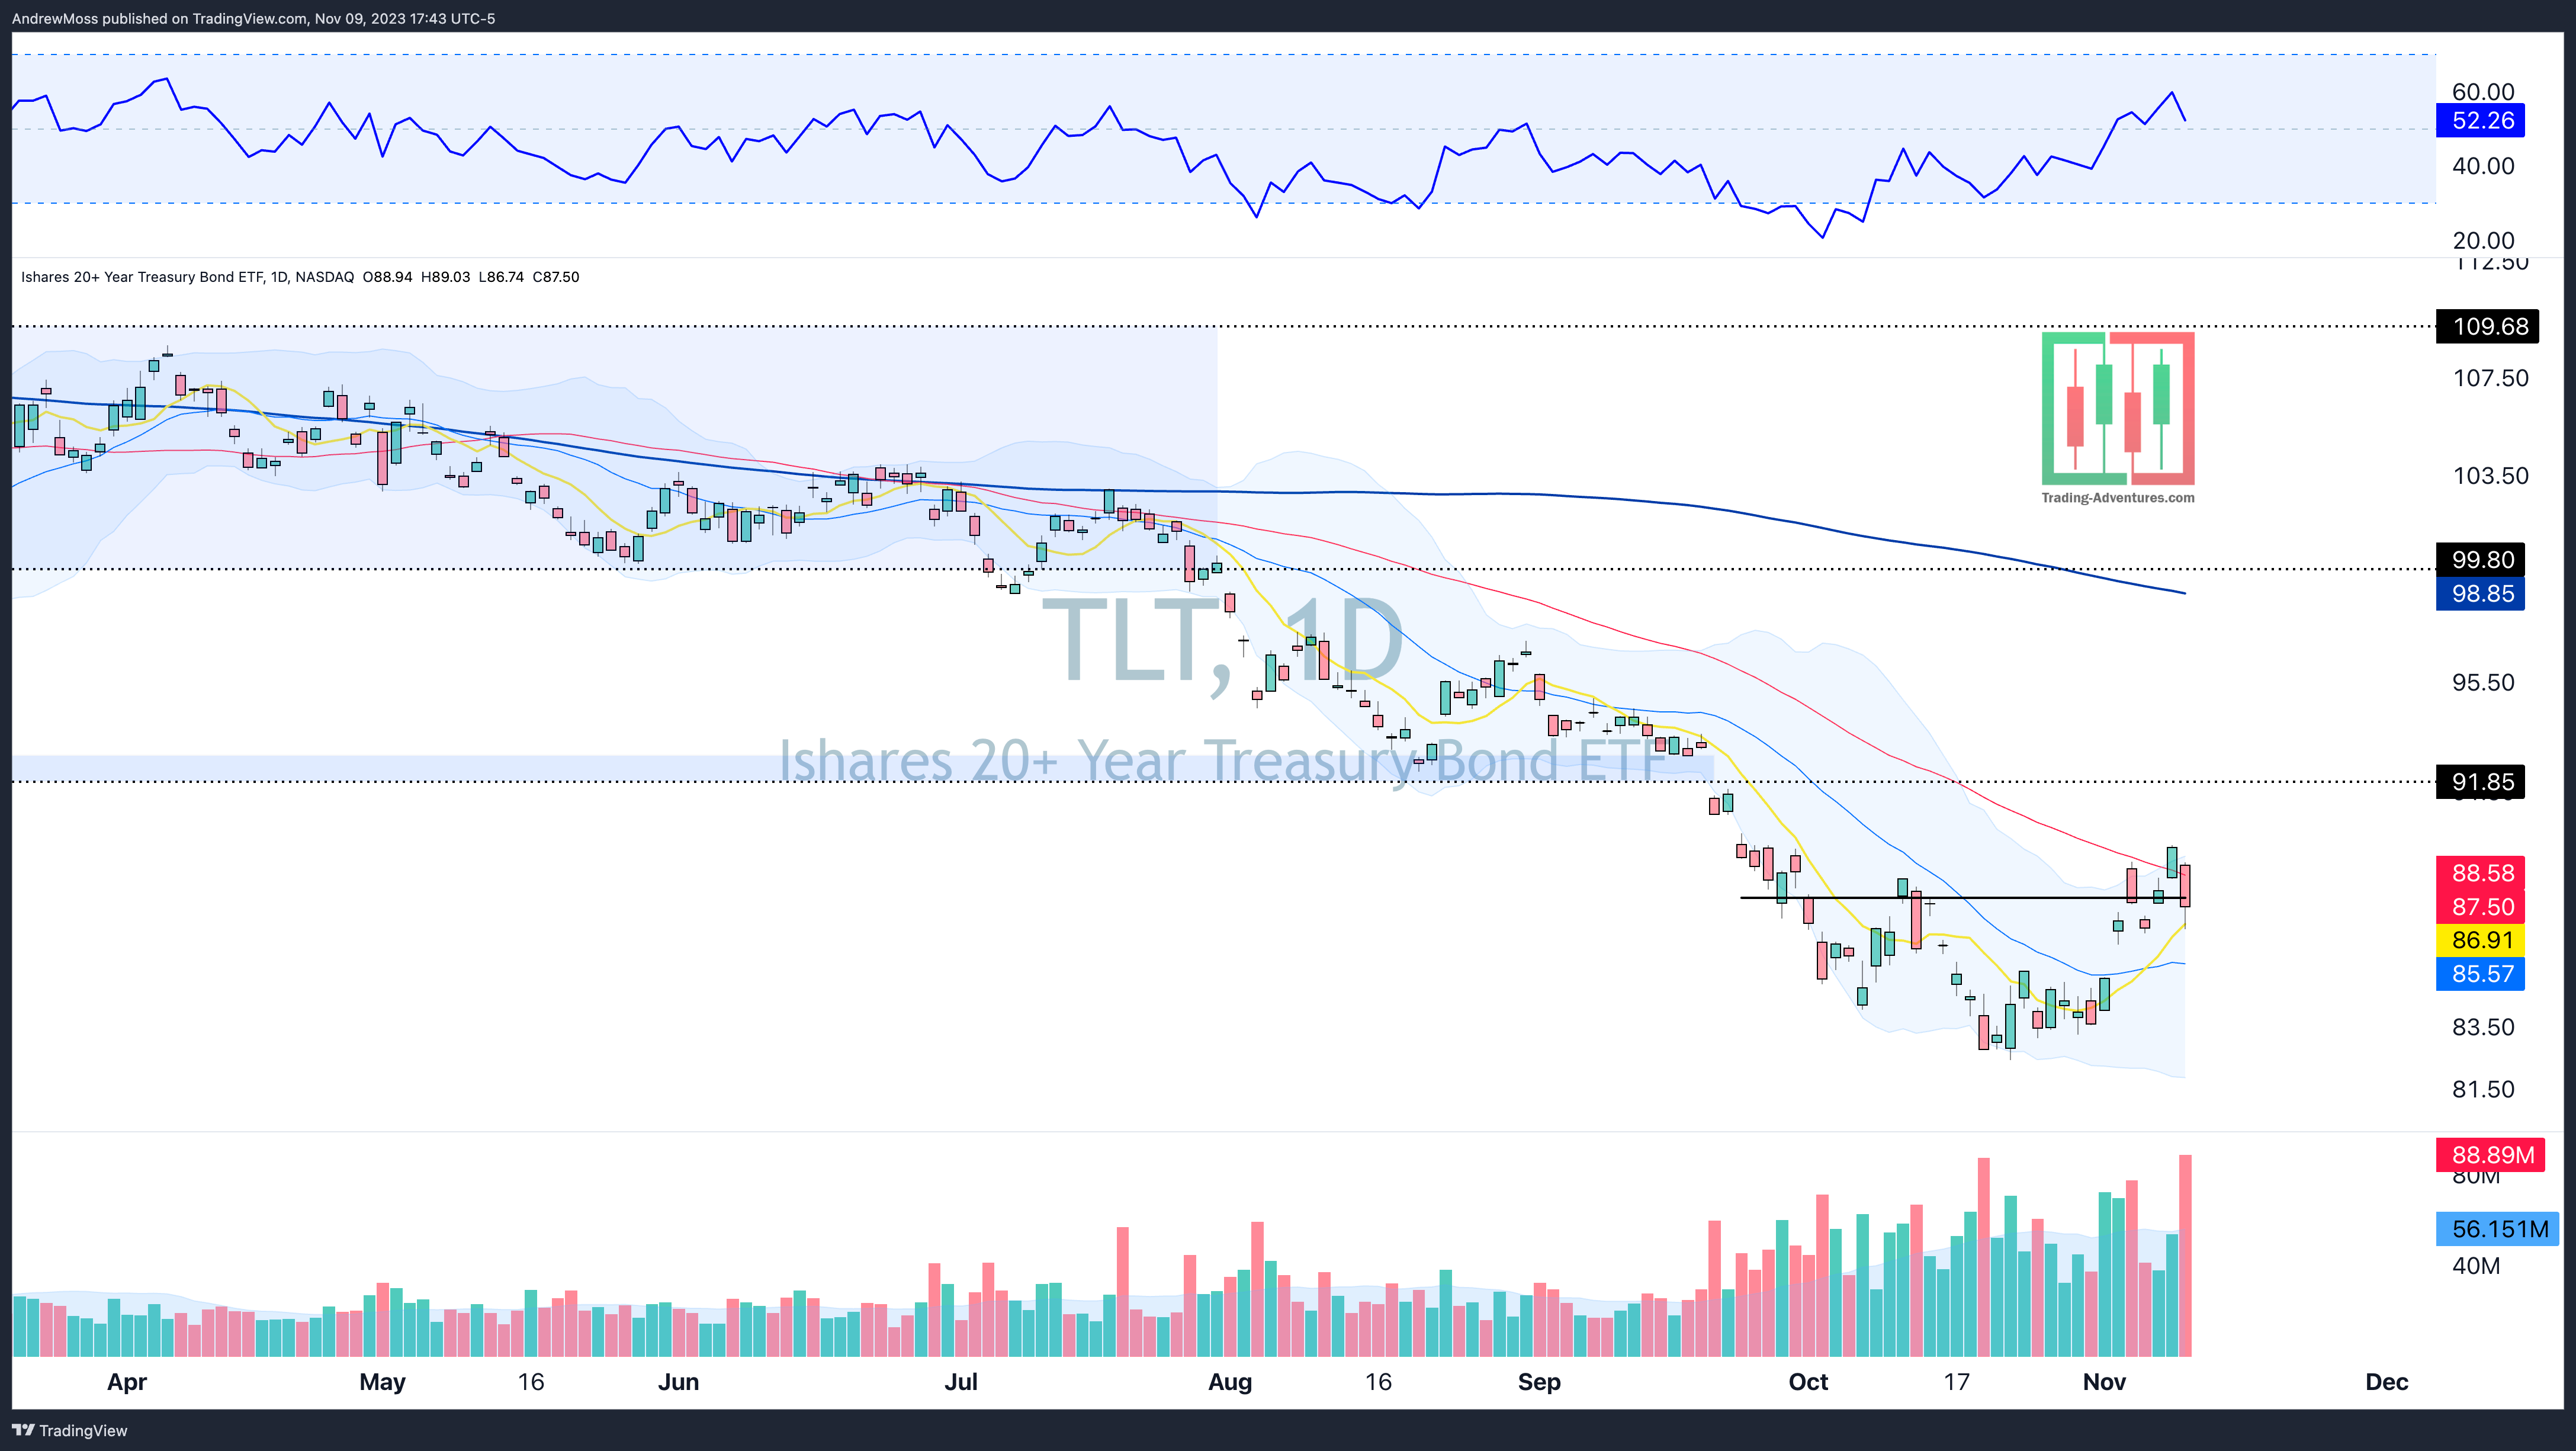
TLT gets the 8/21 cross and regained some strength after the auction selloff. A quick move back above the 50-day MA would be best.
DXY The Dollar has rallied this week to keep everyone guessing.

VIX The eight-day drop in volatility has gotten lots of press this week. We’ll see if it can stay at these lower levels.

The Closing Bell
So far the action isn’t troubling. This is a ‘day to take notice.’
Now we see if this recent move is for real and find out if the market really changed character.
If so, the major indexes should be able to stay above the recent pivots, gaps, and the 8 and 21-day MAs.
If not, we will know it by watching those potential support levels fail.
Small caps are an exception. While the other indexes remain above all of the moving averages, IWM is no longer above any of them. So we’ll continue to take clues from it, as well as oil, rates, and the dollar.
We’ll take a bigger look at the Weekly Charts on Saturday morning.
See you there.
The Disclosures
***This is NOT financial advice. NOT a recommendation to buy, sell, or trade any security. The content presented here is intended for educational purposes only.
Andrew Moss is an associated member of T3 Trading Group, LLC (“T3TG”) a SEC registered broker/dealer and member of FINRA/SIPC. All trades placed by Mr. Moss are done through T3TG.
Statements in this article represent the opinions of that person only and do not necessarily reflect the opinions of T3TG or any other person associated with T3TG.
It is possible that Mr. Moss may hold an investment position (or may be contemplating holding an investment position) that is inconsistent with the information provided or the opinion being expressed. This may reflect the financial or other circumstances of the individual or it may reflect some other consideration. Readers of this article should take this into account when evaluating the information provided or the opinions being expressed.
All investments are subject to the risk of loss, which you should consider in making any investment decisions. Readers of this article should consult with their financial advisors, attorneys, accountants, or other qualified investors prior to making any investment decision.
POSITION DISCLOSURE
November 9, 2023, 4:00 PM
Long: DDOG, IWM, SQ, DDOG1117C100, TN1117C25.50, TWLO1117C60
Short:
Options symbols are denoted as follows:
Ticker, Date, Call/Put, Strike Price
Example: VXX1218C30 = VXX 12/18 Call with a $30 strike