


The Trend is Your Friend
Weekend Market Update July 7, 2023

The Market
Stock prices tend to trend. That is one of the basic tenets of charting and technical analysis. And once a trend is in place, it can be a very good friend.
The trend is your friend, until the end, when it bends.
- Ed Seykota
Ed Seykota is one of the original systems traders and trend-follower. In an endless sea of stock market sayings and 'isms,’ this one stands out again after being hidden away for a while.
Stock trends are powerful. And we need to use them to our advantage when we can. But prices don’t always trend.
The SP 500 had no up or downtrend for the period from roughly April 2022 to May 2023 as it traded on either side of 4200 several times. It was choppy and sideways with no follow-through or commitment.
That has changed. Even though many were skeptical while SPX was under 4200 (myself included), the uptrend has been back for a while and it’s probably a good idea to be friends with it.
It won’t last forever. And it won’t likely go straight up. But it is usually wise to invest and trade in the direction of the overall trend.
The Charts
SPY nearly touched the 21-day MA yesterday before printing a hammer candle on the 8-day. The follow-through today confirmed the pattern early and had prices moving back toward recent highs. Then a rather abrupt late-day selloff gave the pattern a different look. Short-term it may have lost some power. Medium and long-term it’s still an uptrend.

QQQ has literally the same action as SPY. Uptrend.

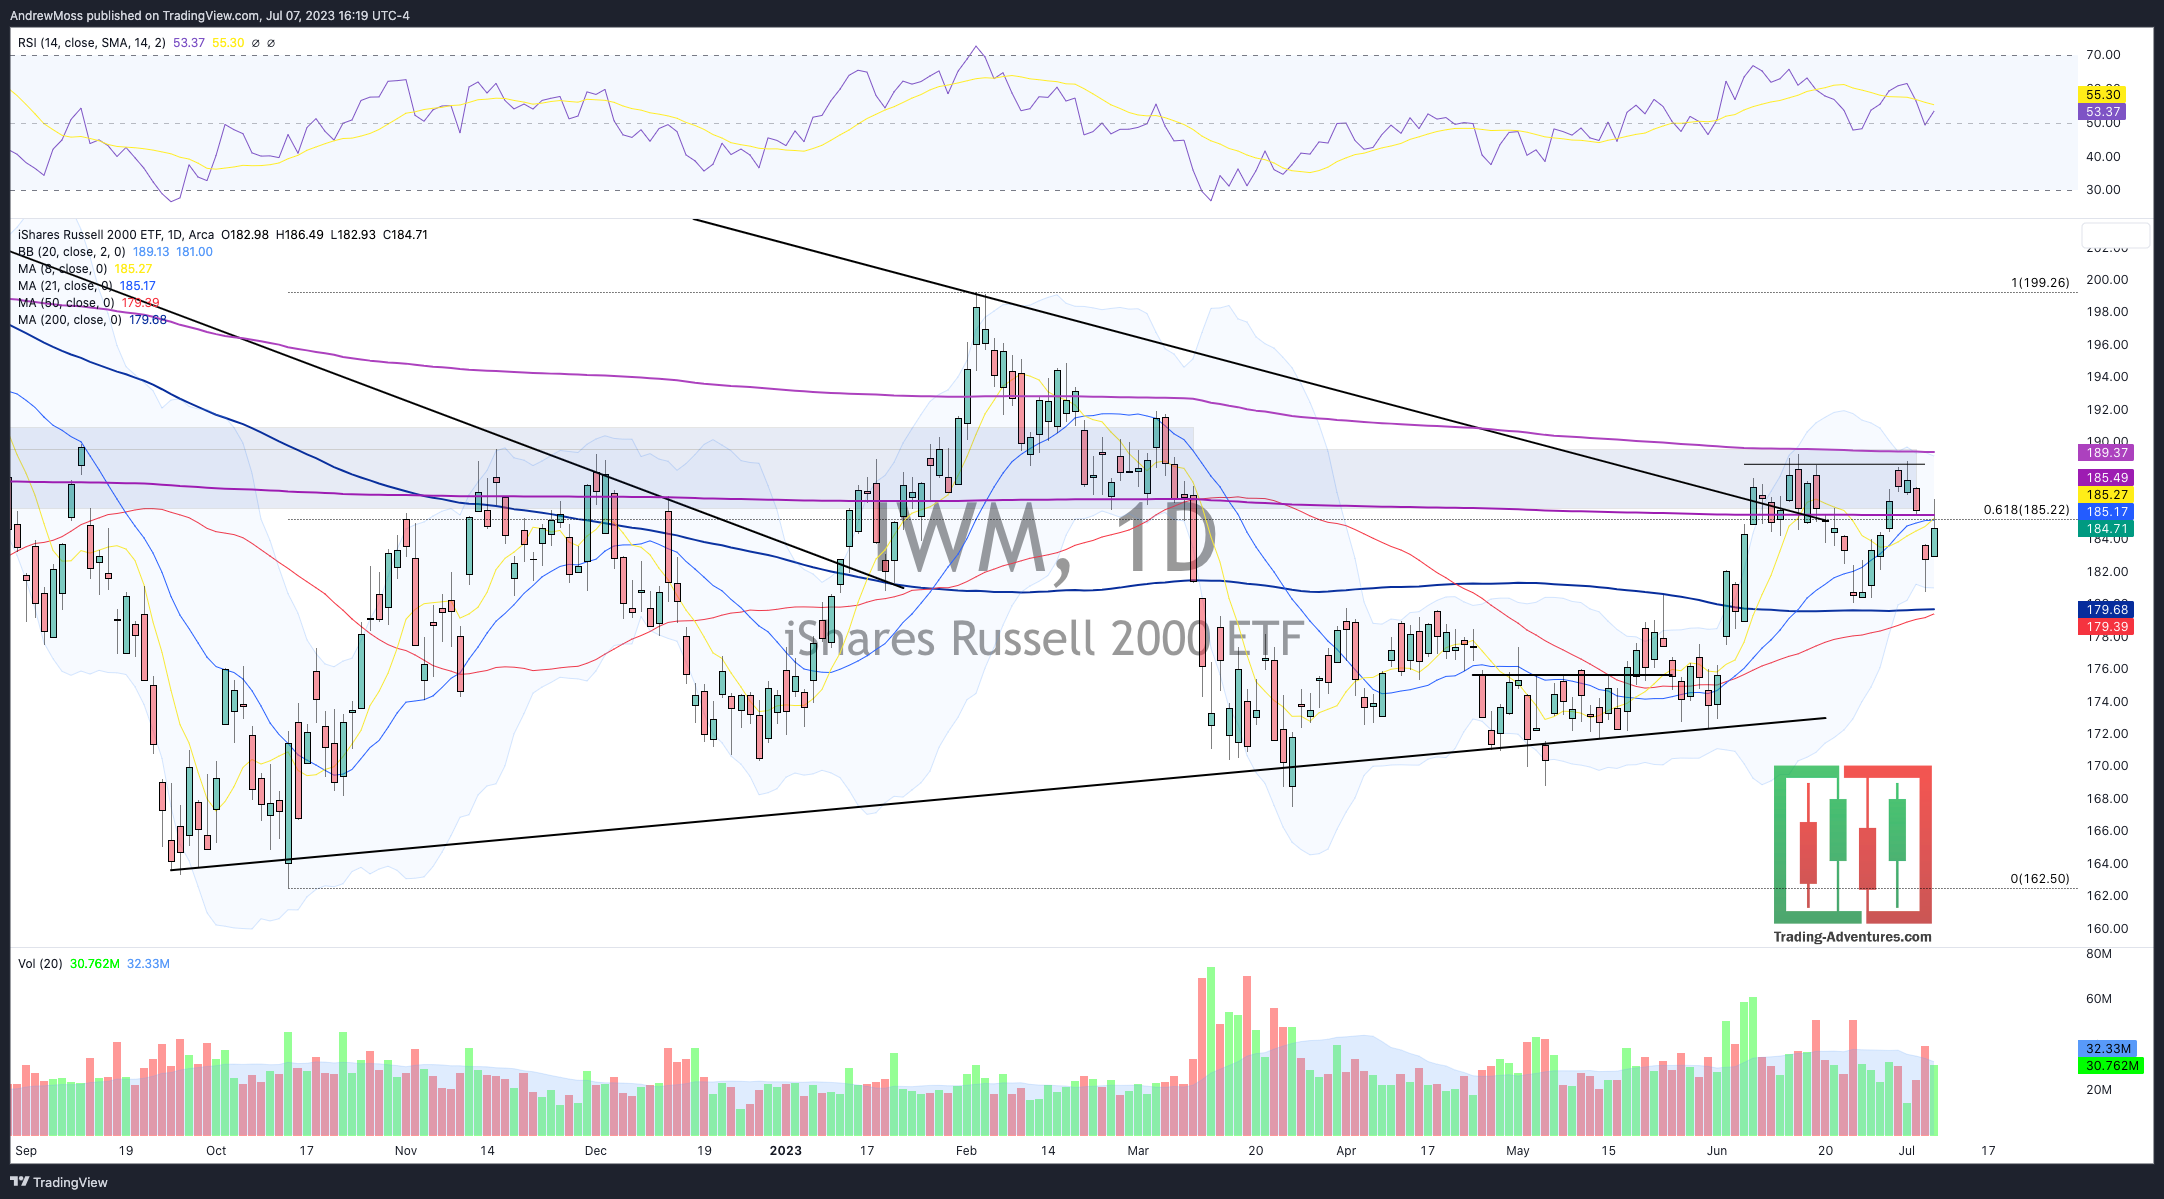
IWM is still working on it. There have been major improvements here. But this one does not yet qualify as an uptrend. The 50-day MA is close to crossing above the 200-day MA. That’s a start. But we also need to see higher highs and higher lows. And that means prices over $190 and then $200. It did hold up much better than SPY and QQQ during the late-day action.
DIA is also waiting to catch up. The base is long and the move out of the base could be significant. But we’re still waiting on a move above $345 to confirm.

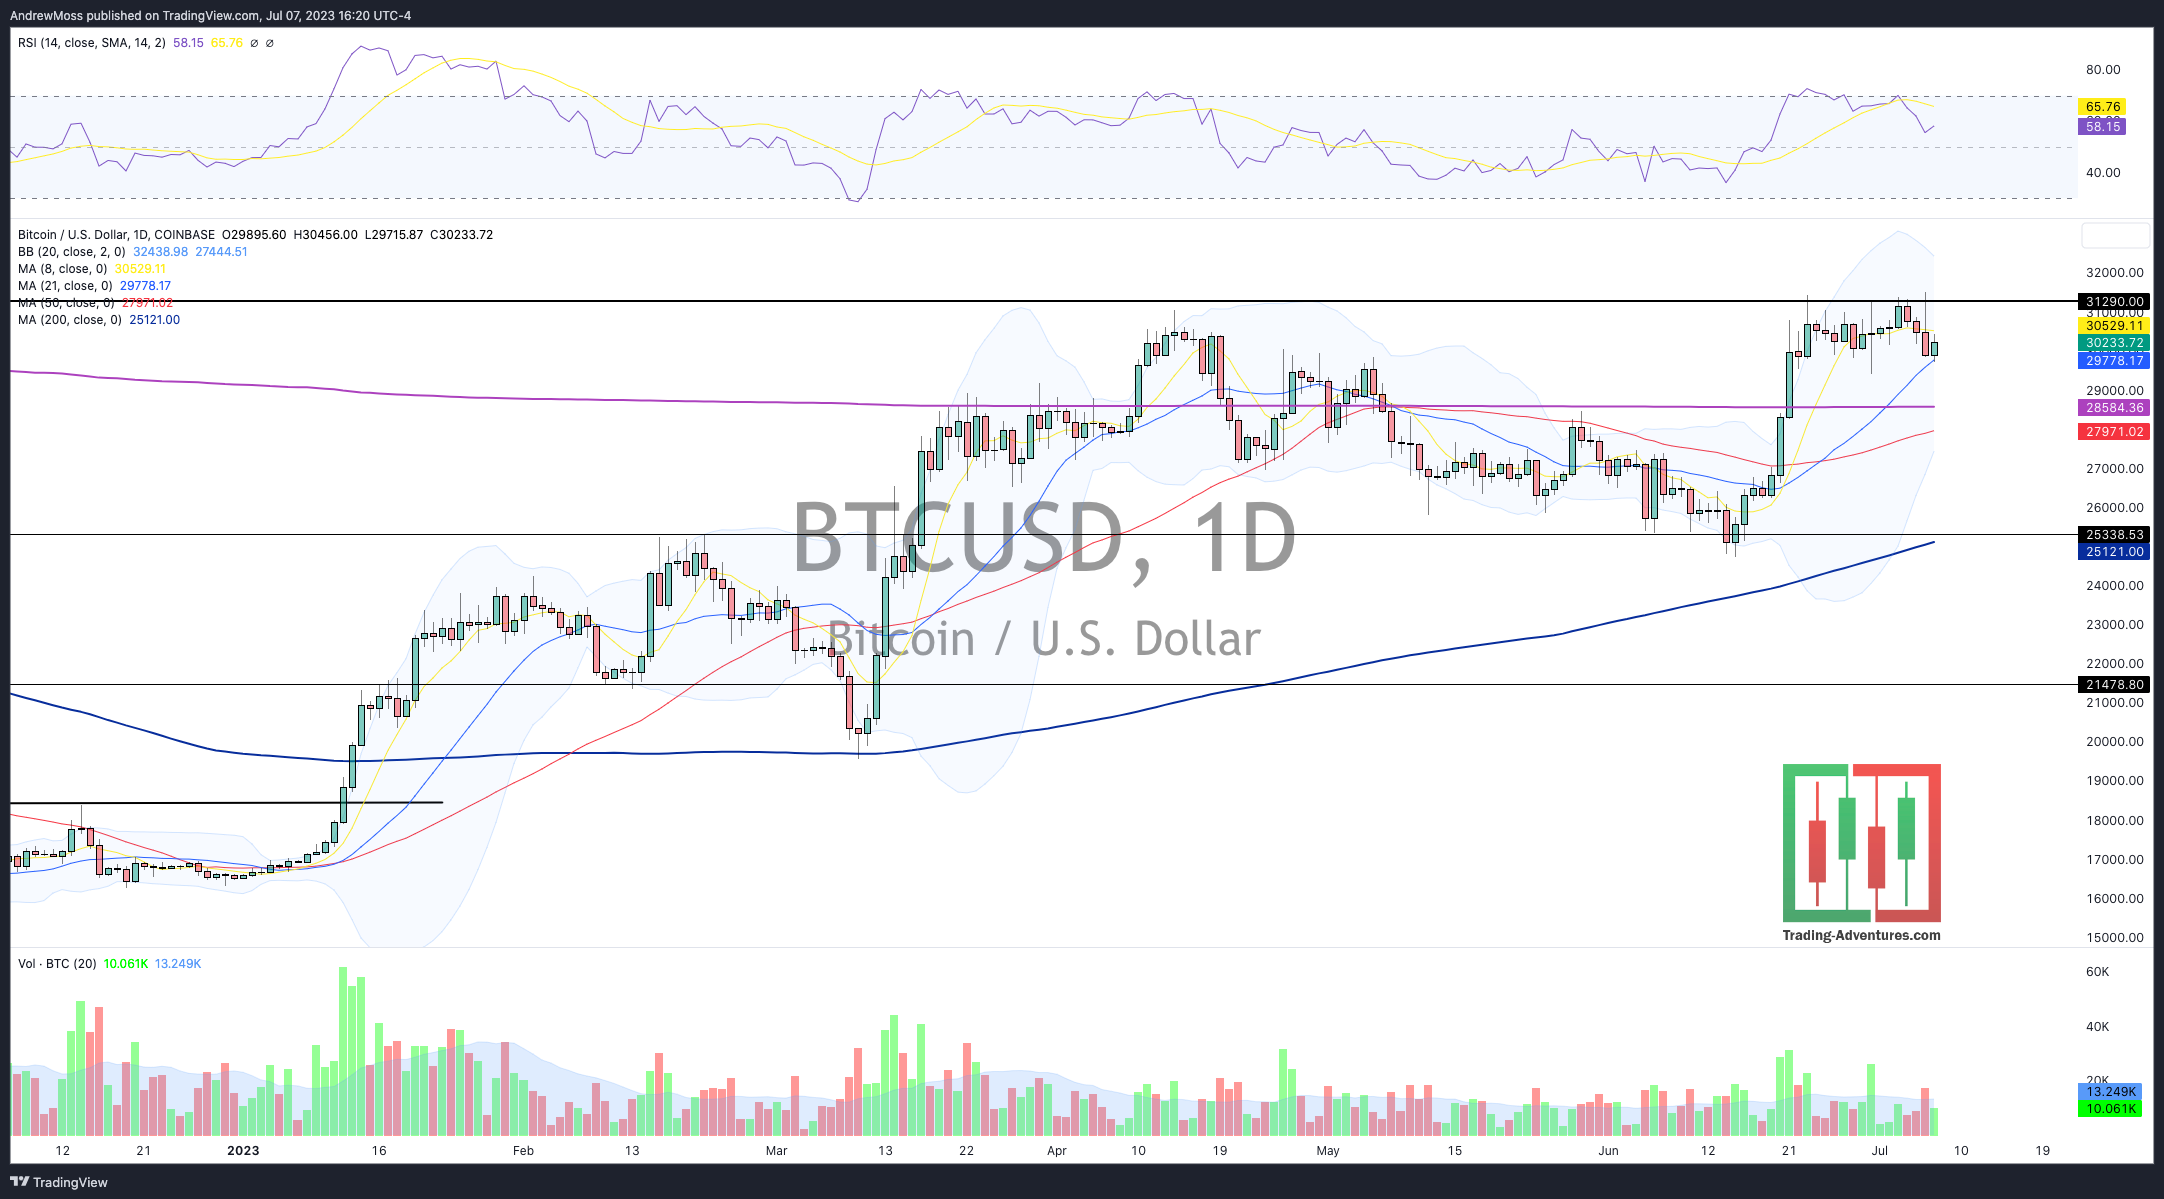
BTC is uptrending, although it has been a bit more erratic. It’s hugging the 8-day MA for weeks and needs to see prices over $31,300 to begin the next leg higher.
The Closing Bell
Dip and bounce. That’s what uptrends do. This week there were many names that touched their 21-day MAs for the first time in weeks. So far the bounces are holding.
Tomorrow morning, as usual, we’ll check in on the weekly charts and look for evidence of longer-term uptrends.
Join me here, on Twitter.
The Disclosures
***This is NOT financial advice. NOT a recommendation to buy, sell, or trade any security. The content presented here is intended for educational purposes only.
Andrew Moss is an associated member of T3 Trading Group, LLC (“T3TG”) a SEC registered broker/dealer and member of FINRA/SIPC. All trades placed by Mr. Moss are done through T3TG.
Statements in this article represent the opinions of that person only and do not necessarily reflect the opinions of T3TG or any other person associated with T3TG.
It is possible that Mr. Moss may hold an investment position (or may be contemplating holding an investment position) that is inconsistent with the information provided or the opinion being expressed. This may reflect the financial or other circumstances of the individual or it may reflect some other consideration. Readers of this article should take this into account when evaluating the information provided or the opinions being expressed.
All investments are subject to the risk of loss, which you should consider in making any investment decisions. Readers of this article should consult with their financial advisors, attorneys, accountants, or other qualified investors prior to making any investment decision.
POSITION DISCLOSURE
July 7, 2023, 4:00 PM
Long: ADBE0721C490, AMZN0721C130, AMZN0721C135, ENVX0721C18, FSLR0721C200, GOOGL, GOOGL0714C123, IWM, IWM0721C185, MSFT, NFLX0714C455, QQQ, QQQ0710P365
Short:
Options symbols are denoted as follows:
Ticker, Date, Call/Put, Strike Price
Example: VXX1218C30 = VXX 12/18 Call with a $30 strike