

The Whole World is Watching
Mid-Week Market Review January 18, 2023

The Whole World is Watching
It isn't easy to find a piece of market commentary these days that doesn't mention the downtrend line in the SP 500. It has been referred to on the charts included here, and elsewhere countless times.
The whole world seems to be watching this one, particular line. Everyone is a technical analyst. At least some of the time.
Many watching for a break will be quick to announce the birth of a new bull market if or when it happens. There could be a large degree of FOMO buying as a result. It’s not as simple as declaring a label. And ultimately the designation of a bull or bear market isn’t important.
What is important is building a case.
What does the weight of the evidence show?
What is the path of least resistance for prices?
That downtrend line is a key component of resistance, if for no other reason than the fact that everyone is watching. If prices can move beyond the resistance, then the path to higher prices gets easier.
On the spot
Now, like an embarrassed teenager suddenly put on the spot, prices have sunken back into the corner, trying to avoid eye contact and the unwanted attention.
Will they continue to hide if we stare too long?
Or will they try to sneak up through the levels above with an overnight gap, moving in darkness while no one is looking?
From Walter Deemer — "The market will do whatever it has to do to embarrass the greatest number of people to the greatest extent possible." -- Deemer's Law Of Pervesity
While the intra-day levels are exciting and fun to watch, keeping the bigger picture context in mind is important. If you didn't see the weekly charts over the weekend, you may want to review these first.
click to open
Resistance is still resistance.
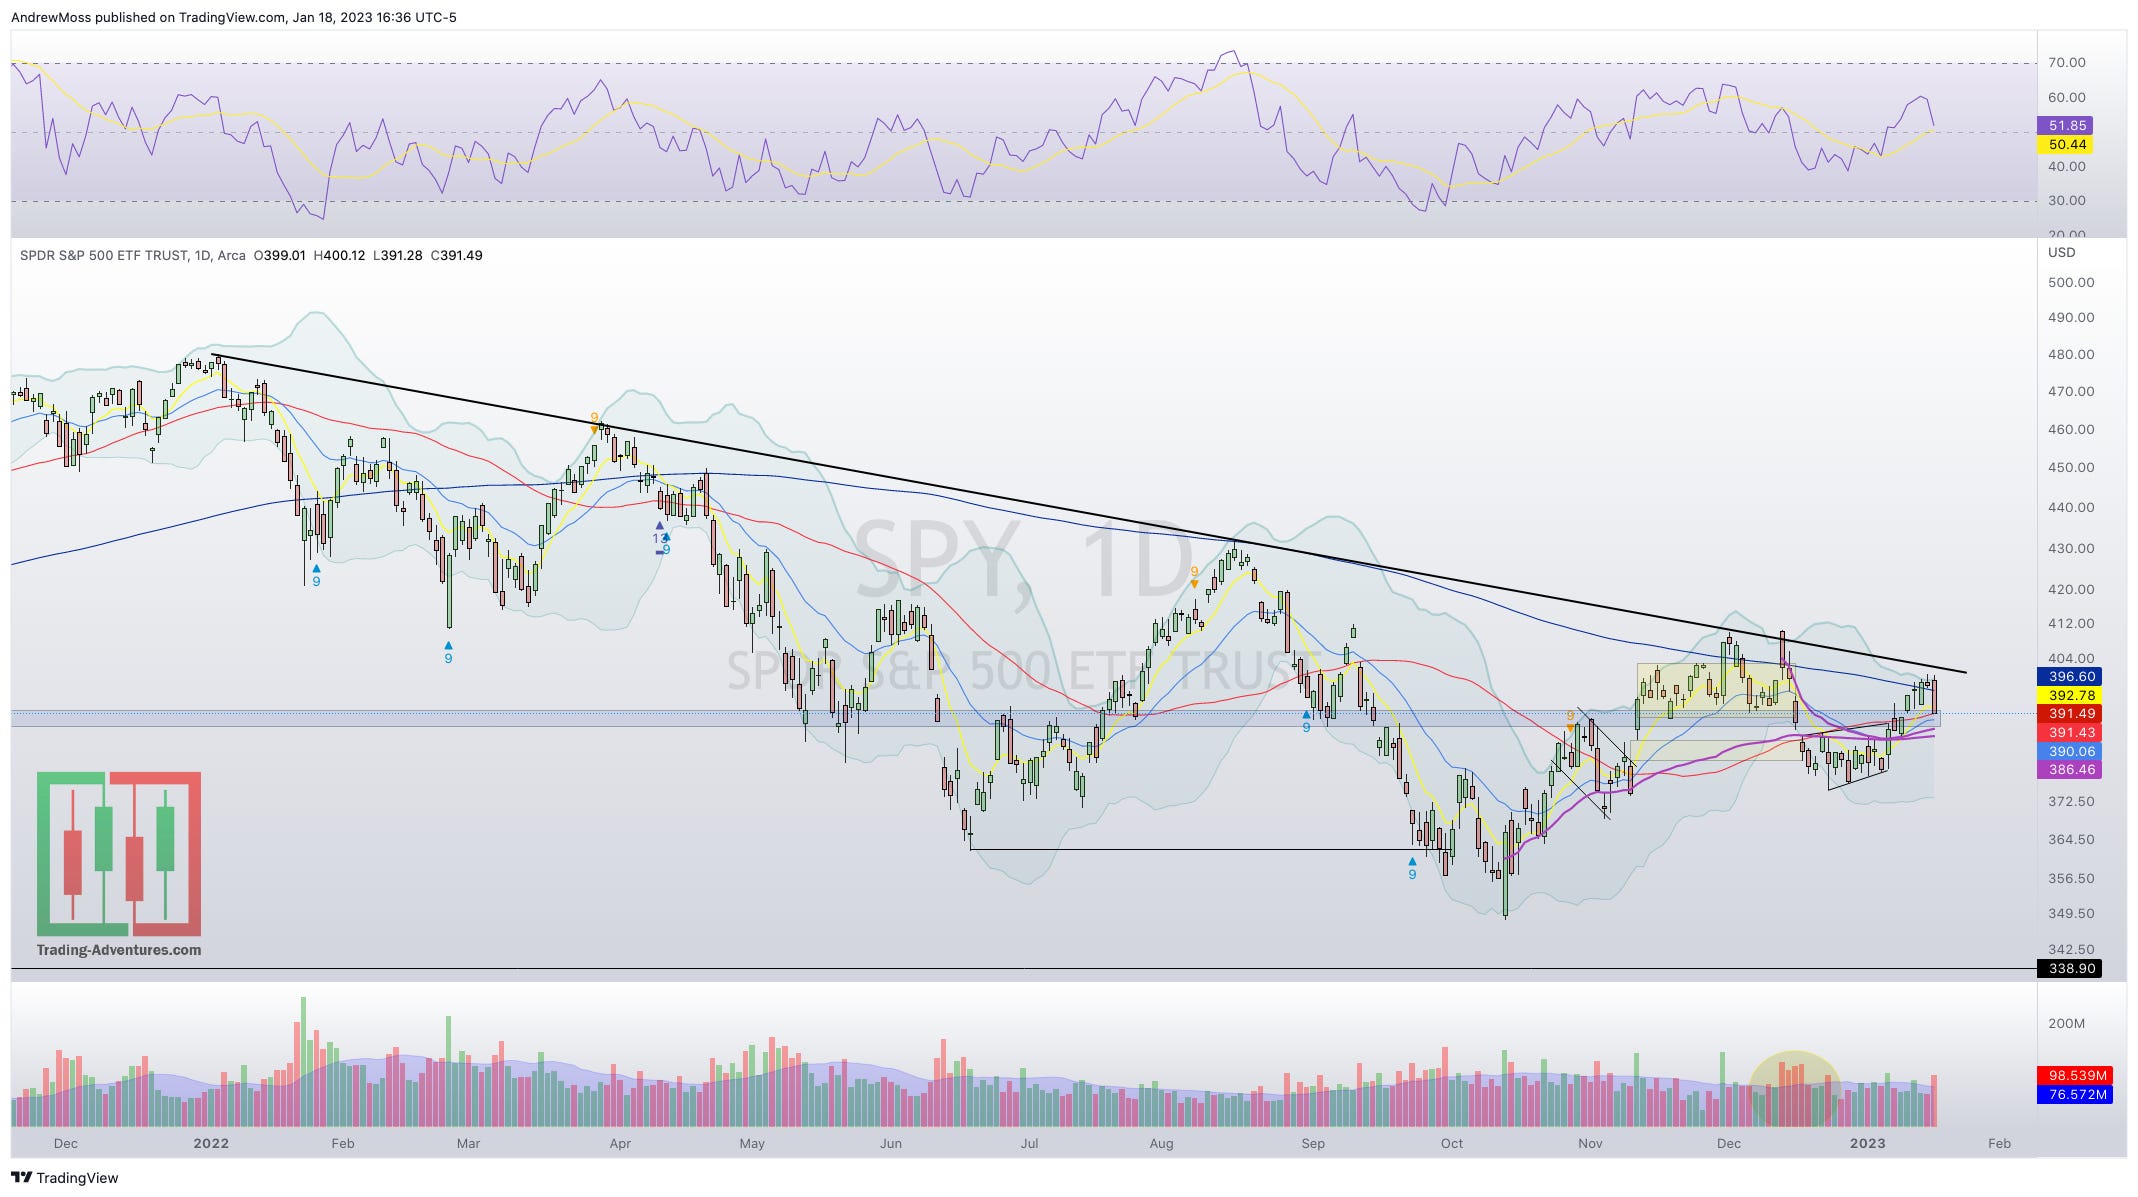
SPY hasn't passed the downtrend test. But it hasn't failed either. After a strong move up and over the 200-day MA, it's not surprising to see some selling. And I hesitate to call it a failed breakout just because it's now back below the 200-day.
There are many layers of potential support that could help prices higher. Though it closed beneath the 8-day EMA today, the 21 and 50-day MAs are close at hand. The volume-weighted average prices anchored to the December 13 pivot high and the October 13 pivot low are there as well.
If prices can stay above these levels, the bullish sequence is still in place.
QQQ is in a similar situation and has potential support in all the same forms.

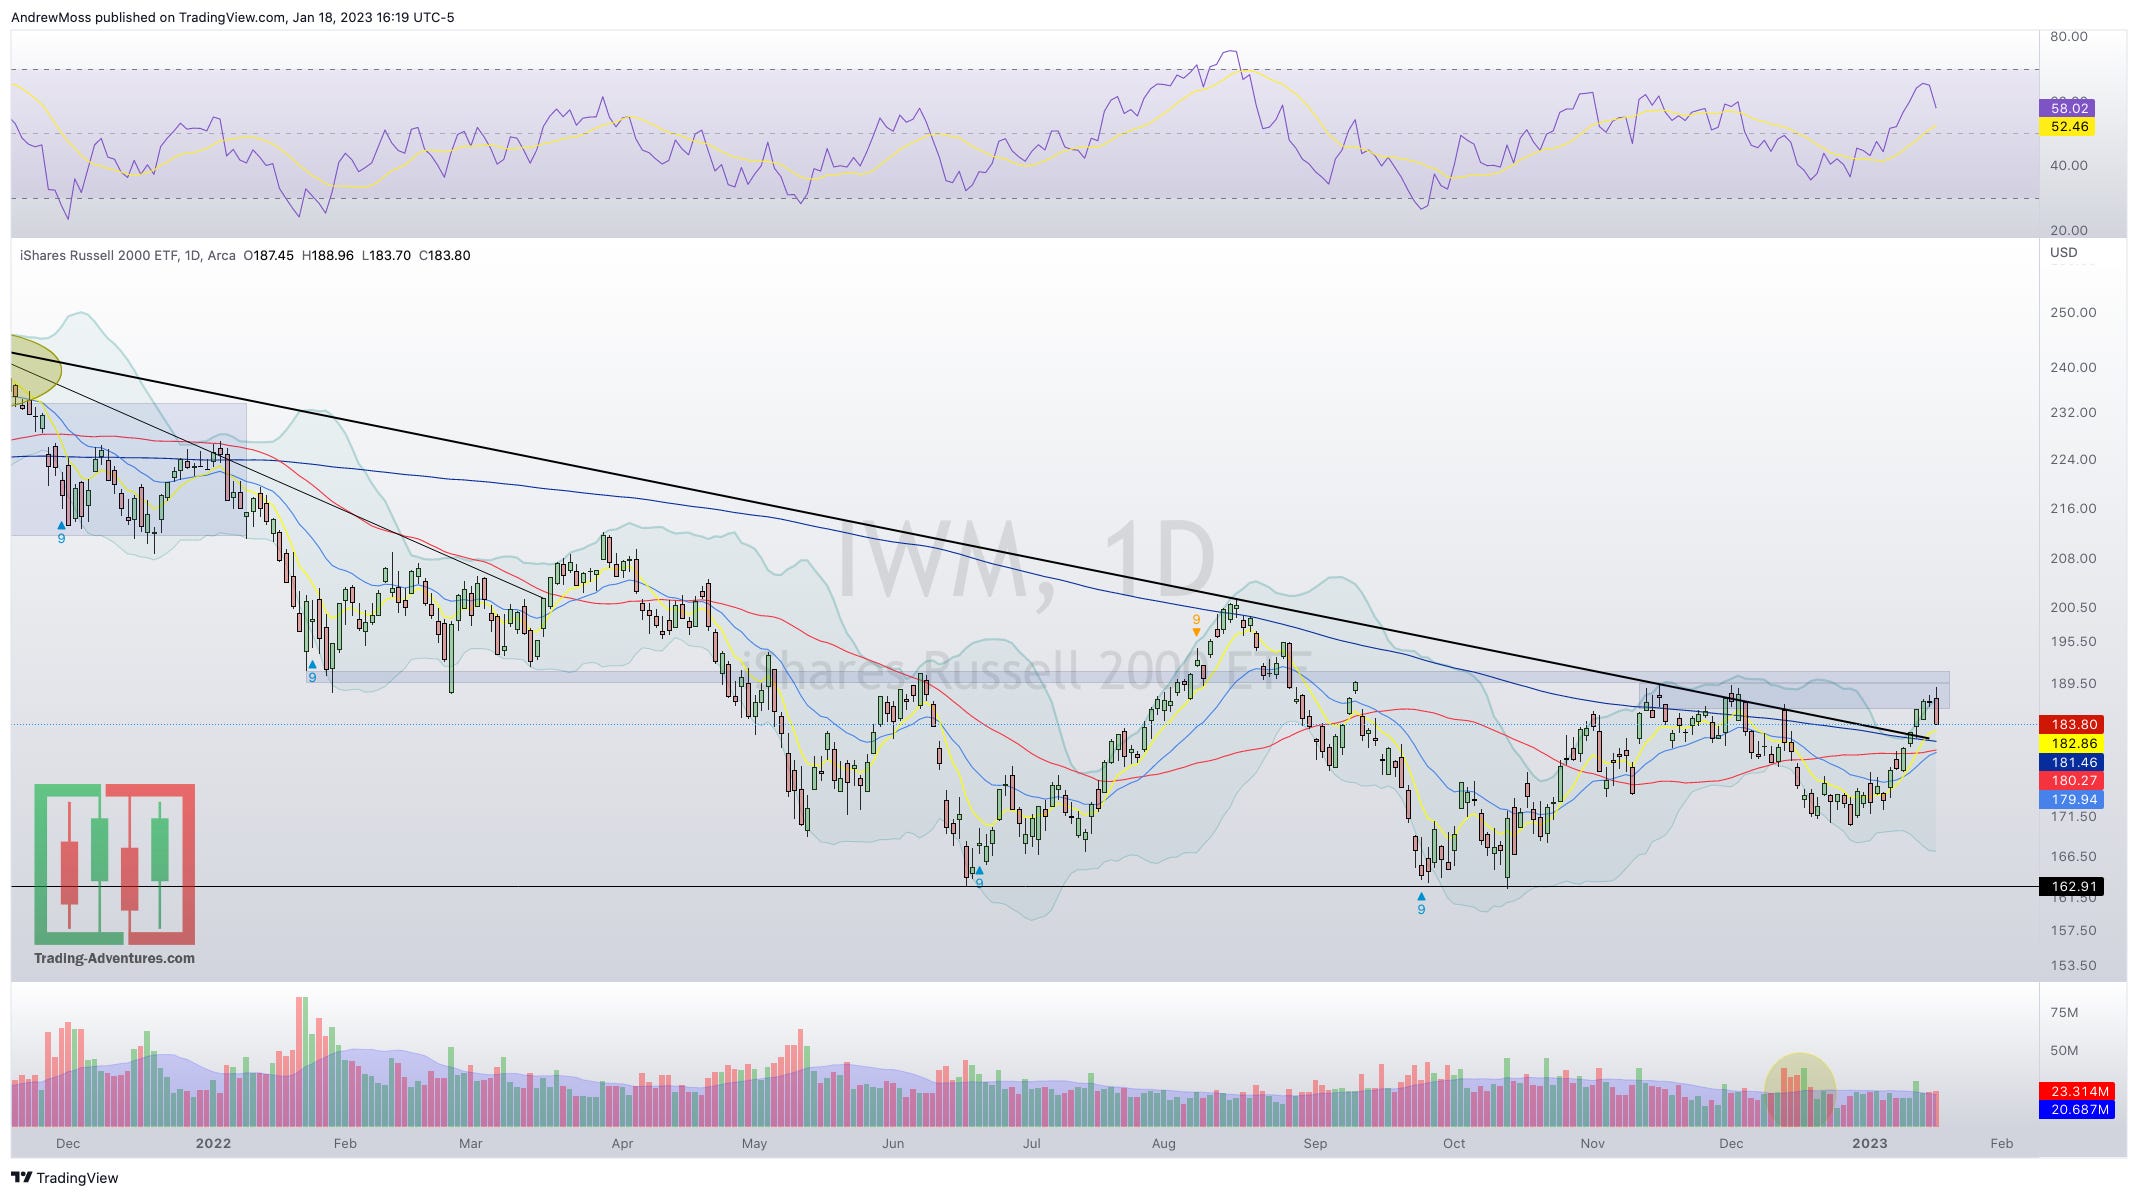
IWM has found resistance in the 186-191 area, as expected.
DIA is worth keeping a close eye on here. It has been leading higher for a while. Now it is leading lower as the first to tread below its 8/21/50-day moving averages and the Dec. 13 AVWAP. This could be a red flag. Continue to watch this for clues.

VIX is being a little bit tricky as it pokes back up into the range.

Here's a different view of $DXY. The price is inverted and is being shown next to the SP 500 futures $ES_F. The relationship here is changing as the 1/DXY chart has broken the pattern. The question is, will futures follow suit and make a higher high?

Once again we have inconsistent messages from the short, medium, and long time frames. But with prices tucked so tightly between resistance overhead and support underneath, something will give way soon.
The direction of that move will tell us where to look next.
***This is NOT financial advice. NOT a recommendation to buy, sell, or trade any security. The content presented here is intended for educational purposes only.
Andrew Moss is an associated member of T3 Trading Group, LLC (“T3TG”) a SEC registered broker/dealer and member of FINRA/SIPC. All trades placed by Mr. Moss are done through T3TG.
Statements in this article represent the opinions of that person only and do not necessarily reflect the opinions of T3TG or any other person associated with T3TG.
It is possible that Mr. Moss may hold an investment position (or may be contemplating holding an investment position) that is inconsistent with the information provided or the opinion being expressed. This may reflect the financial or other circumstances of the individual or it may reflect some other consideration. Readers of this article should take this into account when evaluating the information provided or the opinions being expressed.
All investments are subject to risk of loss, which you should consider in making any investment decisions. Readers of this article should consult with their financial advisors, attorneys, accountants or other qualified investors prior to making any investment decision.
POSITION DISCLOSURE
January 18, 2023 4:00 PM
Long: GE0120P77
Short: ALK, CLF, JETS
Options symbols are denoted as follows:
Ticker, Date, Call/Put, Strike Price
Example: VXX1218C30 = VXX 12/18 Call with a $30 strike