

Third time's a charm?
We've seen three solid bounces in the indexes. Will this one hold?

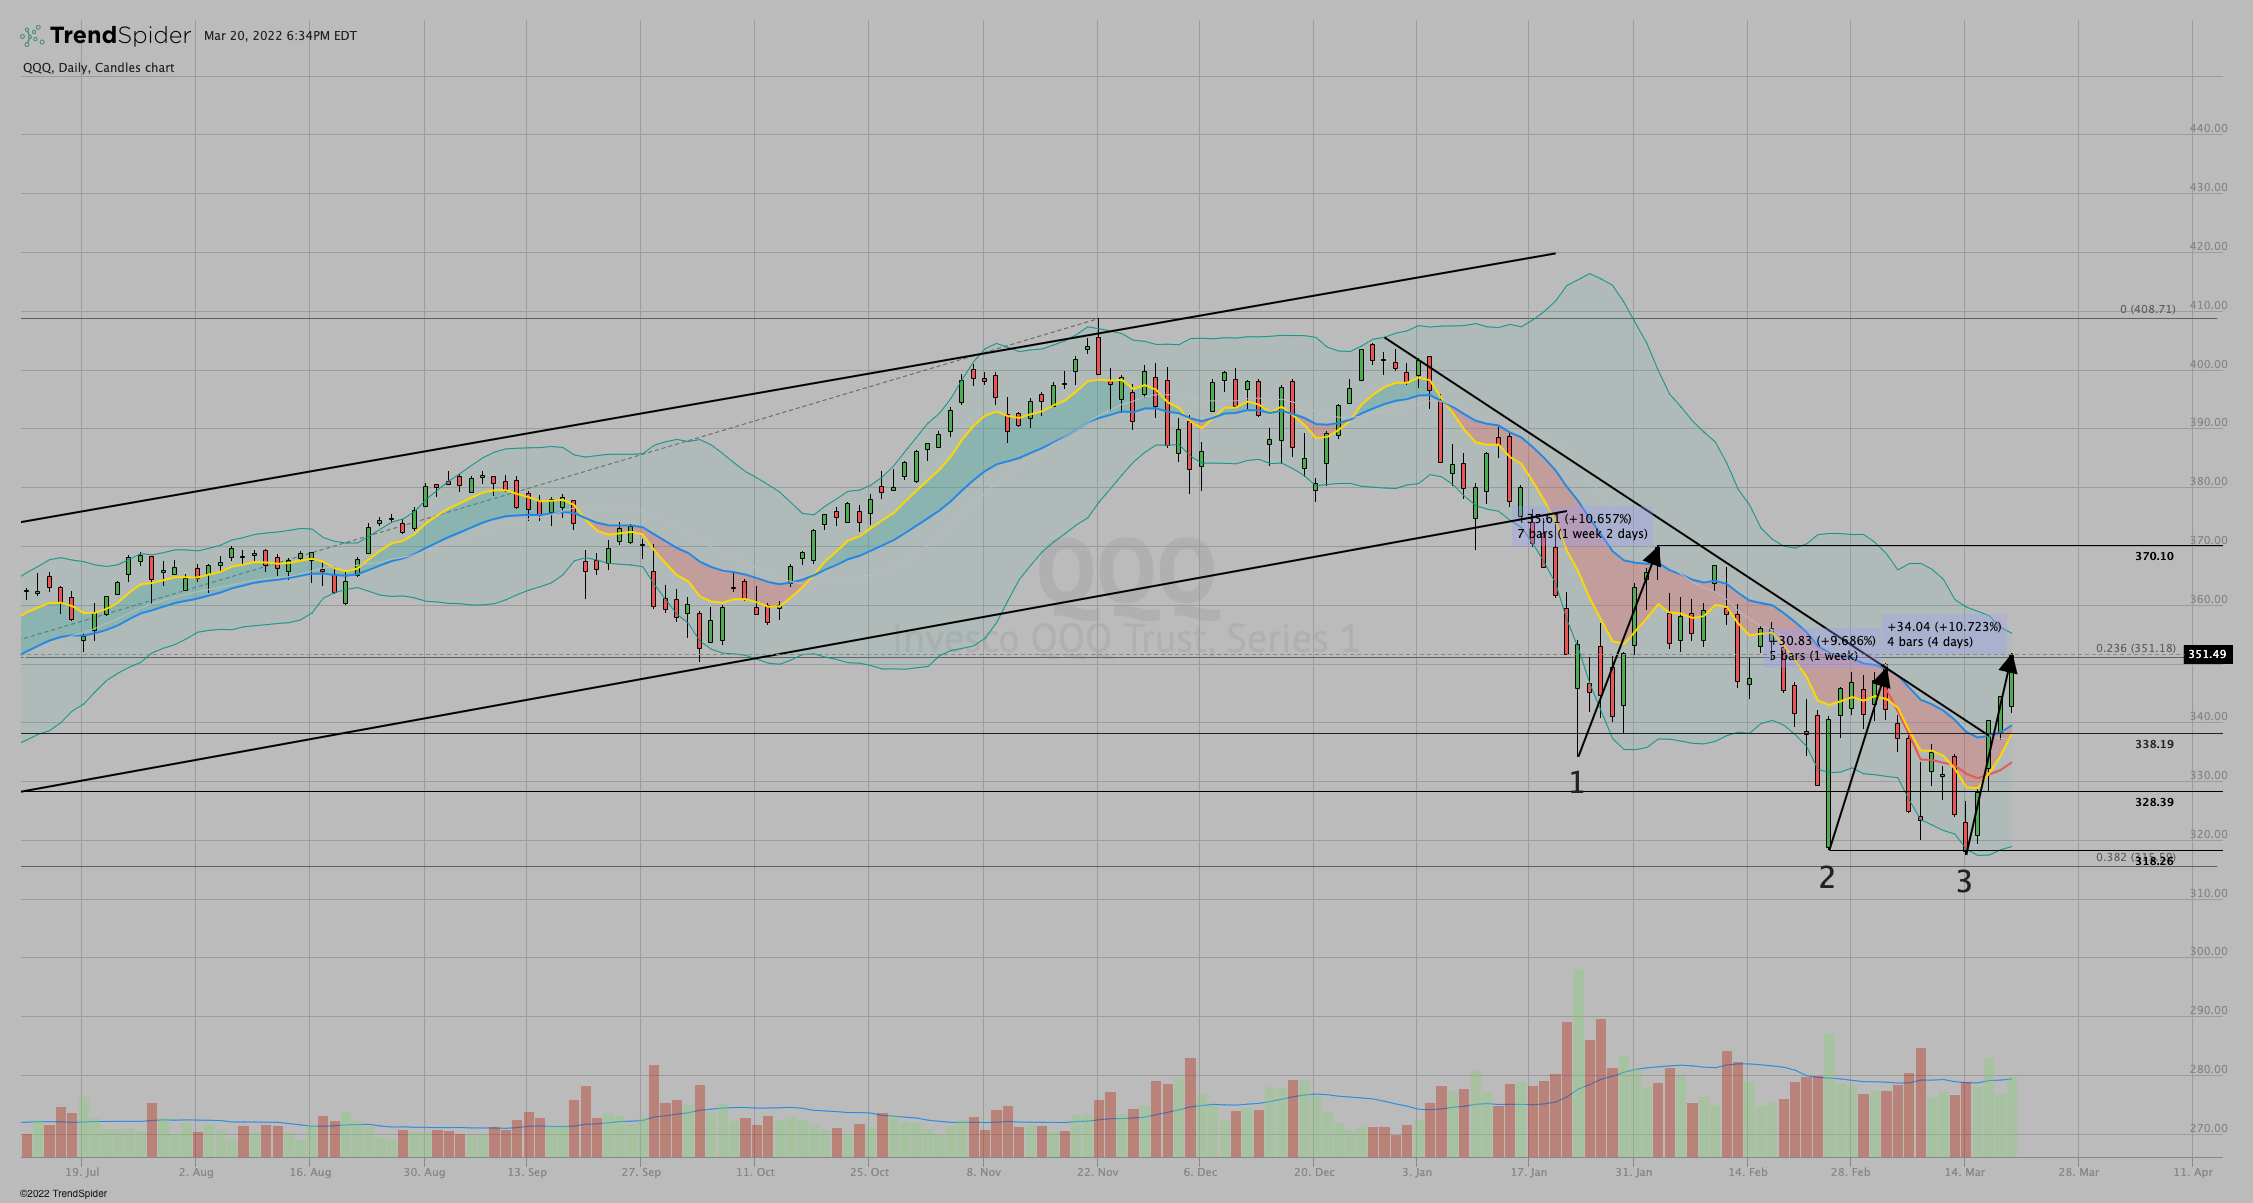
In some ways the charts are telling the same ‘ol story - a big move in 4 days.
$QQQ has jumped roughly 10% three different times now. $SPY and $IWM have made very similar bounces. The first two didn't hold.
Is the third time different? Here's why I think it will be.
$SPY and $QQQ broke the downtrend lines
$IWM has more to prove as it gets back to the major consolidation zone
The bounce for $QQQ and $IWM started from a good place as I pointed out here last Wednesday.

Then on Thursday Ryan Detrick showed us that the bullish action could prove to have significant meaning.
This was confirmed when he followed up with this stat.

JC Parets at Allstar Charts sees it too. And he sums it up very well here.
https://allstarcharts.com/breadth-thrusts-are-starting-to-add-up/
He and I are watching some of the same things. And goes on to add,
"So just to reiterate my main point, the number of breadth thrusts are adding up.
And one thing we know from experience is that breadth thrusts are not evidence of exhaustion. In fact, it’s quite the opposite.
We regularly see clusters of breadth thrusts near the beginning of new uptrends, and early in Bull Markets.
Make what you will of it, but it doesn’t surprise me one bit.
Sentiment has been bleak, with some of the most bearish readings in over half a decade, even worse than during Covid.
We’re buying stocks."
Many top-notch technicians and chartists I read are forming similar opinions. Makes sense, we’re all looking at the same charts and the same price action. But as JC points out, sentiment has been in the gutter. Most of Wall St. is still very bearish. As the bears come to grips with FOMO and start making the turn their buying should add fuel to the bullish run.
The layers of probability are stacking up. After such a move it makes sense to see some profit taking and sideways price action for a few days.
But anything can happen.
Be ready.