Special Announcement!
TradingView has confirmed its Black Friday Sale begins!
This is your chance to get an upgraded plan—with best-in-class trading alerts, multiple chart layouts, advanced indicators, and much more at up to 70% off + 1 month free!
Claim your offer now:
Find the plan that works best for your trading needs.
TradingView's Black Friday offer does not last long. Don’t miss out!
Get your plan now.
The Markets
Thanksgiving is coming. The markets are closed on Thursday and half of Friday.
It’s sure to be a quiet, uneventful week. Right?
Maybe not.
NVDA reports earnings tomorrow after the close. The results, and more importantly the reaction to the results will have an impact on the market.
Here’s a preview.
And that’s not the only AI-centric business making headlines this week. The latest stock market soap opera centers around the (former?) head of OpenAI, Sam Altman …
being unexpectedly fired by the company’s board of directors
potentially hired by Microsoft, a big investor and shareholder of OpenAI
then potentially going back to OpenAI on the condition that the entire BoD be fired
a move that was reportedly supported by more than 500 of OpenAI’s 700 employees
these same employees threatened to quit if Altman was not reinstated
then….??? Who knows?
Truly bizarre.
The primary implication today is that Microscot stock is soaring to new all-time highs and taking QQQ with it to a new YTD high.
Let’s go to the charts.
The Charts
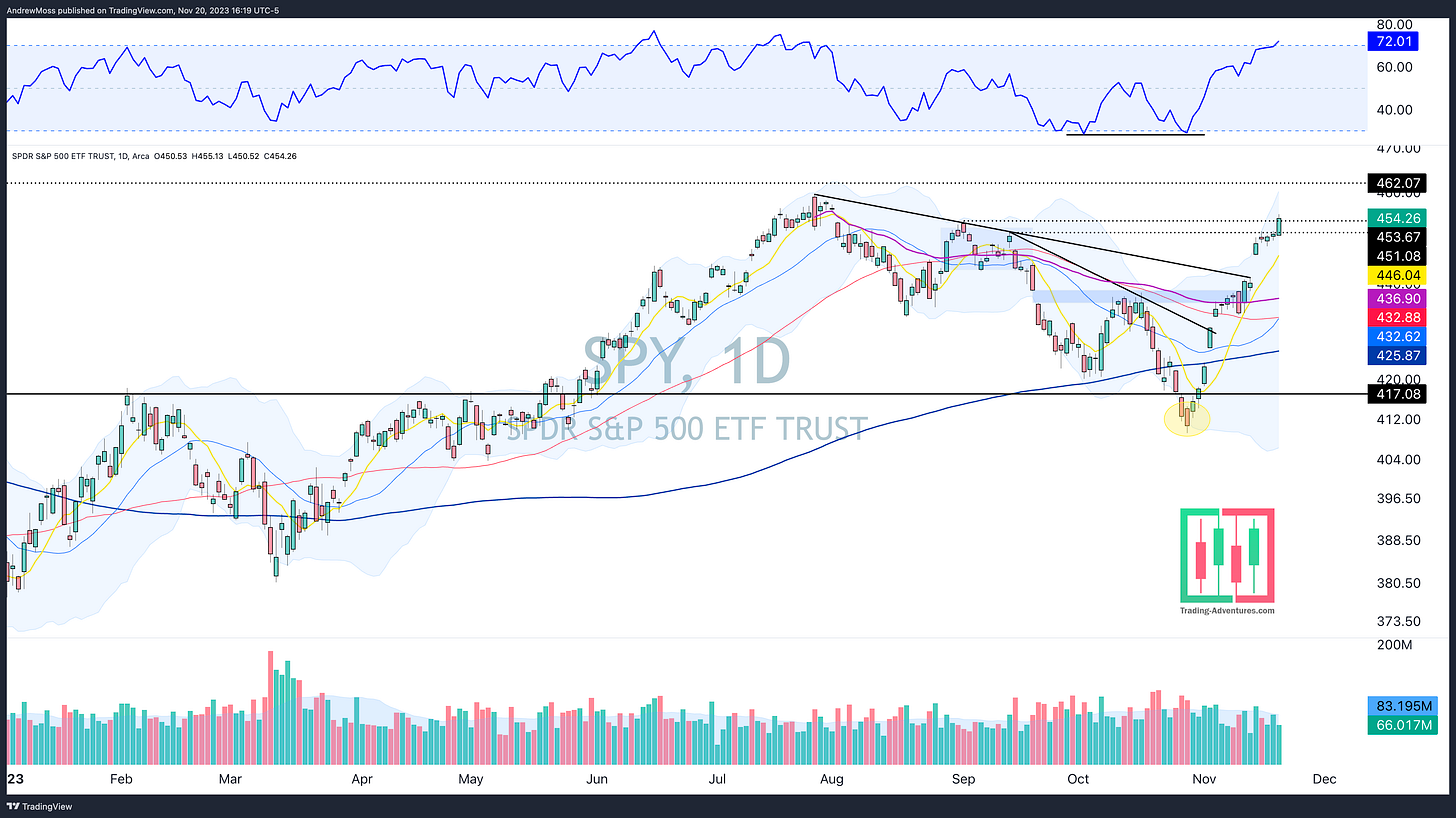
SPY continues higher out of the high-level consolidation pattern. It’s through another pivot level. RSI is finally above 70 while the 21-day MA is nearly $20 below. The strength has been very nice. And the most bullish thing stocks can do is become overbought and then stay that way.
At some point price and the short-term equilibrium (the 8 and 21-day MAs) will move closer together. Be ready when it happens.
QQQ is making a new 2023 high. RSI reaches 72+ and it has the same extended scenario as SPY above.
IWM is making progress above the gap area and wants to test the 200-day MA. RSI at only 61 says it has plenty of room to do so.
DIA takes out another pivot level and has the looks of a bull flag breakout pattern.
TLT continues higher as well and soon may test the $91.85 pivot. Getting above there and then maintaining a trading range would be constructive for stocks.
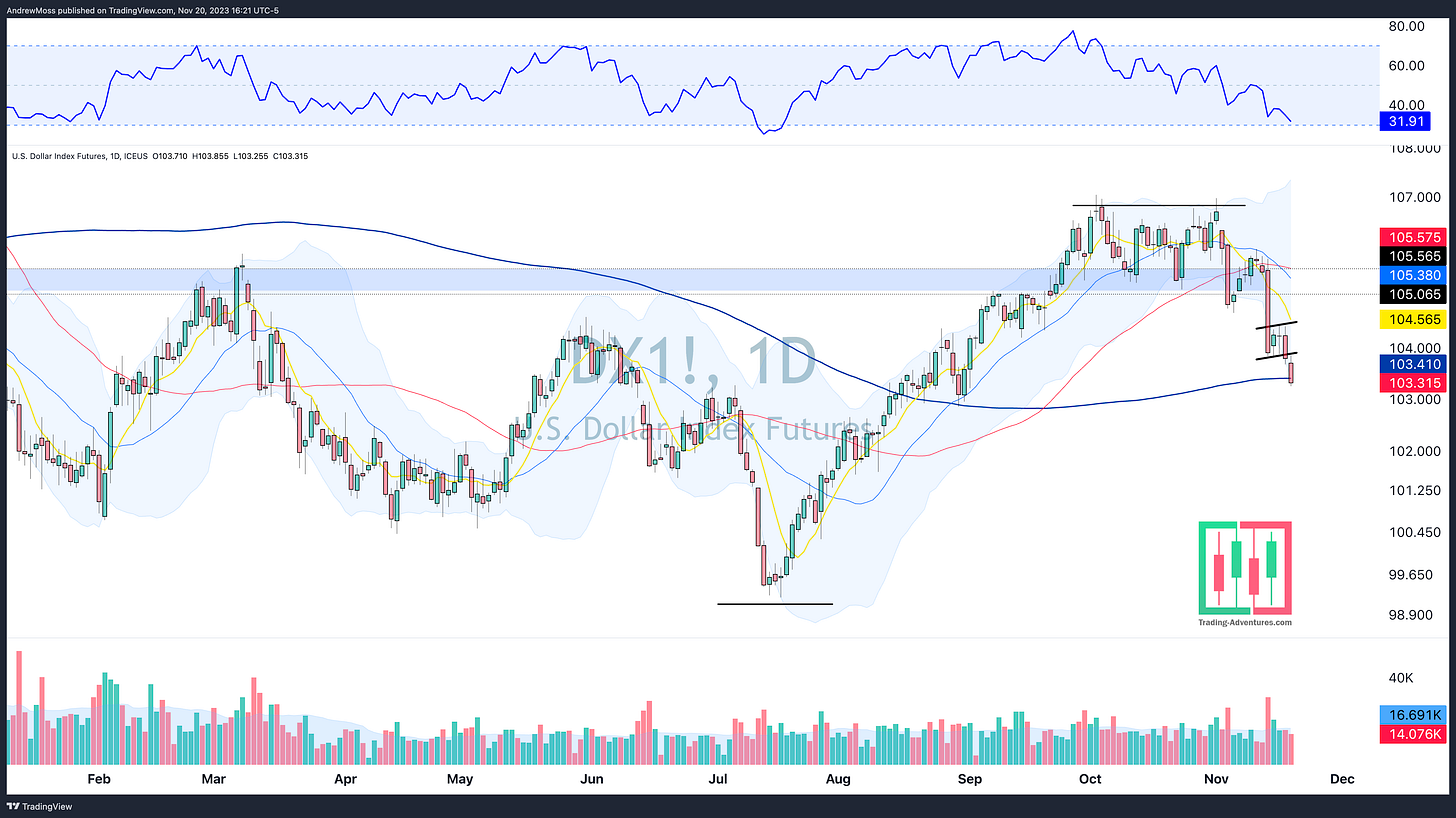
DXY the Dollar broke lower from the bear flag pattern allowing room for all the moves in the previous charts. Now it is testing and poking below its 200-day MA. RSI has nearly become oversold.
The Closing Bell
The bullish action continues during this historically bullish time of year. Shocking.
Stocks remain extended. Another reminder, this condition will be resolved at some point. So it’s probably best to be patient and selective when looking to add new long exposure.
In the meantime, continue to take some profits and move stops up along the way.
Trim and trail.
This will be the only note this week since we have Thanksgiving on Thursday. Have a wonderful time with family, friends, and food this week.
Back to the normal schedule next week.
The Disclosures
***This is NOT financial advice. NOT a recommendation to buy, sell, or trade any security. The content presented here is intended for educational purposes only.
Andrew Moss is an associated member of T3 Trading Group, LLC (“T3TG”) a SEC registered broker/dealer and member of FINRA/SIPC. All trades placed by Mr. Moss are done through T3TG.
Statements in this article represent the opinions of that person only and do not necessarily reflect the opinions of T3TG or any other person associated with T3TG.
It is possible that Mr. Moss may hold an investment position (or may be contemplating holding an investment position) that is inconsistent with the information provided or the opinion being expressed. This may reflect the financial or other circumstances of the individual or it may reflect some other consideration. Readers of this article should take this into account when evaluating the information provided or the opinions being expressed.
All investments are subject to the risk of loss, which you should consider in making any investment decisions. Readers of this article should consult with their financial advisors, attorneys, accountants, or other qualified investors prior to making any investment decision.
POSITION DISCLOSURE
November 20, 2023, 4:00 PM
Long: AMZN, IWM, IWM1215C180, LABU, TGTX, TSLA1215P200, XBI1215C72
Short:
Options symbols are denoted as follows:
Ticker, Date, Call/Put, Strike Price
Example: VXX1218C30 = VXX 12/18 Call with a $30 strike


