Up to the Minute(s)
Midweek Market Update February 22, 2023
Though it may be slowing ever so slightly, the trend of market action being tethered to the next piece of economic news, inflation data, or Federal Reserve comments continues.
Heading into the 2:00 PM announcement the SP 500 index was trading up +0.33% after being down by just about as much earlier in the day while the indecision and anticipation kept tight boundaries in place.
For the bigger picture, some are viewing the recent selloff as worrisome; a natural reaction as year-long downtrends aren’t easily forgotten. But if we can stay open-minded to at least the possibility of more positive movement we can notice that there is still room, and significant potential support just below.
In fact, the SPX has room to move another 2-3% lower while still keeping the recent uptrend intact.
3928 to 3940 could provide support in the form of:
200-day moving average 3940.87
A re-test of the downtrend line extending back to the all-time high
Another test of the shorter-term uptrend line extending back to the Oct. ‘22 low
And the VWAP anchored to that same low - 3928.69
As long as that support can hold, this is still bullish territory.
Before it can get to that point, however, it’s trying to put in a hammer candle just above the 50-day MA.
Last week was a mixed bag, with some news getting shrugged off, and some having a bigger impact.
We will see which way the FOMC minutes direct.
QQQ is similarly trying to complete a hammer candle. However, this one is taking shape just above the 200-day MA and the YTD AVWAP.
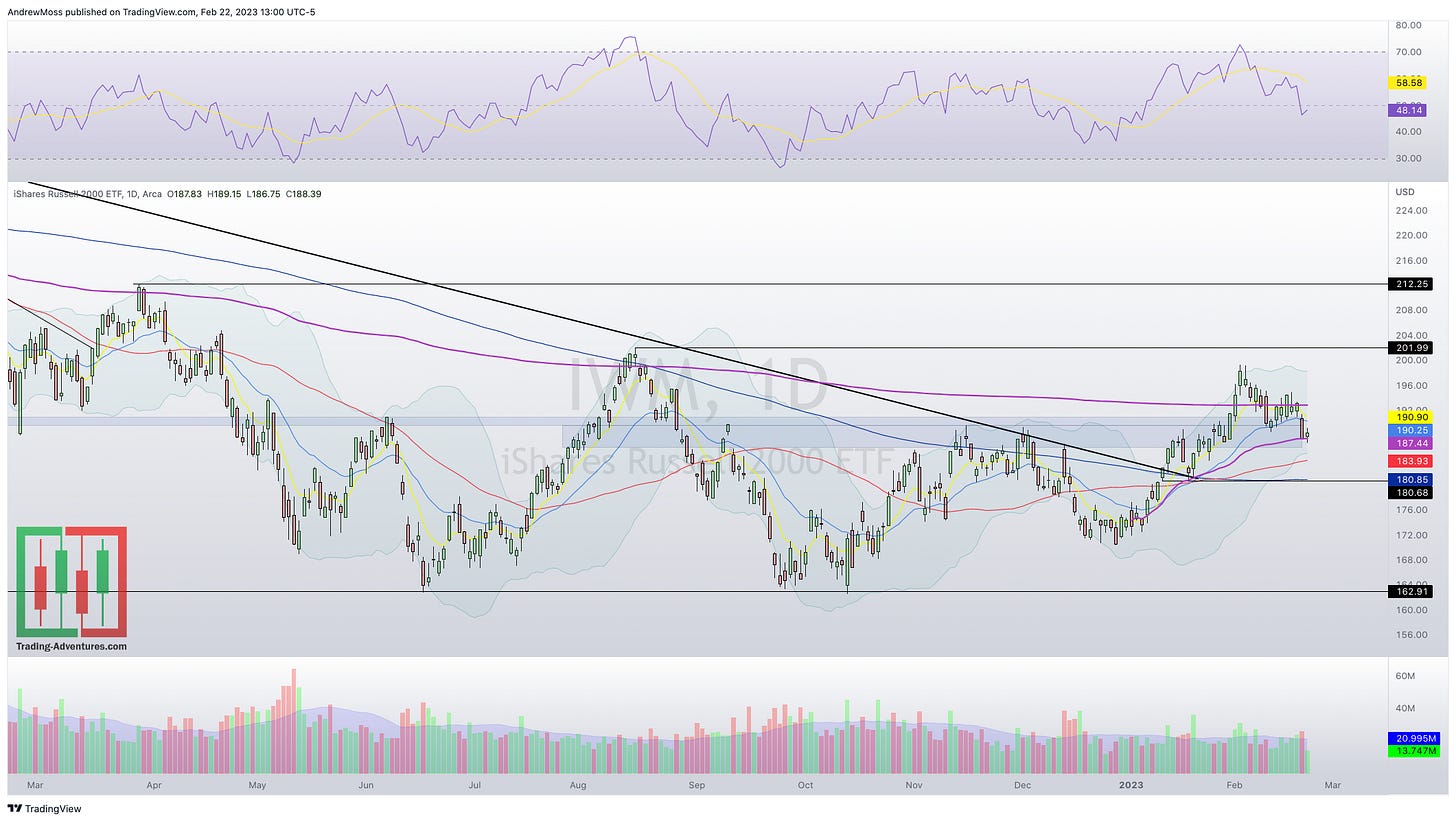
IWM is back in the support/resistance zone, which isn’t great. But it still has a chance for this to be a successful retest.
DIA continues to be a bit problematic as it has broken below a short-term trend line and is moving beneath the 8,21, and 50-day MAs. Similar to SPX mentioned above, a 2-3% move lower for DIA would still have it above some support, and the 200-day MA. A retest there would be ok. A move below that would warrant much caution.
DXY - The Dollar continues marching higher, although possibly with a dampened ability to hinder stocks’ advance.
VIX - Volatility has managed to rise to levels not seen since the beginning of the year.
The news and the reaction will be out soon.
I’ll have updated charts and thoughts after the close at @Andy__Moss
***This is NOT financial advice. NOT a recommendation to buy, sell, or trade any security. The content presented here is intended for educational purposes only.
Andrew Moss is an associated member of T3 Trading Group, LLC (“T3TG”) a SEC registered broker/dealer and member of FINRA/SIPC. All trades placed by Mr. Moss are done through T3TG.
Statements in this article represent the opinions of that person only and do not necessarily reflect the opinions of T3TG or any other person associated with T3TG.
It is possible that Mr. Moss may hold an investment position (or may be contemplating holding an investment position) that is inconsistent with the information provided or the opinion being expressed. This may reflect the financial or other circumstances of the individual or it may reflect some other consideration. Readers of this article should take this into account when evaluating the information provided or the opinions being expressed.
All investments are subject to risk of loss, which you should consider in making any investment decisions. Readers of this article should consult with their financial advisors, attorneys, accountants or other qualified investors prior to making any investment decision.
POSITION DISCLOSURE
February 22, 2023 4:00 PM
Long: BABA0224C105, ENPH, META0303C175, SE0224C70, SNAP0224C12
Short:
Options symbols are denoted as follows:
Ticker, Date, Call/Put, Strike Price
Example: VXX1218C30 = VXX 12/18 Call with a $30 strike


