Updating the Map
Weekend Market Update July 21, 2023
Epic Trades from David Prince is live!
If you want actionable trade ideas in your inbox each week sign up now.
The service has an impeccable track record. And you’ll get alerts and updates throughout the course of each trade in clear language that’s easy to follow.
The Market
Back in early June, we mapped out a potential move for the SP 500 to $4630.
Looking Ahead - Mapping Out A Path to 4630
Year-end looked reasonable, even if a tad optimistic at the time. Remember, we had just watched the index get rejected at $4200 nearly a dozen times. And sentiment told us that there still weren’t many believers in the new bull market.
Then we took the optimism up a notch by applying a cycle analysis which suggested that the target was potentially achievable by mid-October, only 20 weeks away.
Now we aren’t even halfway through that timespan and SPX is firmly above the breakout level and a mere 2% away from the objective.
What’s next?
First, just like bear markets can hurt worse than anticipated, bull markets can run faster and further than expected. This move has been no exception and has already fervently stoked the pessimists and bubble callers.
Second, we are still looking for the late summer seasonal dip to materialize. It’s very likely these last two days are the start of that. The average return for SPX in August of pre-election years is 0.4%.
If historical tendencies persist and we reach the end of August with a 0.4% advance; or even if the market goes down slightly, we’ll still be right on schedule for an October arrival at $4630.
The Charts
SPY is still healthy and above the 8-day MA. But, with two consecutive red candles. We haven’t seen that in over a month.
QQQ put in three red candles and the topping formation has played out as expected so far. It’s below the 8-day MA meaning some of the short-term momentum is gone. Next up is the 21-day and $371-$372 pivot area.
IWM needed two big red candles just to get back to the 8-day MA. Strength is still there, for now.
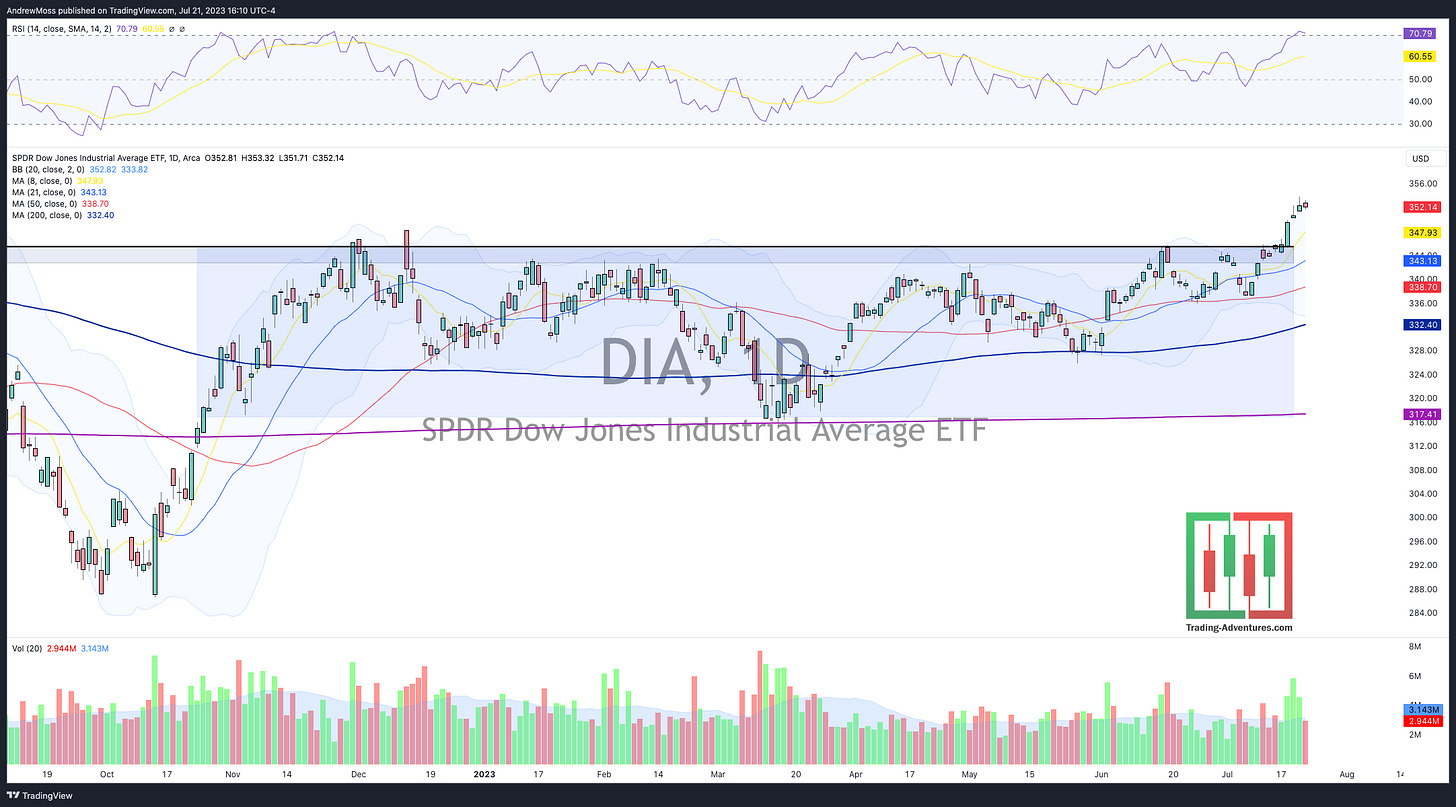
DIA has an inside day today and is holding the recent breakout very well.
The Closing Bell
The Market is strong. And the uptrend is still firmly in place. But as these last two days have shown, and as the previous two articles here have suggested, it’s a time to ease off the gas pedal a bit.
That doesn’t mean we should flip short right away. But it is likely that exercising patience now will grant the opportunity for better buys over the next several weeks.
We shall see.
Weekend Weekly Charts in the Morning! See you there!
The Disclosure
***This is NOT financial advice. NOT a recommendation to buy, sell, or trade any security. The content presented here is intended for educational purposes only.
Andrew Moss is an associated member of T3 Trading Group, LLC (“T3TG”) a SEC registered broker/dealer and member of FINRA/SIPC. All trades placed by Mr. Moss are done through T3TG.
Statements in this article represent the opinions of that person only and do not necessarily reflect the opinions of T3TG or any other person associated with T3TG.
It is possible that Mr. Moss may hold an investment position (or may be contemplating holding an investment position) that is inconsistent with the information provided or the opinion being expressed. This may reflect the financial or other circumstances of the individual or it may reflect some other consideration. Readers of this article should take this into account when evaluating the information provided or the opinions being expressed.
All investments are subject to the risk of loss, which you should consider in making any investment decisions. Readers of this article should consult with their financial advisors, attorneys, accountants, or other qualified investors prior to making any investment decision.
POSITION DISCLOSURE
July 21, 2023, 4:00 PM
Long: SNAP0818C14, TOST0818C27
Short:
Options symbols are denoted as follows:
Ticker, Date, Call/Put, Strike Price
Example: VXX1218C30 = VXX 12/18 Call with a $30 strike


